
The three major U.S. rig tallies are telling the same structural story and three different weekly headlines. Baker Hughes held unchanged at 588 for a second straight week. WellDatabase printed 601, down 30 week over week but up 23 year over year. Enverus’s GPS-based daily count continues to run well above both weekly censuses, last publicly shown near 649 in mid-August and averaging about 638 in late July.
The weekly “drop” on WellDatabase is almost entirely North Dakota and the Williston Basin (both −30). Baker Hughes shows Williston flat at 27. That gap, plus WellDatabase’s large swing in “undisclosed” well types and a −29 print in vertical wells, points to a classification change in the WellDatabase file rather than 30 rigs stacking out of the Bakken in seven days. The rest of the Lower 48 looks steady-to-slightly firmer.;
That is why the year-over-year tape still matters more than one noisy week. Baker Hughes is up 51 rigs from 537 a year ago. WellDatabase is up 23 from its year-ago print. Oil-directed activity on Baker Hughes rose 2 this week to 449; gas fell 2 to 130. WellDatabase shows oil at 423 (−5) and gas at 132 (+5). Horizontal work remains the engine: 511 on WellDatabase (+1) versus 46 vertical (−29).
How the three counts compare this week
|
Source
|
Latest total
|
Week change
|
Year change
|
Oil
|
Gas
|
Notes
|
|---|---|---|---|---|---|---|
|
Baker Hughes (Sept. 4)
|
588
|
0
|
+51
|
449 (+2)
|
130 (−2)
|
Misc. 9; Canada 204 (−7)
|
|
WellDatabase (Sept. 4)
|
601
|
−30
|
+23
|
423 (−5)
|
132 (+5)
|
ND/Williston −30; vertical −29
|
|
Enverus (latest public)
|
~638–649
|
mixed / slightly softer mid-Aug
|
~+13% late July
|
n/a public
|
n/a public
|
GPS daily; broader active fleet
|
Baker Hughes remains the industry’s long-running Friday rotary benchmark. Enverus captures a larger share of the working fleet in near real time. WellDatabase is the most useful for operator, county, basin, well type, wellbore, and depth cuts — which is why the North Dakota print this week needs a footnote, not a panic.
Basins and states: Permian still the floor
Baker Hughes basins this week: Permian 268 (+1), Eagle Ford 50 (flat), Haynesville 56 (−1), Cana Woodford 21 (+1), DJ-Niobrara 11 (+1), Williston 27 (flat), Marcellus 23 (−1), Utica 10 (flat).
WellDatabase basins: Permian 267 (flat, +12 year over year), Haynesville 57 (flat, +18 YoY), Eagle Ford 50 (flat, +11 YoY), Williston 40 (−30), Other 100 (+2), Marcellus 24 (flat), Cana Woodford 20 (flat), Granite Wash 19 (flat), DJ-Niobrara 10 (−1), Utica 10 (−1).WellDatabase states: Texas 282 (+1, +41 YoY to 241 last year), New Mexico 95 (−1), Oklahoma 51 (flat, +8 YoY), North Dakota 37 (−30), Louisiana 36 (+1), Pennsylvania 16 (flat), Wyoming 15 (+1), Utah 13, Alaska 12, Colorado 12 (−1).
The Permian is not running away from the field, but it is not giving ground either. Gas basins have done more of the year-over-year work — Haynesville especially — as data-center power and LNG keep a bid under gas-directed drilling even when oil prices whip around.
Companies: XTO added, Continental trimmed, “Unknown” still large
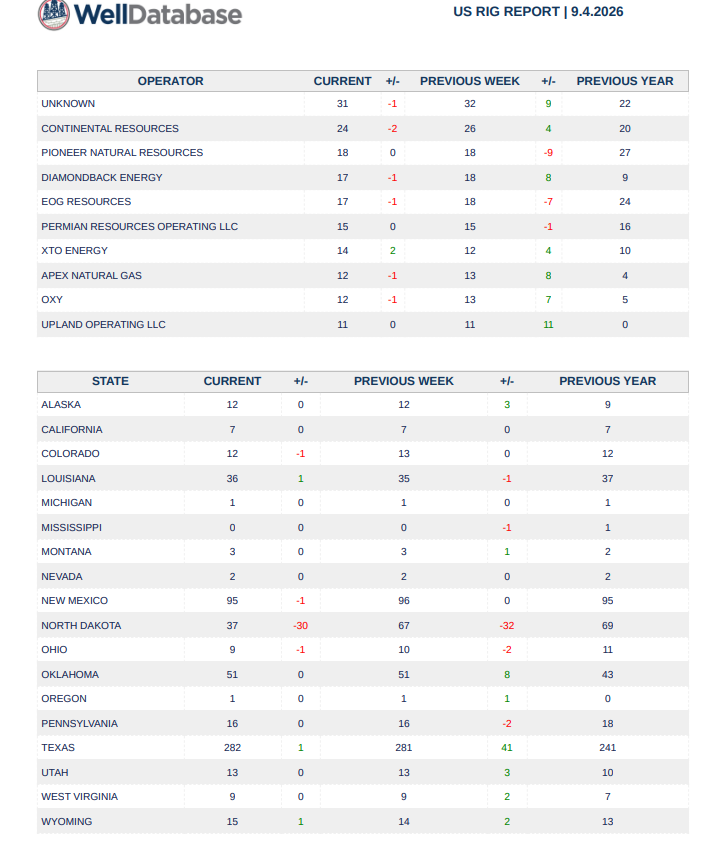
Here is the Basin breakout.
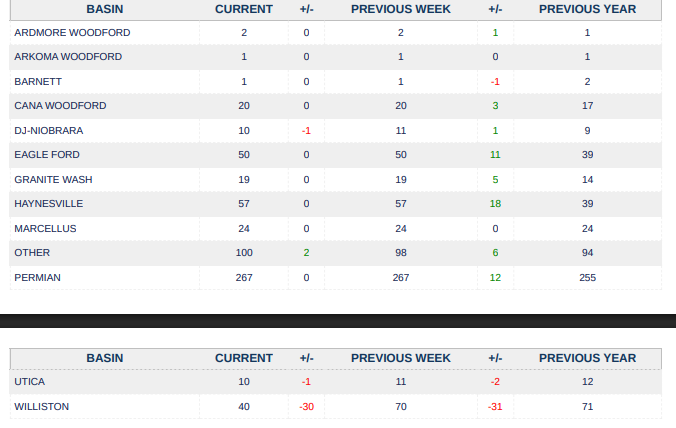
WellDatabase’s top operators this week:
Unknown — 31 (−1)
Continental Resources — 24 (−2)
Pioneer Natural Resources — 18 (flat; −9 year over year)
Diamondback Energy — 17 (−1)
EOG Resources — 17 (−1)
Permian Resources Operating — 15 (flat)
XTO Energy — 14 (+2, the clearest named weekly add)
Apex Natural Gas — 12 (−1)
Oxy — 12 (−1)
Upland Operating — 11 (flat; +11 year over year from zero)
The named weekly movers are modest. XTO is the standout adder. Continental, Diamondback, EOG, Apex, and Oxy each gave back a rig or two. Pioneer is unchanged this week but down sharply versus last year. Upland’s year-over-year jump from zero to 11 is the biggest percentage story in the top 10. The “Unknown” bucket at 31 is still large enough that some of the state-level noise may live there.
None of the top-10 operator moves explain a 30-rig Williston collapse. That is another reason to treat this week’s WellDatabase North Dakota line as a data event first.SPR and Cushing: the reserve is still draining; the hub has bounced off the floor
The latest EIA Weekly Petroleum Status Report (week ending Aug. 28, released Sept. 2) is the inventory tape that sits under this rig report.SPR: 286.6 million barrels, down 3.1 million on the week. That is about 40% of the 714-million-barrel design capacity and more than 117 million barrels below year-ago levels. Draws have been persistent through the summer after the large 2026 release program tied to Middle East supply disruptions. The reserve is in the same neighborhood as early-1980s lows.
Cushing, Okla.: 22.51 million barrels, up about 80,000 on the week. That is a recovery from the July dip near 18.6 million, when the hub was flirting with what traders treat as operational tank bottoms (often cited around 20 million barrels). Utilization is still only about 30% of shell capacity. Tight, not empty.
U.S. commercial crude (ex-SPR): 424.5 million barrels, a 4.5-million-barrel draw — much larger than the ~0.3 million consensus. Refinery utilization printed near 98%. U.S. crude production was reported around 13.86 million barrels a day.
The combination is unusual: emergency stocks still falling, the WTI delivery hub off the worst of the summer squeeze but not rebuilt, commercial crude drawing while refineries run hard. That is a tight physical market even when the paper market is chopping.
Oil prices and what analysts are saying
WTI spent this week in the high $80s to low $90s. Futures traded as high as about $93 early in the week and were back near $89–$91 on Friday as the rig numbers hit. Brent has been in a similar band. The tape is still carrying a geopolitical risk premium around Iran and the Strait of Hormuz, even after earlier reopenings and ceasefire headlines.
The analyst book is split between “the worst of the supply shock is fading” and “inventories are too tight to get comfortable.”EIA’s August Short-Term Energy Outlook had Brent averaging about $85 in 3Q26 and $78 in 4Q26 as Hormuz flows normalize and shut-in barrels return, then lower again into 2027. That outlook also has U.S. crude production rising from a 2025 record near 13.6 million b/d toward 13.8 million b/d in 2026.
A Reuters poll earlier in the summer cut 2026 averages after Hormuz traffic improved (Brent ~$84.50, WTI ~$79.50 for the full year at that snapshot). Several banks, including Goldman, have marked Q4 forecasts down into the $70s–$80s on a base case that the strait stays open — while keeping a much higher tail if hostilities resume.
Technical desks this week were watching a hold above roughly $87–$90 and a clean break of the $92 area as the next bull trigger, with $94 cited as a measured-move target if the short-term uptrend extends.
The rig count is consistent with that messy middle: operators are not launching a 2022-style boom, and they are not abandoning the Permian. They are adding oil rigs in ones and twos on Baker Hughes, holding gas activity better than the last cycle, and letting efficiency (longer laterals, higher horizontal share) do more of the production work than raw rig additions.
Bottom line
Baker Hughes is the clean weekly print: 588, unchanged, oil +2, Permian +1. WellDatabase is higher at 601 and still up year over year, but this week’s −30 is a Williston/classification story, not a Bakken exodus. Enverus continues to show a busier field than either weekly census.
Stack that against an SPR at 286.6 million barrels and still drawing, Cushing only just above the summer low, a 4.5-million-barrel commercial crude draw, and WTI hanging around $90 with Iran risk still in the option surface. Drilling is disciplined. The inventory cushion is not.
We highly recommend the subscription at WellDatabase as it provides very detailed information.
Appendix: Sources and links
Rig counts
- WellDatabase US Rig Report, Sept. 4, 2026 (attached client file): total 601, −30 week, +23 year; operator, state, basin, well-type, wellbore, and depth tables as cited above.
- Baker Hughes North America Rig Count, Sept. 4, 2026: https://rigcount.bakerhughes.com/na-rig-count/
- Baker Hughes overview/summary: https://rigcount.bakerhughes.com/rig-count-overview/
- Oil & Gas 360 recap of the Sept. 4 Baker Hughes report: https://www.oilandgas360.com/baker-hughes-rig-count-9-4/
- AOGR Baker Hughes weekly table: https://www.aogr.com/web-exclusives/us-rig-count
- Reuters / BOE Report write-up of the unchanged 588 print: https://boereport.com/2026/09/04/us-energy-firms-leave-rig-count-unchanged-for-the-second-consecutive-week-baker-hughes-says/
- YCharts Baker Hughes series: https://ycharts.com/indicators/us_rotary_rigs
- Enverus Daily Rig Count product page: https://www.enverus.com/dailyrigcount/
- Enverus mid-August public daily snapshot (649 on Aug. 15): https://app.drillinginfo.com/drc/
- Enverus late-July average (~637.6, +13% YoY) via Midland Reporter-Telegram / Enverus rankings: https://www.mrt.com/business/oil/article/enverus-land-drilling-rankings-tx-22406134.php
- Prior Energy News Beat methodology note comparing the three sources: https://energynewsbeat.co/weekly-rig-count/us-rig-count-up-slightly-this-week-as-we-compare-baker-hughes-enverus-and-welldatabase/
SPR, Cushing, and inventories
- EIA Weekly Petroleum Status Report (week ending Aug. 28, released Sept. 2): https://www.eia.gov/petroleum/supply/weekly/
- EIA SPR weekly stocks: https://www.eia.gov/dnav/pet/pet_stoc_wstk_a_epc0_sas_mbbl_w.htm
- EIA Cushing weekly stocks: https://www.eia.gov/dnav/pet/pet_stoc_wstk_dcu_ycuok_w.htm
- YCharts SPR: https://ycharts.com/indicators/us_ending_stocks_of_crude_oil_in_the_strategic_petroleum_reserve
- YCharts Cushing: https://ycharts.com/indicators/weekly_cushing_ok_ending_stocks_crude_oil
- StorageCurve SPR chart (286.6 million barrels, −3.1 million): https://storagecurve.com/crude-oil/us/strategic-petroleum-reserve/
- WSJ / Dow Jones on the 4.5-million-barrel commercial crude draw: https://www.wsj.com/business/energy-oil/u-s-crude-oil-stockpiles-see-larger-than-expected-drop-ed60334e
- Morningstar reprint of the same EIA recap (SPR 286.6, Cushing 22.5): https://www.morningstar.com/news/dow-jones/202609025290/us-crude-oil-stockpiles-see-larger-than-expected-drop
Prices and analyst commentary
- Investing.com WTI futures tape around Sept. 4: https://www.investing.com/commodities/crude-oil-historical-data
- EIA Short-Term Energy Outlook (August 2026 release; next due Sept. 9): https://www.eia.gov/outlooks/steo/
- Reuters June 2026 analyst poll cutting 2026 averages after Hormuz reopening: https://www.reuters.com/business/energy/poll-analysts-dial-down-oil-forecasts-hormuz-reopening-eases-supply-concerns-2026-06-30/
- FXStreet WTI technical/geopolitical note, Sept. 4: https://www.fxstreet.com/news/wti-price-forecast-bulls-await-acceptance-above-9000-and-618-fibo-amid-iran-risks-202609040446
- FXEmpire channel-breakout note targeting ~$94: https://www.fxempire.com/forecasts/article/wti-crude-oil-price-forecast-channel-breakout-targets-94-and-higher-1622703
- OilPrice.com / Goldman forecast cut after ceasefire headlines: https://ng.investing.com/analysis/goldman-cuts-oil-price-forecasts-after-ceasefire-announcement-215281
WellDatabase figures in the body are taken from the Sept. 4, 2026 US Rig Report provided with this assignment. Baker Hughes, Enverus, EIA, and price/forecast figures are from the public sources listed above.