As we navigate through July 2025, the global energy landscape continues to evolve amid economic uncertainties, policy shifts, and fluctuating demand. From traditional fossil fuels to emerging renewables, various sectors are experiencing notable movements—some upward, others facing headwinds. This article examines key markets, starting with the concerning decline in U.S. clean energy developers, and extends to aluminum, ethanol, refinery companies, oil, and natural gas. Drawing on recent data, we’ll highlight trends, challenges, and potential trajectories for the remainder of the year.
The Drop in Clean Energy Developers in the U.S.The U.S. clean energy sector, once buoyed by ambitious incentives like the Inflation Reduction Act (IRA), is facing a stark slowdown in 2025.
Are you from California or New York and need a tax break?
As of April, businesses have canceled or downsized over $14 billion in investments and 10,000 new jobs in clean energy projects.
This contraction signals a market in retreat, potentially shifting capital back to fossil fuels unless policy incentives rebound.
Aluminum Market Trends
Aluminum, a key material in energy infrastructure from solar panels to electric vehicles, is grappling with oversupply and subdued prices in July 2025. The global primary aluminum market is projected to see a surplus of 390,000 tonnes this year, driven by robust production in the first five months.
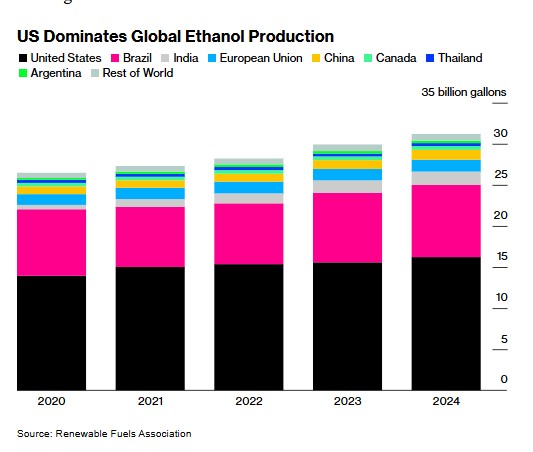
Ethanol Market Movements
Ethanol, a biofuel staple, shows mixed but generally positive momentum in July 2025, bolstered by seasonal demand and production boosts. Prices have risen to $1.81 per gallon, up 0.98% daily and 10.74% monthly, though down slightly year-over-year.
Pacific Northwest ethanol exports to Southeast Asia averaged $719.01 per metric ton, up 0.1% weekly but down 8.9% annually
The EIA has boosted its 2026 production outlook while maintaining 1.06 million barrels per day for 2025.
Holiday demand rebounded last week, pushing domestic use to 14.5 billion gallons annually, with inventories edging lower.
U.S. ethanol exports are projected at a record 1.85 billion gallons for fiscal year 2025.
Prices climbed steadily in Q1, reaching $497 per metric ton in March due to rising corn costs.
Ethanol is moving upward on demand recovery, positioning it as a resilient segment amid broader energy transitions.
Refinery Companies Performance
Refinery companies are navigating tightening margins and operational challenges in 2025, with a short-term boost from higher global margins. Costs and margins are dictating futures, with refining capacity potentially shrinking 10-30% over the next decade regionally.
Oil prices and refinery margins fell slightly in Q1, with U.S. utilization dropping below 90% by mid-January to 86% by quarter-end.
Global composite margins hit $8.37 per barrel in May, the highest since March 2024.

Marathon Petroleum reported segment adjusted EBITDA of $1.7 billion in Q1, up from $1.6 billion year-over-year.
U.S. refining capacity remains largely unchanged at January levels, with top refiners like Marathon, Valero, and ExxonMobil showing under 1% increases
Throughputs are forecast to rise modestly by 460 kb/d in 2025 and 2026.
However, utilization hit 93.9% as of July 11, signaling energy transition pressures and maintenance issues.
Refineries are in a transitional phase, with margins providing temporary uplift but long-term contraction looming.
Oil Market
Oil prices are under pressure in July 2025, reflecting slowed demand growth and ample supply. Brent crude settled at $68.52 per barrel, down 0.3% daily, while WTI fell to around $67.30.
On July 14, Brent stood at $69.18 per barrel.
World oil demand growth is forecast at just 700 kb/d this year—the lowest since 2009 outside of 2020.
J.P. Morgan has lowered forecasts to $66/bbl for 2025 and $58/bbl for 2026.
EIA’s STEO pegs Brent at $69 for the period.
Prices have declined 8.86% monthly for crude.
Mixed U.S. economic data and tariffs offset new Russia sanctions.
Oil is moving downward, constrained by weak demand signals.
Natural Gas Market
Natural gas prices are volatile but gaining ground in July 2025, driven by heat waves and demand. Prices rose to $3.57 per MMBtu, up 0.73% daily, though down 12.66% monthly.
Henry Hub averaged $3.67 per MMBtu in H1, up from $2.11 last year.
August contracts closed at $3.567, up 0.71%
Forecasts predict prices averaging $3.618 for July, with highs to $4.152
Residential prices are expected to drop to $12.00 per Mcf in 2025, down 22% adjusted for inflation.
Tight supply and LNG demand support strength.
Natural gas is moving upward on weather-driven demand.
Conclusion
In July 2025, energy markets are diverging: clean energy developers in the U.S. are contracting sharply, while aluminum faces pricing pressures amid a surplus, and ethanol and natural gas show upward resilience. Refineries benefit from short-term margin boosts, but oil prices are expected to remain flat in the next few weeks due to already high demand. Investors should monitor policy changes and weather patterns, as these could accelerate shifts in these dynamic sectors. Stay tuned to Energy News Beat for ongoing updates.
Is Oil & Gas Right for Your Portfolio?
Crude Oil, LNG, Jet Fuel price quote
ENB Top News
ENB
Energy Dashboard
ENB Podcast
ENB Substack