Core services inflation dished up bad head fakes last time we had this mess in 1966-1982. Mention of a rate hike crops up in a Fed speech.
By Wolf Richter for WOLF STREET.
Over the past year or so, the Fed has been intensely discussing inflation in “core services,” which is where inflation had shifted to in 2022, from goods inflation which had spiked into mid-2022 but then cooled dramatically. So “core services” is where it’s at. Core services is where consumers spend the majority of their money. Core services are all services except energy services. Core services inflation has been behaving badly for months, and in January, it spiked out the wazoo.
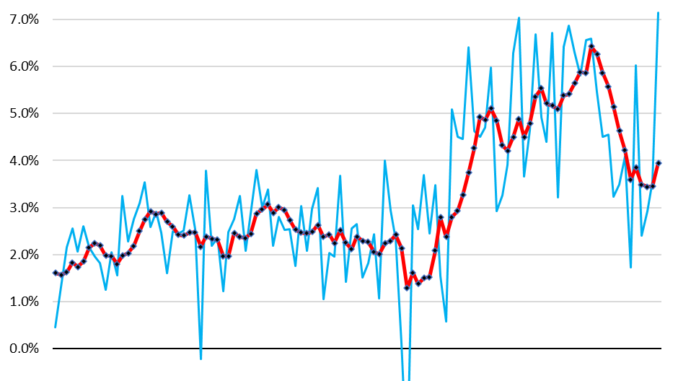
The “core services” PCE price index spiked to 7.15% annualized in January from December, the worst month-to-month jump in 22 years (blue line), according to index data released today by the Bureau of Economic Analysis. Drivers of the spike were non-housing measures as well as housing inflation. More on each category in a moment.
The six-month moving average, which irons out the month-to-month volatility, accelerated to 3.95% annualized, the worst since July, after having gotten stuck at the 3.5% level for three months in a row (red).
The bad behavior of core services inflation that we have been lamenting since June – and which was confirmed earlier this month by the nasty surprise in the CPI – is why Fed governors have said this year in near unison that they’re in no hurry to cut rates, but have taken a wait-and-see approach. And now the concept of rate hikes is cropping up in their speeches again.
For example, Fed governor Michelle Bowman said in the speech yesterday, that she was “willing to raise the federal funds rate at a future meeting should the incoming data indicate that progress on inflation has stalled or reversed.”
Even year-over-year, core services inflation has now reversed and accelerated to 4.1%.
The 7 Core Services Categories.
Core services – services without energy services, such as water and electricity – are grouped into seven PCE price indices, and we’ll look at them individually.
This is where consumers do the majority of their spending. The month-to-month data in these categories of core services can be crazy volatile (blue in the charts below), so we’ll focus on the six-month moving average, which irons out this volatility and shows the recent trends (red in the charts below).
Housing inflation is hot. The PCE price index for housing accelerated to 6.4% annualized in January from December, the worst since September (blue).
The six-month moving average, which irons out the month-to-month volatility but still shows the more recent trends, accelerated to 5.7% annualized, having now been in the same range since August (red).
Housing inflation has backed off from the crazy spike in 2022 and through February 2023. But then it just got stuck at this hot level of 5.5%-plus, and has refused to cool further and seems to be re-accelerating now.
The housing index is broad-based and includes factors for rent in tenant-occupied dwellings; imputed rent for owner-occupied housing, group housing, and rental value of farm dwellings.
Financial Services and Insurance: +17.2% month-to-month annualized (blue); +5.5% six-month moving average annualized; third month in a row of acceleration (red):
Food services and accommodation: +8.25 month-to-month annualized (blue); +4.0% six-month moving average annualized; second month of acceleration (red):
Health Care: +3.5% month-to-month annualized (blue), +2.4% six-month moving average annualized, roughly stable at this rate for the past five months (red).
Transportation services: +0.4% month-to-month annualized (blue), +3.2% six-month moving average annualized (red).
Includes motor vehicle services, such as maintenance and repair, car and truck rental and leasing, parking fees, tolls, and public transportation from airline fares to bus fares.
Recreation services: +4.6% month-to-month annualized (blue), +4.9% six-month moving average annualized (red).
Includes cable, satellite TV and radio, streaming, concerts, sports, movies, gambling, vet services, package tours, repair and rental of audiovisual and other equipment, maintenance and repair of recreational vehicles, etc.
Other services: +9.4% month-to-month annualized (blue), +2.1% six-month moving average annualized (red).
A vast collection of other services where people spend lots of money on, including broadband, cellphone, and other communications; delivery; household maintenance and repair; moving and storage; education and training across the board; professional services, such as legal, accounting, and tax services; union dues, professional associations dues; funeral and burial services; personal care and clothing services; social services such as homes for the elderly and rehab services, etc.
And so the Core PCE price index…
So the Core PCE price index, which includes core services plus non-energy goods, accelerated month-to-month to 5.1% annualized, the worst in 12 months (blue). The six-month moving average accelerated to 2.5% annualized (red).
The head-fakes last time.
Inflation in core services is tough to beat, and it can dish up big head-fakes – a fact that Powell has mentioned a few times, hence the Fed’s wait-and-see approach.
Last time this type of core-services inflation occurred – in the 1970s and 1980s – there were clear signs that inflation was cooling sharply, and we thought repeatedly that the high interest rates at the time had beaten inflation back down, which caused the Fed to ease, only to find out that we’d fallen for an inflation head-fake, and then the Fed jacked up rates even further.
The head fakes occurred over the 15 years between 1966 and when core services inflation finally peaked at 11% in 1981. So this is the “core services” PCE price index which excludes energy and the oil-price shocks at the time.
And here is Fed Chair Jerome Powell’s reaction when he saw the inflation resurging in core services, as captured by cartoonist Marco Ricolli for WOLF STREET:
