In the race to combat climate change, wind and solar energy have emerged as frontrunners in the transition to renewable power. Governments worldwide have poured billions into these technologies, touting their environmental benefits and potential to reduce reliance on fossil fuels. However, as the global installed capacity of wind turbines and solar panels surges—reaching over 1,173 GW for wind and more than 1,000 GW for solar by 2025—critical questions arise about their end-of-life (EOL) management and long-term viability. Are these systems truly recyclable? What happens to them after their 20-30-year lifespans? And what is the actual life span of a wind farm? And can they compete economically without ongoing government support? This article examines the recycling realities, associated costs, production impacts, subsidies, and sustainability of wind and solar energy, drawing on recent data and projections.
Recycling Wind Energy: High Rates for Most Components, but Blades Pose a ChallengeWind turbines consist of various materials, including steel towers, copper wiring, and composite blades made from fiberglass, carbon fiber, and resins. Overall, wind turbines boast a recyclability rate of 85-90%, with metals like steel and copper easily processed through existing infrastructure.
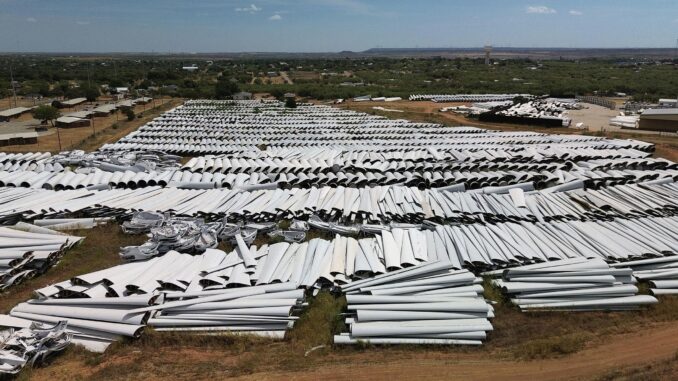
The tower and nacelle components, which make up the bulk of the mass, are routinely recycled, contributing to a circular economy in metals. However, the blades—typically 40-60 meters long and weighing 10-20 tons each—remain a significant hurdle. These composites are durable but difficult to break down, leading to low recycling rates. Currently, most EOL blades in the U.S. are landfilled due to high transportation and processing costs, with limited alternatives like repurposing for bridges or playgrounds.
Projections indicate that between 3,000 and 9,000 blades will be decommissioned annually in the U.S. through 2030, escalating to tens of thousands by 2050.
Globally, cumulative EOL blade waste could reach around 2.1 million metric tons by 2050, with the U.S. alone facing 19% of that volume.
Costs for blade recycling vary widely. Mechanical recycling (shredding for reuse in cement or composites) can cost $200-500 per ton, while advanced methods like chemical solvolysis remain experimental and more expensive.
Landfilling is cheaper at $50-100 per ton, but regulations in places like Europe are pushing for bans—e.g., Germany’s 2025 landfill prohibition for composites.
Dismantling entire turbines adds further expenses, often exceeding developer estimates by 50-100%, with total decommissioning costs per turbine reaching $200,000-500,000.
Innovations like recyclable resins from companies like Vestas aim to boost rates to 100% by 2030, but current projections suggest landfilling will dominate through 2050 unless costs drop.
Recycling Solar Energy: Low Current Rates and Looming Waste MountainsSolar panels, primarily silicon-based (c-Si) or thin-film, contain valuable materials like glass (76-80%), aluminum (8%), silicon (3-5%), copper, and silver. Up to 95% of a panel’s mass is recyclable with existing technology, including 99% non-hazardous components.
However, actual recycling rates are dismal: In the U.S., only 10-15% of EOL panels are recycled, with the rest landfilled or exported.
Globally, projections from IRENA estimate cumulative PV waste at 1.7-8 million metric tons by 2030 and 60-78 million tons by 2050.
In the U.S. alone, annual EOL volumes could hit 0.8-1.5 million tons by 2050, representing 12% of municipal e-waste. Stu Turley on the Energy News Beat Podcast has stated that we have an estimated 89 billion dollar liability for land reclamation for wind turbines in the United States alone.
Based on current trends and material recovery rates, approximately 80% of modules from 2020-2050 are expected to be landfilled, 10% recycled, and 1% reused, with total recycled mass around 0.7 million metric tons—or just 8% of cumulative waste.
Reuse markets exist for functional panels (e.g., secondary sales at $22 vs. $55 new), but scale is limited.
Costs are a major barrier: Recycling averages $15-45 per module, repair $65, and landfilling $1-5 (or $1.38 specifically in some models).
These economics favor landfills, where panels end up leaching potential toxins if not managed properly. Targets like the EU’s 85% recovery rate under WEEE could shift this, but global infrastructure lags.
Environmental Footprint: Chemicals, Byproducts, and Greenhouse Gases in ProductionWhile operational emissions are low, manufacturing wind and solar involves significant environmental impacts. Solar panel production uses chemicals like hydrochloric acid, hydrofluoric acid, sodium hydroxide, sulfuric acid, nitric acid, hydrogen fluoride, phosphine, arsine gas, phosphorus oxychloride/trichloride, boron bromide/trichloride, and lead—confirmed across industry reports.
Byproducts include trichlorosilane gas, silicon tetrachloride (producing 3-4 tons waste per ton of polysilicon), and toxic particulates from wafer sawing.
Greenhouse gases emitted include sulfur hexafluoride (SF6, 23,900-25,000 times more potent than CO2), nitrogen trifluoride (NF3, 17,000 times), and hexafluoroethane (C2F6, 12,000 times)—used in etching and cleaning.
Wind production has lower chemical intensity but involves rare earth mining for magnets, with waste issues. These factors highlight that “green” energy isn’t emission-free cradle-to-grave. Global wind life-cycle emissions could reach 55 million tons CO2 from 2020-2050.
Subsidies: Billions Poured In, But at What Cost?
Subsidies have fueled growth. In the U.S., renewables received $15.6 billion in 2022 (up from $7.4 billion in 2016), with wind and solar claiming the lion’s share via Production Tax Credits (PTC) and Investment Tax Credits (ITC)—totaling over $31 billion in 2024 and projected at $421 billion through 2035.
Wind subsidies alone hit $1.6 billion in PTC in 2011 and $18.7 billion from 2016-2022.
Globally, renewable subsidies reached $128 billion in 2017 (20% of energy sector total), with manufacturer incentives at $90 billion since 2020.
The U.S. Inflation Reduction Act added $369 billion more.
Critics argue this distorts markets, as fossil fuels receive $7 trillion globally (mostly implicit), but renewables’ subsidies per unit energy are higher. As mentioned, ethanol subsidies for farmers should be subtracted from that number, as ethanol is worse for the environment and engines. Ethanol receives $10 to $ 15 billion in effective annual subsidies as of 2024-2025. We will be looking into what they are calling “subsidies” to the fossil fuel industry. There is a difference between subsidies and tax credits for investments.
Sustainability Without Subsidies: A Mixed OutlookCan wind and solar stand alone? Proponents point to falling costs—solar down 84% and wind 56% since 2009—driven by scale and tech, enabling viability amid rising demand from AI and electrification.
Levelized costs (LCOE) for unsubsidized onshore wind ($37-75/MWh) and solar ($15-75/MWh) compete with gas and coal in many regions.
However, skeptics note intermittency requires backups, inflating system costs, and subsidies have artificially lowered prices while raising taxpayer burdens.
Without support, deployment could slow, but mature markets like Texas show resilience only with subsidies. We will go into the storage recycling in another article..
In conclusion, while wind and solar offer recyclable potential, current practices lean toward landfills due to economics, with production entailing hidden environmental costs. Subsidies have accelerated adoption but raise questions about true sustainability. As waste volumes surge, innovation in recycling and policy shifts are essential for these technologies to prove their long-term worth.
Got Questions on investing in oil and gas? Or do you have a Tax Burden in 2025?
Crude Oil, LNG, Jet Fuel price quote
ENB Top News
ENB
Energy Dashboard
ENB Podcast
ENB Substack


Be the first to comment