

This article was first published on the Energy News Beat Substack.
In energy markets, the key metric that separates crude oil prices from what consumers ultimately pay at the pump is the crack spread—the difference between the cost of crude oil feedstock and the market value of refined products such as gasoline, diesel, and jet fuel. It serves as a primary indicator of refinery profitability and margins.
A common benchmark is the 3-2-1 crack spread, which models refining three barrels of crude into two barrels of gasoline and one barrel of diesel (or heating oil). Positive and widening spreads signal strong refining economics; negative or narrow ones indicate pressure.
RBN Energy’s Crack Spread Site
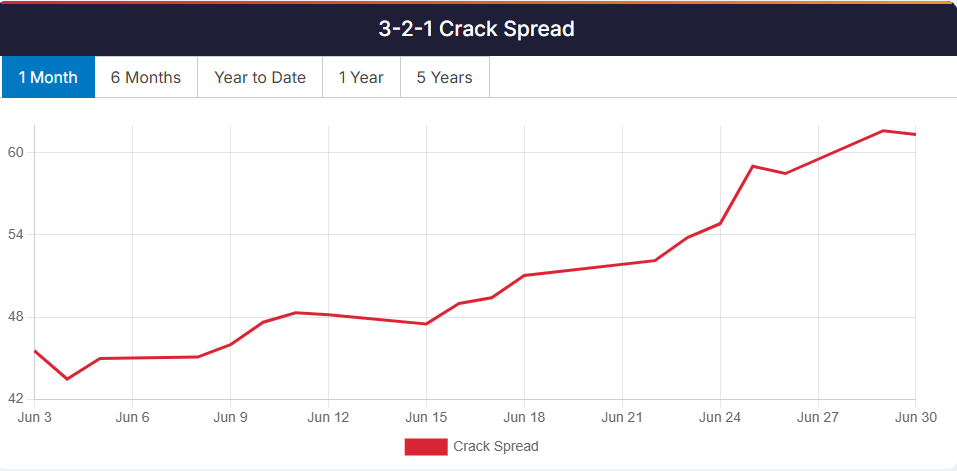
As of early July 2026, crack spreads remain elevated—often behaving as if crude were trading near $110 per barrel, even when benchmark futures sit lower.
This disconnect has fueled debate: Are refineries “gouging” consumers, or do real supply constraints and market dynamics explain the spreads? President Trump has publicly accused oil companies of not passing through lower crude costs fast enough, ordering DOJ scrutiny.
Global Refinery Outages Driving Tight Product Markets
The dominant driver of high crack spreads in 2026 is structural tightness in refined products, not crude abundance alone. Multiple regions face simultaneous major outages:Russia: 25–50% of national refining capacity offline. Eight of the ten largest refineries are offline (e.g., Moscow Kapotnya offline until at least 2027; KINEF has been fully down since May). Diesel seaborne exports collapsed ~50% YoY. Putin floated (then backed off) a diesel export ban.
Persian Gulf: ~$58B in damage; 84 facilities struck; 400–600 kb/d still offline. Kuwait, Bahrain (Bapco force majeure), UAE (Fujairah hit repeatedly), and others impaired. Recovery timeline: up to 2 years per IEA.
Mexico: Two major refineries down (~665 kb/d combined capacity) due to fire and electrical failures since May/June.
US East Coast: Monroe Energy (Trainer, PA) down since June 25; Delta’s 185 kb/d refinery (key jet supplier) hit by pump room fire. East Coast distillate output at 2026 lows.
China: ~3 mb/d offline; teapot refinery utilization plunged from 72% to 54%.
Daily global product losses (bottom-up estimate): Diesel ~1.8–2.4 mb/d (6–8% of global supply); Gasoline ~1.1–1.4 mb/d (4–5%); Jet fuel ~500–650 kb/d (7–9%+).
These outages coincide with strong product demand and falling inventories. Consumers buy products, not crude—explaining why cracks can surge even as some crude benchmarks ease.rbnenergy.com
USGC 3-2-1 crack spreads rose sharply into 2026 amid disruptions (RBN Energy data).
Paper Markets vs. Physical Reality
Futures (”paper”) markets (NYMEX WTI, ICE Brent) are highly liquid and influenced by speculation, hedging, geopolitics, and expectations of future supply/demand. Managed money (speculators) positions fluctuate; COT reports show ongoing adjustments, with periods of elevated gross shorts amid volatility (e.g., tactical shorts on spikes expecting mean reversion or de-escalation). Large individual shorts (hundreds of millions) have appeared, but no clear evidence of massive, coordinated manipulation suppressing crude to benefit refiners. Producers often hedge by shorting futures.
Physical markets tell a different story. Refiners pay spot/physical crude prices plus freight, insurance, and quality differentials. In early 2026, amid Strait of Hormuz and broader Middle East disruptions, physical premiums exploded (e.g., Dated Brent hit ~$144/bbl while futures were lower; Dubai-linked crude spiked dramatically).
Tanker and insurance costs surged due to war-risk premiums. Pre-conflict rates (~0.2–0.25% of vessel value) jumped to 1%+ (sometimes far higher), adding hundreds of thousands to millions per voyage for a typical tanker.
Some insurers canceled or limited coverage in high-risk zones.
Refineries thus face higher effective input costs for delivered barrels while selling into tight product markets. This legitimately widens cracks.
Refinery Margins vs. Consumer Prices
Refineries capture margins when product prices rise faster than crude + operating costs. In 2026, many US and global refiners benefited from exporting to tight markets (Europe, Asia) while domestic demand held firm. High utilization where capacity exists, combined with outages elsewhere, supports elevated 3-2-1 spreads (often $20–50+/bbl in stressed periods, well above historical $10–20 “healthy” averages).
National US gasoline averages have eased from peaks (around $3.83–$4.00/gal range by late June 2026 per AAA/EIA data), but regional disparities persist.
The California Factor
California stands out with persistently high retail prices due to:Unique CARB gasoline specs and strict regulations.
Major refinery closures (Phillips 66 Wilmington; Valero Benicia), cutting in-state capacity ~20% and pushing reliance on imports. Economists projected +$1.21/gal impact by mid/late 2026.
Gas tax hikes (excise tax rising July 1, 2026).
A class-action lawsuit alleging major chains (7-Eleven, Circle K, BP, Marathon, etc.) used AI-powered pricing software to coordinate/keep prices artificially high—potentially the “app to coordinate gasoline movements” dynamic.
Retail-level coordination or algorithmic pricing in a heavily regulated, Democrat-led state with limited local supply flexibility appears more plausible for localized “gouging” than broad refinery manipulation of global crude futures.
Trump’s Accusations and Manipulation Risks
Trump has highlighted the lag between falling crude costs and pump prices (”rockets and feathers”), accusing big oil of gouging and directing DOJ probes (naming majors like Exxon and Chevron in context).
He has also warned retailers directly to lower prices to $2.50/gal or face consequences.
Is coordinated manipulation likely?
Refineries manipulating downward crude via futures shorts? Difficult and less likely. Many integrated majors are hedgers, not pure speculators. High cracks reflect verifiable product shortages from physical outages (Russia, Gulf, etc.), not artificial suppression. Refiners profit from real tightness.
Speculative shorting of paper oil? Common in volatile markets; some large bets exist. However, physical premiums and transport costs show genuine constraints. Futures often lead or lag physical realities.
Retail collusion (esp. CA)? More credible at the local level per ongoing litigation.
Overall, fundamentals dominate: Global refining capacity constraints + geopolitics explain most of the spread. Speculation amplifies moves but does not create the underlying tightness.
Export Ban Implications
Banning US gasoline/diesel exports (as floated in some policy discussions) would likely increase domestic supply and put downward pressure on prices in the short term. However, it could:
- Reduce refinery runs/economics if export markets (often higher-priced) are cut off.
- Disrupt global product flows, exacerbating shortages elsewhere.
- Create inefficiencies without addressing root capacity or regulatory issues.
It risks making problems worse for refiners and long-term supply security, as the user suggests.
I could not find a Dave Chappelle meme on this one, and I saw this, so you have to…..
Crack Spreads in Blue States – sorry…… and no, this is not me. We need politicians who think like plumbers, and honestly, I don’t care if they dress like them. We have a Senator who had a stroke, wears hoodies, and has more reasonable opinions than 95% of the Republican Senators.
And our Senators don’t respect us anymore, just by watching the corruption and games they are pretending to play. So, wearing a suit does not make you a patriot. Voting for your constituents, and not the lobbyist or your bank account, makes you a patriot.
Conclusion
The elevated spread between crude and refinery pricing primarily reflects tight global refined product markets, driven by widespread refinery outages (especially in Russia and the Persian Gulf), strong demand, and high logistics/insurance costs—not widespread refinery gouging.
Paper futures can diverge from physical realities, and speculation plays a role, but verifiable supply disruptions are the core driver.
In California, regulatory burdens, capacity losses, and potential retail pricing practices contribute more directly to high consumer costs.
Key factors for the disparity between paper, physical, and lower prices at the pump.
- State Regulations
- Federal Regulations
- Taxes
- Large Shorts on oil “Paper” market – who is doing this? Someone with lots of money to burn – would it be the U.S. Treasury that could print more money? Just asking for a suspicious friend.
- Democrat run states that encourage cheating at every level – when Blue states are 38% higher on energy, there is a reason, and trends matter.
- Costs to Refiners – Example: Texas costs $5 per barrel to refine, and California costs $15 per barrel.
President Trump’s push for faster pass-through to consumers is understandable, but investigations should distinguish between legitimate margins from scarcity and any anti-competitive behavior. Pointing the finger may help gain new swing voters, but we need solutions to fix our elections first.
Without passing the Save America Act, we will continue down the Communist path. And you thought this article was about Oil prices, and I could not sneak in mentioning the Save America Act and our Uni-Party leaders. Well, I put it in as it is more critical every day. President Trump may have the best Administration ever picked, but he is being hamstrung and stabbed in the back by the Republican Leaders and our RINO justices on the Bench.
And President Trump needs to hand his phone to someone to filter his posts on Truth Social. While sometimes they are effective, I am getting tired of defending some of the dumb ones. I voted for him 3 times and am glad he is our President, and will support his administration, but I am not giving a dime to the Republican Party. I will give to individuals who are running, and I can verify.
The KEY Long-term solutions lie in boosting reliable refining capacity, streamlining regulations, and stabilizing geopolitics—not short-term export bans or probes alone.
Texas has a new refinery coming online in Brownsville that will be ready to solve a huge issue: turning Permian oil into gasoline, diesel, and other petroleum products. Yeah for Texas, but that won’t help the crisis on the East or the horrible problems in California.
Thanks for letting me rant. We still live in the Greatest Country in the world, but we need to take it back and get control of the Political machine.
On Deck for the Energy News Beat Channel.
Looking forward to Doomberg on Monday at 9:00 Central to talk about this and several of his articles.
And Friday, I have Jack Prandelli stopping by Live. He is the Author of The Merchant’s News and we have a huge topic of global oil and gas issues around the world.
Thank you again to all of our great paid Substack Subscribers, Patrons, and Podcast Sponsors. We could not do this without your help, comments and support.
Appendix: Sources and Links
- X Post 1 (Crack spreads):

- X Post 2 (Global Refinery Outage Tracker, July 1, 2026):
- RBN Energy crack spread data: https://rbnenergy.com/market-data/3-2-1-crack-spread
- EIA and various crack spread analyses (2025–2026 reports)
- Reuters, AP, Carnegie Endowment on Russian refinery attacks and outages
- AAA/EIA gasoline price data (June–July 2026)
- Trump Truth Social statements and news coverage on DOJ probe (June 2026)
- Lawsuit coverage on CA retail pricing software (July 2026 reports)
- Maritime insurance/tanker rate analyses (Reuters, Marsh, etc., 2026)
- Physical vs. futures premium reports (Energy Aspects, OilPrice.com, etc.)
Markets are complex; this analysis draws from public data as of July 2, 2026. The fundamentals point to supply constraints rather than conspiracy. There are some collision issues under lawsuit in California, but that is to be expected considering the leadership in California