“Many potential buyers are postponing their purchasing plans in hopes of securing lower rates. Consequently, lower buyer competitions exerted downward pressure on prices”: Realtor.com
By Wolf Richter for WOLF STREET.
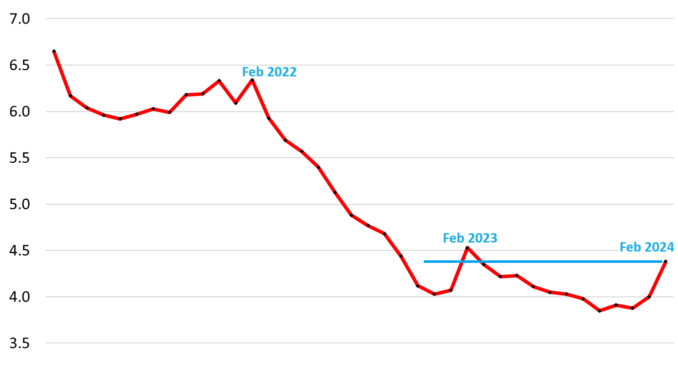
The seasonally adjusted annual rate of sales of existing single-family houses, condos, and co-ops rose 9.5% in February from January, but that increase was smaller than the increase in February 2023 (+11.5%), and so the annual rate of sales at 4.38 million homes, was still down 3.3% from the already collapsed levels of February 2023, according to data from the National Association of Realtors (NAR) today
And the rate of sales was down 26% from February 2022, and down 29% from February 2021, and down 19% from February 2019.
In other words, home sales remain at very low levels as the entire housing market has shrunk by 20% to 25% because homeowners with 3% mortgages are neither buying nor selling, so they have vanished as demand, and they have vanished in equal number as supply, and so churn is down, along with sales and supply, and Realtors hate it because they make their commissions off churn (historic data via YCharts):
The long-term view shows that the rate of sales in January and in the last few months of 2023 had been the lowest since the worst months of the Housing Bust in 2010. February was an increase off low and was still low and below a year ago (historic data via YCharts):
Active listings highest since before the pandemic. In February, active listings, at 665,000, were up by 14.7% from February 2023, up by 92% from February 2022, and up by 43% from February 2021, according to data from Realtor.com.
This came as new listings jumped by 11% year-over-year.
As homeowners with 3% mortgages have vanished both as demand and as supply, we have this situation where sales in February 2024 were down by 19% from February 2019, and active listings were down by 28% over the same span (data via Realtor.com):
Listing prices are weakening. The year-over-year change of the weekly median listing price, released by Realtor.com, is an indication where the median sold price might end up. The year-over-year change went through a brief mini-surge in the second half of 2023 through January 13, which was then reflected in the year-over-year increases in the median sold price that we have seen in recent months.
But starting in mid-January, the year-over-year increases of the listing price shrank and then started hobbling along the 0% line, and in the most recent week, the listing price was below a year ago (-0.6%), as sellers face more competition from other sellers and fewer buyers. This year-over-year weakness in the listing price is an indicator that the median sold price through the spring selling season will also see year-over-year weakness.
In its note sent out two days ago, Realtor.com explained:
“It marks the first week of year-over-year price declines since July 2023, attributed to mortgage rates hovering around 7% and an ongoing increase in available for-sale homes, notably an upsurge in affordable listings spotlighted in the February Realtor.com Housing Trends Report. With mortgage rates nearly returning to 7% in February, many potential buyers are postponing their purchasing plans in hopes of securing lower rates. Consequently, lower buyer competitions exerted downward pressure on prices.”
The national median sold price in February at $384,500 was up 5.7% year-over-year, but was down by 7.1% from the all-time high in June 2022.
The year-over-year increase in the median sold price of homes whose sales closed in February reflects the brief mini-surge in the median listing price in late 2023 and through mid-January.
The listing price’s weakness year-over-year since late January and the negative reading in early March should begin showing up in the median sold price over the spring.
The year 2023 was the first year since the Housing Bust when the seasonal high in June was lower than the seasonal high and all-time high a year earlier (historic data via YCharts):
Price reductions as % of active listings jumped to 30% in February, up substantially from prepandemic Februarys of 2017 through 2020, when that rate ranged from 22% to 25% (data via Realtor.com):
Supply of 2.9 months was the highest for any February since February 2020 (3.1 months). December through February tend to be near the seasonal low points in supply (historic data via YCharts).
