

A recent post by Peter Clack (@PeterDClack) on X captured a growing reality that policymakers and industry advocates have long downplayed: the coming wave of wind turbine and solar panel retirements will expose a physical and financial nightmare of continuous renewal.
The fleet average in wind is 19 years, and they are rapidly approaching the end of their life, with no money budgeted for replacement or land reclamation. You have heard me talk about much of this on the podcast in the past, but it is now only 2 to 4 years away from a crisis.
Cumulative waste is projected to reach 78 million tonnes for solar panels and up to 200 million tonnes for wind turbines by mid-century. Because wind and solar have low capacity factors and finite lifespans (commonly cited as 15–25 years), delivering firm power requires significant overbuilding, backed by battery storage, transmission, and costly backup.
Replacing the fleet on a continuous cycle creates an endless demand for raw materials—steel, copper, aluminum, silicon, silver, rare earths, and composite blade materials—while closed-loop recycling remains largely aspirational.
Blade composites are notoriously difficult to recycle, with large volumes historically sent to landfills.
Decommissioning and recycling infrastructure lag far behind deployment, leaving significant unfunded liabilities.
This is not abstract futurism. It is the arithmetic of the existing U.S. installed fleet.
The Scale of the Existing Fleet
Texas alone accounts for a large share. Solar capacity has grown even faster: utility-scale and small-scale photovoltaic capacity reached about 175 GW AC by the end of 2024 and continued climbing past 209 GW AC into 2025–early 2026, with total solar (including DC nameplate figures reported by industry) substantially higher. The bulk of both fleets was installed in the last 10–15 years.
Battery storage, often presented as the solution to intermittency, has also expanded rapidly—tens of gigawatts of large-scale systems, concentrated in California, Texas, and Arizona—but the fleet is young. Most capacity is only a few years old; batteries themselves face degradation and eventual replacement cycles measured in 10–20 years depending on chemistry and use.
Age, Performance Decline, and Life Expectancy Reality
Average age at full decommissioning of turbines removed so far has been around 30–31 years, but most of those were small, older machines (<200 kW). Megawatt-class turbines that have been removed so far tended to come out earlier than expected (under 23 years in available data).
Roughly 7,500 existing turbines are already 20+ years old, with tens of thousands more in the 15–19-year range. Capacity factors decline with age—older plants show measurable performance drops, sometimes accelerating after production tax credit eligibility ends.
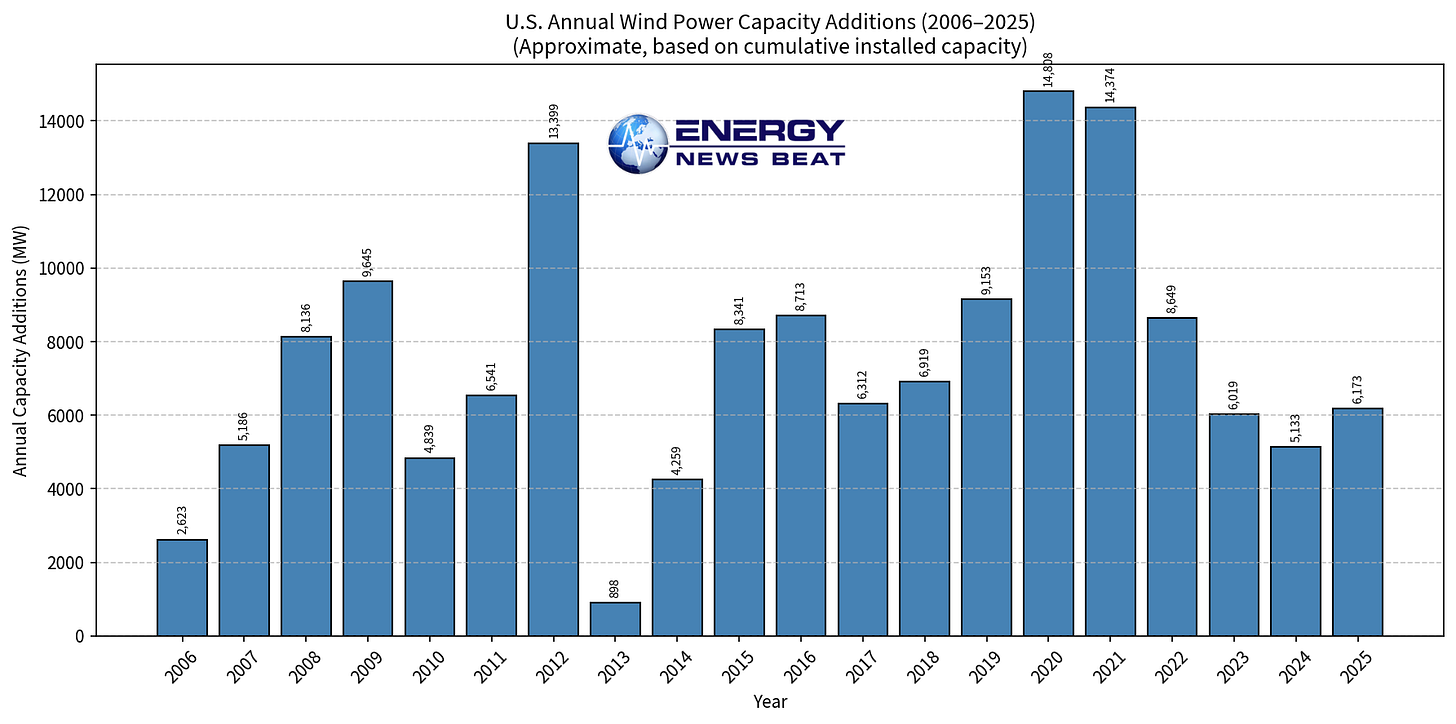
We have seen that much of the maintenance that was done was under “Name Plate Upgrades,” and those subsidies are running out. This will bring up a HUGE problem in the short term. Maintenance and profitability are hitting hard, and watch for more rate increases to consumers.
We have also reported that the maintenance issues started at 3 years, and rate increases to consumers are rolled out by year 8. With the “Bum Rush” for subsidies over, we will witness some huge changes in the energy markets in the next few years.
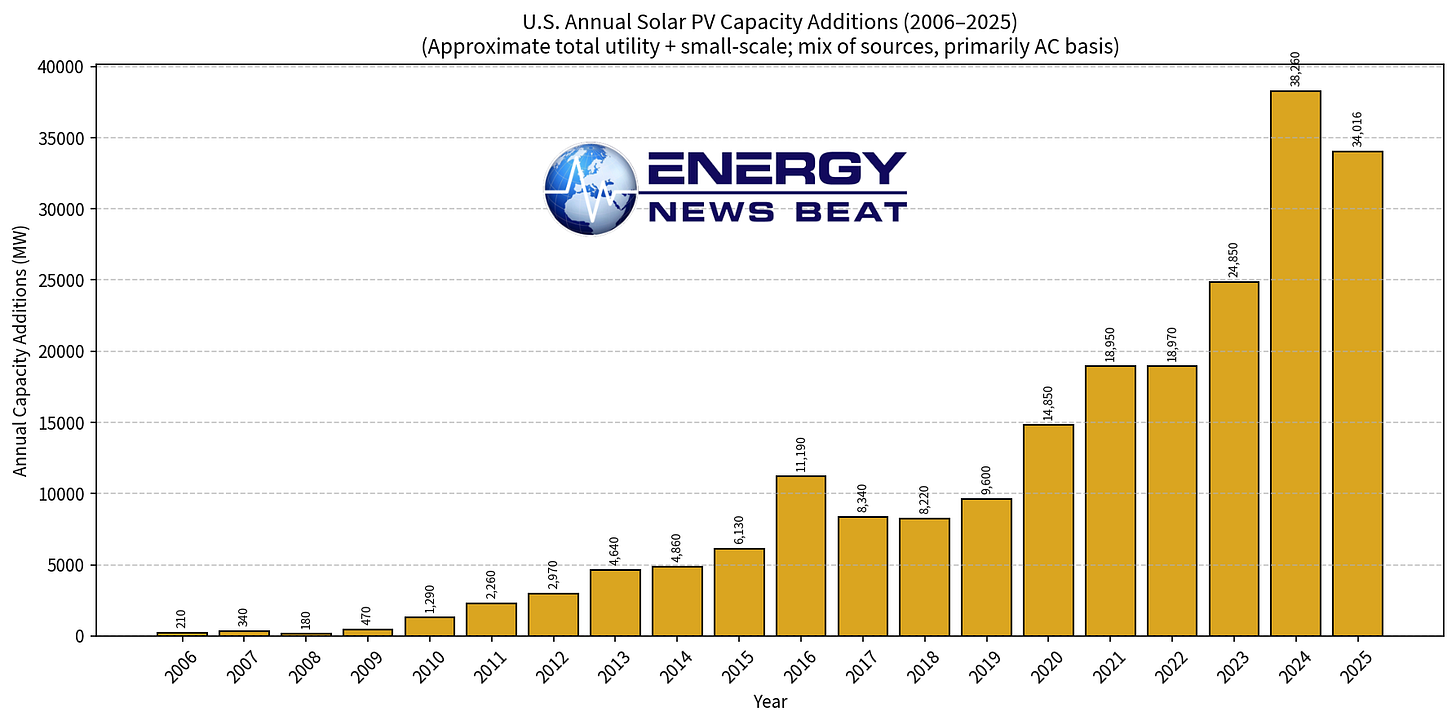
Solar panels claim to carry 25–30-year performance warranties and degrade at a median rate around 0.5% per year (NREL analyses). But we are challenging these numbers. In Texas, hail storms wipe out a huge chunk, let alone the claimed 5% annual degradation.
After 25 years, they claim to retain ~88% of original output. Most of the U.S. solar fleet is far younger; the majority of capacity has been installed since ~2019. Inverters and other balance-of-system components often fail sooner (10–15 years). Early repowering or replacement for higher-efficiency modules is already discussed for older utility-scale sites.
In short, the “design life” is not consistently realized as continuous high performance to the final year. Performance fades; components fail; economic decisions (tax credits, power purchase agreements, land leases) drive earlier action. The result is a rolling replacement schedule rather than a one-time build.
The Financial Treadmill
Recycling Reality: Mostly Landfill Today
Sweetwater, Texas, is disgusting and should be a warning sign. The EU is having real problems finding places for its wind turbine blades. Countries are rightfully banning landfills for the toxic blades.
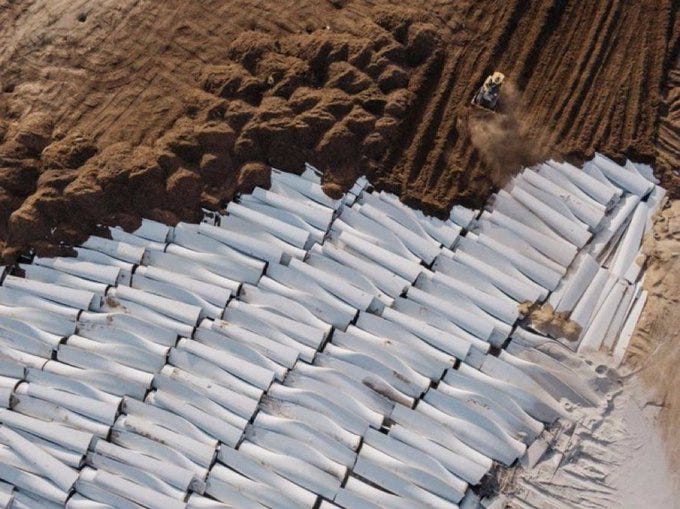
Recycling costs can run $1,000–$2,000 per ton versus landfill fees of $60–$150 per ton. By 2050, U.S. blade waste alone has been estimated in the low millions of tons under 20-year life assumptions; broader turbine material volumes are far higher.
Solar panels are more recyclable in theory (glass, aluminum frames, copper, silver, silicon). In practice, U.S. recycling rates have been low—around 10% in some assessments—while Europe’s producer-responsibility rules drive higher recovery. Recycling a utility-scale module can cost $15–$45 versus $1–$5 for landfill. Without strong policy, economics favor disposal. Projections show U.S. panel waste reaching up to 1 million tons by 2030 and 10 million tons by 2050 under various scenarios; global figures are far larger.
Infrastructure for high-volume, high-value recovery of both blades and panels lags the deployment rate. Closed-loop circularity at multi-terawatt scale remains aspirational.
Per-turbine net costs (after salvage) commonly fall in the $100,000–$200,000 range in project-specific estimates, with gross costs higher; some site plans show net figures near $194,000 per turbine.
Scaling across the full existing wind fleet (tens of thousands of modern turbines) plus foundations, roads, and collection systems produces liabilities in the tens of billions.
Higher figures in the $80–90 billion range for wind-related reclamation have appeared in industry commentary and related reporting.
Many states receive poor grades for requiring adequate bonding or financial assurance; oil-and-gas well plugging rules are generally far stricter. Taxpayers and landowners risk becoming residual payers if owners walk away or go bankrupt.
Retirement funding is therefore uneven and often inadequate. Bonds or escrow, where required, may not fully cover future costs once inflation, labor, and disposal rules tighten. The wave of retirements expected to accelerate in the 2030s will test these arrangements.
Grid Resiliency Implications
The physical and economic realities Clack highlighted are already visible in early decommissioning data, landfill blade piles, thin recycling rates, and incomplete financial assurances. As the 2030s approach, the volume of material and the capital required to keep the treadmill turning will only grow. Ignoring the end-of-life phase does not make the waste or the liability disappear—it simply shifts the bill and the environmental burden onto future ratepayers, taxpayers, and the landscape.
Nobody is even talking about the huge hole that the lack of subsidies will do to the grid in the next four years. The financial treadmill that wind and solar require is coming to a complete halt as we are seeing subsidies dry up globally.
And I did not even get into the battery storage issues, as the numbers are not easy to get, and they also degrade every time they are charged or discharged. Recycling is also non-existent and is horrible for the environment. That cost will need to be paid by someone, and it will most likely be the taxpayers.
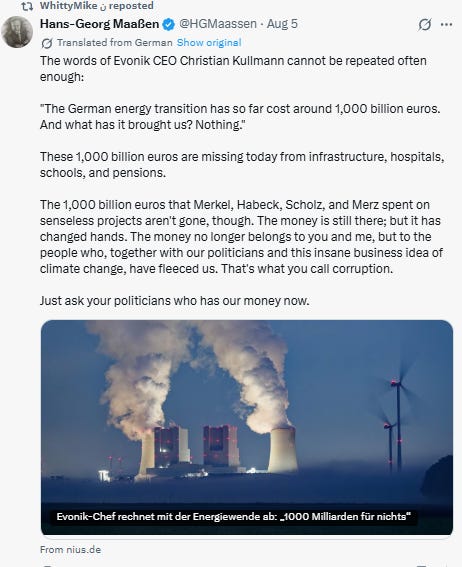
The words of Evonik CEO Christian Kullmann cannot be repeated often enough:
“The German energy transition has so far cost around 1,000 billion euros. And what has it brought us? Nothing.”
These 1,000 billion euros are missing today from infrastructure, hospitals, schools, and pensions.
The 1,000 billion euros that Merkel, Habeck, Scholz, and Merz spent on senseless projects aren’t gone, though. The money is still there; but it has changed hands. The money no longer belongs to you and me, but to the people who, together with our politicians and this insane business idea of climate change, have fleeced us. That’s what you call corruption.
Just ask your politicians who has our money now.
Prepare for higher grid and energy prices and more blackouts in the next few years.
What I am seeing is that people who prepare for disasters can walk through the disaster with a minimal negative impact. Wind, solar, and storage are actually good for the edge, home grid hardening tools. But how these three energy products have been incorporated in the global grids has created an energy monster that needs constant financial feeding.
We have some great things coming around the corner, and the world is healing. Be prepared for any emergency for your family, neighbors, and community.
Thanks again to all of our great subscribers, patrons, and sponsors.

Appendix: Sources and Links
- Peter Clack X post (6 Aug 2026):
- U.S. Wind Turbine Database (USGS/LBNL/ACP): https://energy.usgs.gov/uswtdb/
- Cumulative U.S. wind capacity trends (Statista, YCharts, LBNL Land-Based Wind Market Report): various 2024–2025 editions; ~154–159 GW range.
- Empirical decommissioning study: Rand et al., “Out with the Old: Empirical Trends in U.S. Land-Based Wind Turbine Decommissioning and Repowering,” Wind Energy / USGS (2026).
- LBNL / NREL performance-decline and useful-life analyses.
- EIA Electric Power Monthly and related capacity tables (solar PV utility + small-scale through 2025–2026).
- SEIA / industry solar capacity reports (cumulative and annual additions).
- NREL solar degradation and lifetime project data (median ~0.5%/yr).
- National Center for Energy Analytics / related analyses on state financial assurances and ~$50B+ decommissioning liability estimates (2025).
- Forbes, NREL, and academic papers on blade waste volumes, landfill practices, and recycling costs.
- IRENA, IEA PVPS, EPA, and industry reports on solar panel waste projections and U.S. recycling rates (~10% cited in multiple assessments).
- Energy News Beat prior reporting referencing higher wind reclamation liability figures in the $80–90B range.
- Battery storage capacity data (Statista, ACP/Wood Mackenzie U.S. Energy Storage Monitor, EIA).
All capacity, age, cost, and waste figures are drawn from the cited public data sets and reports current as of mid-2026; exact numbers continue to be updated by EIA, LBNL, USGS, and industry trackers.
