


The 2026 Iran conflict, which escalated in late February with U.S.-Israeli strikes and Iranian retaliation—including the effective closure of the Strait of Hormuz and attacks on energy infrastructure—has triggered the largest supply disruption in global oil market history. Nearly 20% of the world’s oil and significant LNG volumes have been taken offline, sending Brent crude prices surging past $100–$120 per barrel at peaks and doubling European natural gas prices in places. QatarEnergy declared force majeure on LNG exports, with up to 17% of its capacity potentially offline for years.
This crisis is not just a short-term shock. It is accelerating a structural shift in capital allocation across the energy sector. Investors and governments are pivoting from net-zero timelines toward energy security, reliability, and diversification. Capital is flowing back into traditional hydrocarbons, infrastructure bypasses, and even coal restarts—prioritizing resilience over rapid decarbonization. The result: renewed investment in oil, natural gas, LNG, pipelines, and coal, even as renewables continue growing where economically viable.
Structural Changes in Oil Markets
The Strait of Hormuz disruption has exposed the fragility of chokepoint-dependent supply. Analysts now forecast a global oil market deficit in 2026 (steepest in Q2, potentially flipping to surplus by Q4), erasing prior oversupply expectations and permanently removing up to 2 million bpd of capacity in some scenarios.
Capital allocation is shifting toward:Non-Middle East production ramps (U.S. shale, Americas, Africa).
Infrastructure for resilience (storage, tankers).
Diversified upstream projects with geopolitical risk premiums now priced in.
Gulf producers are accelerating bypass infrastructure to reduce future vulnerability (detailed below). Oil majors and private equity are redirecting billions into secure, high-margin assets, with reports of a $12 billion shift into oil and gas working interests in early 2026 alone.
Structural Changes in Natural Gas and LNG Markets
LNG markets have been hit especially hard. Qatar’s Ras Laffan facilities were damaged, stranding exports and spiking Asian and European prices. U.S. and other non-disrupted LNG exporters are seeing arbitrage opportunities, but the crisis underscores over-reliance on a handful of suppliers.
Key shifts:
Accelerated U.S. and Australian LNG export capacity expansions.
European and Asian buyers are diversifying sources and building more regasification/terminal infrastructure.
Long-term contracts favor secure producers over spot market exposure.
The Americas are relatively insulated (wide WTI-Brent and Henry Hub-TTF spreads), positioning U.S. LNG as a winner for energy security-focused buyers.
Pipelines to Bypass Future Choke Points
Gulf states are racing to make the Strait of Hormuz “irrelevant” through new and expanded pipelines. Saudi Arabia is ramping the East-West Crude Oil Pipeline (Petroline) to Yanbu on the Red Sea. The UAE is expanding the Abu Dhabi Crude Oil Pipeline to Fujairah. Proposals include Oman’s Duqm port link, reactivation of the Iraq Pipeline through Saudi Arabia (IPSA), and broader regional networks (including revived interest in India-Middle East-Europe Corridor elements).
These projects represent a multi-billion-dollar capital reallocation toward onshore, diversified export routes—permanently altering trade flows and reducing tanker/chokepoint risk.
Coal Restart and Demand Growth Expectations
Natural gas shortages have triggered widespread gas-to-coal switching, particularly in Europe and parts of Asia. The U.S. electric power sector is seeing coal consumption rise 7% in 2025 (drawing down stocks ahead of some 2026 retirements). Globally, the IEA had projected a plateau in coal demand (8.8 billion tonnes in 2025, slight decline in 2026 pre-crisis), but the energy security imperative is boosting near-term use for baseload power.
Coal Demand Growth Expectations by Country/Region (IEA and related forecasts; crisis accelerating near-term use in security-focused nations):
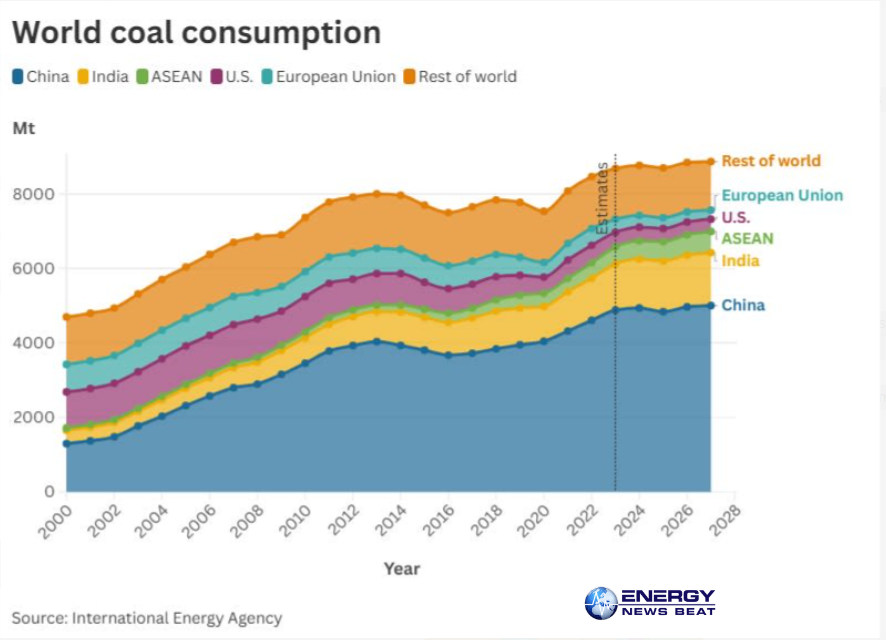
World coal consumption by region (IEA data): China and India dominate, with steady or growing demand in Asia-Pacific offsetting declines elsewhere. Crisis-driven switching is temporarily lifting U.S. and select European use.
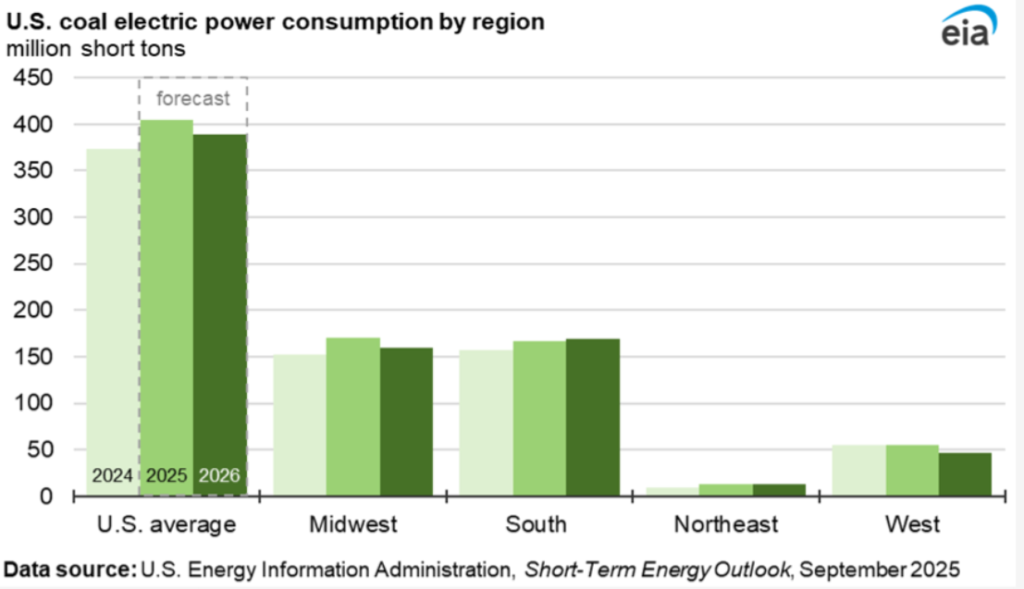
U.S. coal electric power consumption by region (EIA): National average up sharply in 2025, with regional variations.
Coal production forecasts 2022–2030 by major countries (illustrative of sustained demand in China, India, Russia, Indonesia; U.S. and Australia more stable/declining).
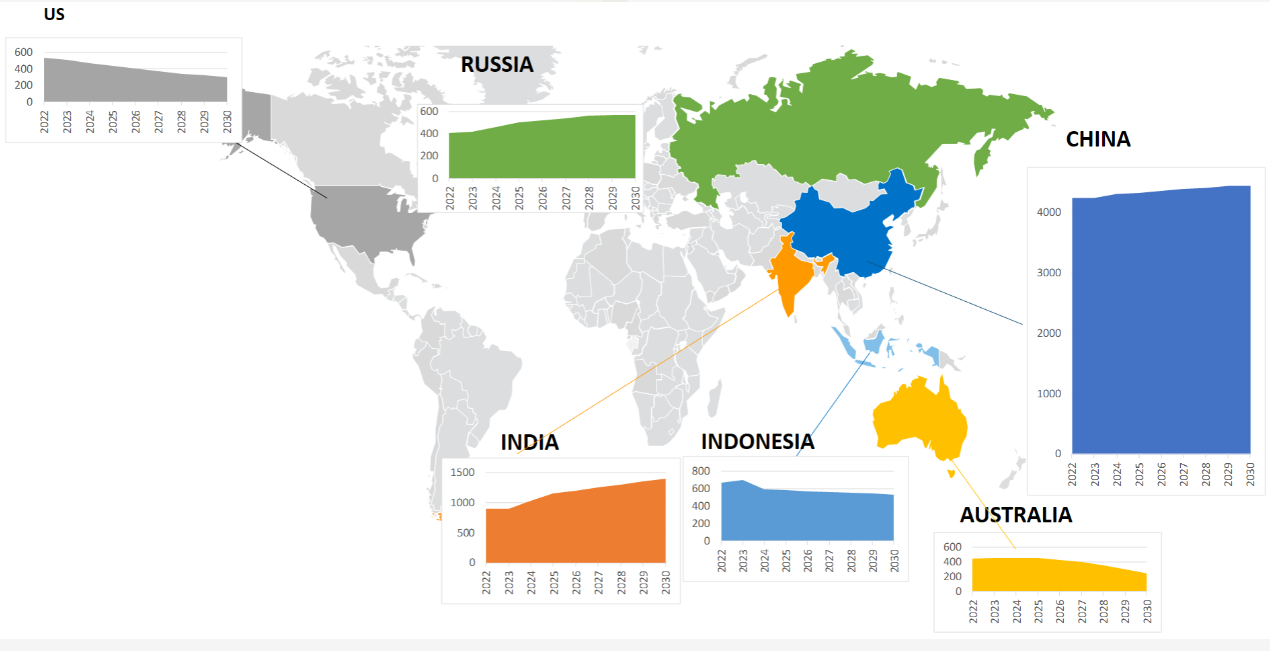
India and Southeast Asia continue to see structural growth in power; China remains the largest consumer, with flexible use; the U.S. and select regions see short-term restarts for security.
Energy Security Over Net Zero: Policy Realignment
The crisis has forced governments worldwide to prioritize an affordable, reliable supply. Emergency coal use, delayed retirements, and relaxed green mandates are evident. Net-zero timelines are being de-emphasized in favor of diversified, domestic, or secure imports. This is a structural policy pivot: execution and resilience now trump ambitious long-term targets in many capitals.
Impacts on Monetary Systems, Consumers, and Investors
Monetary Systems: Energy-driven inflation is reaccelerating headline CPI. Central banks (Fed, ECB) face stagflation risks—higher oil/gas prices feed into broader costs, complicating rate paths. Currency volatility is rising in import-dependent economies; the dollar strengthens as a safe haven. Prolonged disruption could echo 1970s-style pressures.
Consumers: Higher gasoline, heating, and electricity bills are squeezing household budgets. U.S. pump prices have jumped (national average ~$3.88/gallon post-spike, higher in California); European gas costs have doubled. Governments are deploying subsidies, stockpiles, and demand-side measures, but pain is real—especially for lower-income households.
Investors: Capital is reallocating to traditional energy (upstream, midstream, coal assets) for cash flow and dividends. Energy stocks have outperformed amid volatility. Private equity and institutions are increasing exposure to secure hydrocarbons and infrastructure. Renewables remain attractive for diversification, but pure-play net-zero bets face headwinds where security trumps. Overall: higher returns in fossil infrastructure with embedded geopolitical premiums.
Conclusion
The Iran conflict is catalyzing the biggest rethink in energy capital allocation in years. Pipelines are rerouting flows, coal is providing emergency baseload, and governments are choosing security over speed-to-net-zero. While the transition to lower-carbon sources continues where practical, the near-term reality is clear: reliable, diversified supply wins. Investors and policymakers who adapt to this structural shift will be best positioned in the post-crisis energy landscape.
- Reuters: Iran war shock to flip market to deficit in 2026 (April 10, 2026) – https://www.reuters.com/business/energy/oil-whiplash-iran-war-shock-flip-market-deficit-2026-analysts-say-2026-04-10/
- Wikipedia: Economic impact of the 2026 Iran war – https://en.wikipedia.org/wiki/Economic_impact_of_the_2026_Iran_war
- Atlantic Council: How the Iran war could shift energy policies (April 3, 2026) – https://www.atlanticcouncil.org/blogs/energysource/how-the-iran-war-could-shift-energy-policies-around-the-world/
- FPRI: Experts React – Effects of the Iran War on Energy Markets (March 23, 2026) – https://www.fpri.org/article/2026/03/experts-react-effects-of-the-iran-war-on-energy-markets/
- IEA: Coal 2025 report and charts (various 2025–2026 data) – https://www.iea.org/reports/coal-2025 and https://www.iea.org/data-and-statistics/charts/global-coal-consumption-2023-2026
- EIA: Short-Term Energy Outlook (coal consumption) – https://www.eia.gov/outlooks/steo/
- Additional pipeline coverage: Jerusalem Post, Washington Post, Arab News, Economic Times (April 2026)
- Inflation/monetary impacts: Dallas Fed paper, Forbes, Wikipedia economic impact page
- Capital shift examples: Kingdom Exploration, IPA Global, various industry reports (March–April 2026)
All data and charts reflect latest available IEA/EIA and market reporting as of April 2026. Forecasts subject to conflict duration and policy responses.