

A record armada of crude oil tankers is steaming toward the U.S. Gulf Coast in April 2026. Maritime intelligence from Windward shows roughly 171 crude tankers en route—well above the typical monthly average of about 110. Market data firm Kpler reports that 28 Very Large Crude Carriers (VLCCs), each capable of hauling up to 2 million barrels, have already been fixed for May loadings alone, compared with a normal monthly average of just five.
This surge is driven by global supply disruptions, particularly rerouting around the Strait of Hormuz amid recent geopolitical tensions. Asian and European buyers are turning to stable U.S. supplies. U.S. Gulf Coast crude loadings are tracking near 4.9 million barrels per day (mbpd) in April and are projected to exceed 5 mbpd in May—the highest sustained levels on record.
But what exactly are these tankers loading, who is buying it, and does this export boom threaten domestic U.S. fuel supplies? Here’s a clear breakdown based on the last five years of data, current trends, and tanker specifics.
Last Five Years of Tanker Traffic and Export Volumes (2020–2024)Tanker “traffic” is best measured through export volumes from Petroleum Administration for Defense District 3 (PADD 3), the Gulf Coast region that serves as America’s primary crude and product export hub. Nearly all U.S. crude exports and the majority of refined products move through Gulf ports (Houston, Beaumont, Corpus Christi, etc.).
U.S. Gulf Coast (PADD 3) Petroleum Exports (annual average, mbpd):2020: Total 7.17 mbpd (Crude: 2.97 | Products: 4.20)
2021: Total 7.33 mbpd (Crude: 2.83 | Products: 4.50)
2022: Total 8.36 mbpd (Crude: 3.46 | Products: 4.90)
2023: Total 9.03 mbpd (Crude: 3.97 | Products: 5.06)
2024: Total 9.43 mbpd (Crude: 3.96 | Products: 5.46)
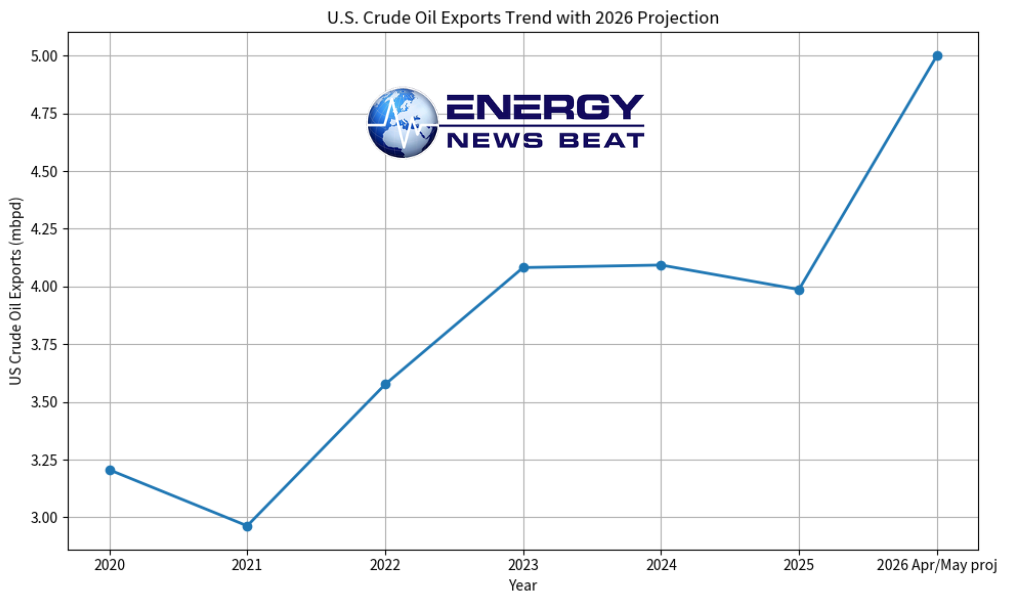
National U.S. crude oil exports followed a similar upward trajectory before a slight dip in 2025 (to ~3.99 mbpd annually), setting the stage for the current 2026 breakout.
Product exports (gasoline, diesel/distillate, jet fuel, and hydrocarbon gas liquids) have grown steadily, often outpacing crude in volume during this period. The chart above (first image) illustrates the steady climb in both crude and products from Gulf Coast terminals.
Current Tanker Traffic (April–May 2026): Tanker density in the Gulf of Mexico is visibly elevated on live-tracking platforms like MarineTraffic. The inbound fleet is overwhelmingly crude oil tankers—not product carriers. Availability of VLCCs (the largest crude carriers), Suezmax, and Aframax vessels has tightened dramatically along the U.S. Gulf Coast, with net vessel availability down sharply in recent weeks.
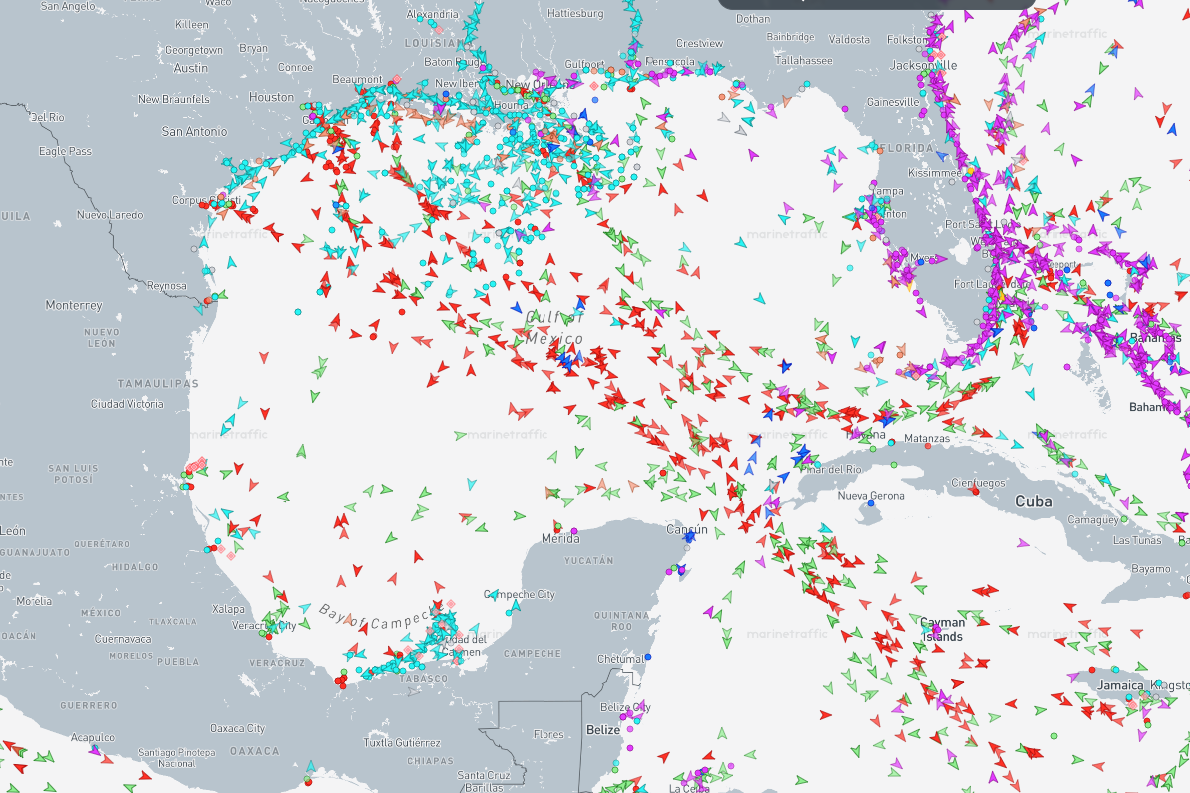
This is not a broad tanker fleet loading mixed cargoes. It is a targeted wave of crude exports. Smaller product tankers (MR, LR1/LR2) continue their normal operations for refined fuels, but the headline surge is in large crude carriers.
What Are They Buying? Crude Oil Dominates the Current Surge
Crude oil → The primary cargo for the inbound armada. U.S. Gulf producers export light, sweet grades prized by refiners worldwide.
Refined products → Diesel (distillate fuel oil), gasoline, and jet fuel make up a large share of Gulf exports historically (~5+ mbpd in 2024), but they are not driving the current tanker queue. In 2025, U.S. exports of major transportation fuels (distillate, gasoline, jet) averaged about 2.4 mbpd, with gasoline up slightly to ~902,000 bpd and jet fuel steady at ~219,000 bpd.
The second chart shows the long-term U.S. crude export trend, with the 2026 projection highlighting the breakout.
Will This Impact the Domestic U.S. Supply?
Short answer: No meaningful negative impact—and likely a net positive for the U.S. energy sector.
U.S. crude production remains robust at over 13 mbpd.
The country has been a net exporter of total petroleum since 2020. Exports represent surplus volumes after domestic refining needs are met.
Gulf Coast refineries are optimized for heavy imported crude but export surplus light domestic crude and refined products. This arbitrage keeps the system efficient.
Domestic gasoline, diesel, and jet fuel prices are more influenced by global refining margins, seasonal demand, and refinery maintenance than by export volumes. Record exports support jobs, tax revenue, and infrastructure investment without causing shortages.
California is the weak link in the system because it is a net importer. If California had increased oil production and not shut down refineries, the economy would be different right now. As it stands now, California is weeks away from a crisis.
To Whom Are Shipments Being Sent?
Crude oil destinations (top recent buyers, by volume/share):
Netherlands (major European hub for further distribution)
South Korea
Canada
India
China / Chinese Taipei
Japan, the United Kingdom, and others
Europe and Asia dominate crude liftings.
Refined products destinations (especially gasoline and diesel):
Mexico (by far the largest buyer—often >50% of U.S. gasoline exports)
Other Latin America (Colombia, Guatemala, Brazil, Ecuador, Chile)
Select Caribbean and European markets
Latin America is the primary market for U.S. motor gasoline and distillate, reflecting regional refining limitations.
Bottom Line
The tanker fleet “knocking” at the Gulf of America is buying American crude oil—primarily light sweet grades—for Asian and European refiners hungry for a reliable supply amid global disruptions. Refined products like diesel, gasoline, and jet fuel continue to flow steadily (especially to Mexico and Latin America), but the current surge is a crude story. U.S. producers and the broader energy economy benefit from these record loadings, with no evidence of domestic supply strain.
America’s emergence as the world’s top energy exporter is on full display in the Gulf right now.
Appendix: Sources and LinksU.S. Energy Information Administration (EIA) – Primary data source for export volumes, PADD 3 statistics, and historical tables:
https://www.eia.gov/dnav/pet/hist/LeafHandler.ashx?n=PET&s=MCREXUS2&f=A (Crude exports)
https://www.eia.gov/dnav/pet/pet_move_exp_dc_nus-z00_mbblpd_m.htm (Total exports)
https://www.eia.gov/energyexplained/oil-and-petroleum-products/imports-and-exports.php (Overview)
Kpler and Windward – Tanker tracking and fixture data (cited in multiple April 2026 news reports).
Reuters / WSJ / New Orleans CityBusiness – Current tanker surge reporting (April 2026 articles).
Additional context: EIA PADD 3 export data and country-level destination tables (e.g., https://www.eia.gov/dnav/pet/pet_move_expc_a_ep00_eex_mbbl_m.htm).
Data as of April 2026. Charts generated from EIA-reported figures for illustrative purposes.