
The global energy markets are in flux as of mid-April 2026, shaped by severe disruptions from the ongoing Middle East conflict (centered on Iran and the Strait of Hormuz). This has curtailed roughly 7–10 mb/d of crude, NGLs, and refined product exports in March–April, triggering sharp price spikes and inventory draws. Brent crude averaged $103/bbl in March and hit intraday highs near $115/bbl in Q2 before partial easing on truce signals and alternative routing. Yet longer-term fundamentals point to a more balanced-to-surplus picture once flows normalize.
Oil has dropped to $84.41 today, and people are wondering what is going on. The paper is not keeping up with delivery, and there is still a huge gap. In some places, the delivery or what refineries pay is at a $50 over. The other question is: why are ExxonMobil and Chevron now going lower in stock price when their profits are rising?
Demand is holding up better than feared in non-OECD regions (led by China, India, and emerging Asia), but high prices and war-related curtailments are curbing OECD and Middle East consumption. On the supply side, non-OPEC+ growth (U.S., Brazil, Canada) continues, while OPEC+ production has plummeted due to force majeure and infrastructure damage. LNG markets face a different dynamic: a massive new supply wave from North America, Qatar, and elsewhere is building, pressuring spot prices downward even as short-term volatility persists from regional disruptions.
Below, we break down the demand-vs-physical-delivery balances for crude, LNG, and key refined products (gasoline, diesel, jet fuel), compare forecasts from OPEC, the IEA, EIA, and financial analysts, outline consumer impacts, and offer investor perspectives on key companies.
Crude Oil: Tight Near-Term Balances Give Way to Surplus Risks
Demand vs. Physical Delivery:
Global oil demand is under pressure from the conflict. The IEA now forecasts a contraction of ~80 kb/d y-o-y in 2026 (down sharply from prior growth estimates), with the steepest drops in 2Q26 driven by naphtha, LPG, and jet fuel losses in Asia and the Middle East. OPEC maintains a more optimistic +1.4 mb/d growth outlook, citing resilient non-OECD expansion (China + India ~1.0–1.3 mb/d combined). The EIA sits in between, projecting modest net growth but with near-term destruction from higher prices.
Physical delivery has been hammered: Strait of Hormuz loadings fell to ~3.8 mb/d in early April (vs. >20 mb/d pre-crisis), forcing rerouting via pipelines and west-coast terminals. Global observed stocks drew 85 mb in March alone. U.S. production remains robust at ~13.5 mb/d in 2026, with inventories for distillates running ~6% below the five-year average.
Forecasts: OPEC (April MOMR): World demand +1.4 mb/d in 2026; call on DoC crude ~42.9 mb/d.
IEA (April OMR): Demand contraction of 80 kb/d; refining runs down 1 mb/d to 82.9 mb/d.
EIA (April STEO): Brent averages $96/bbl in 2026 (peak $115/bbl in 2Q26, then < $90/bbl in 4Q26 assuming mid-year normalization); $76/bbl in 2027.
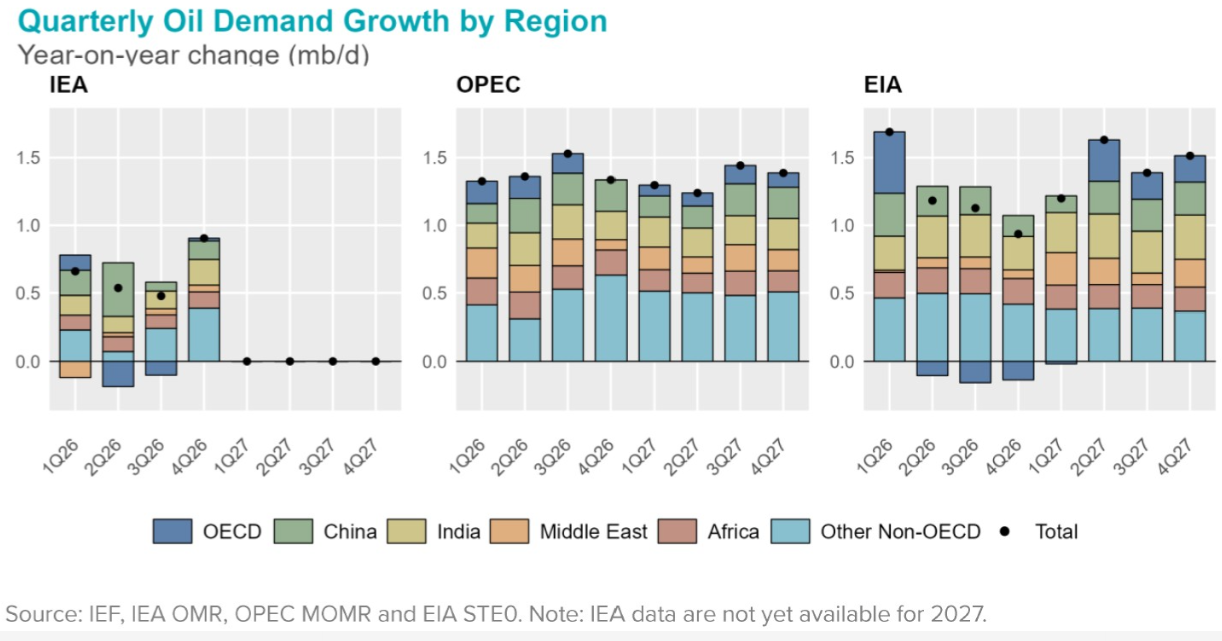
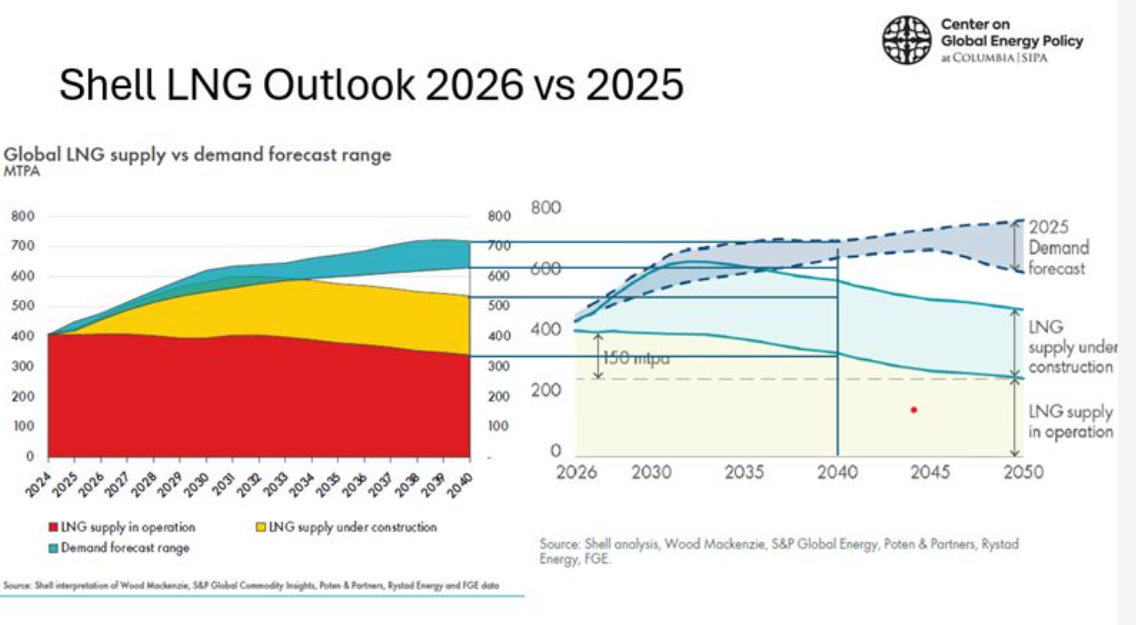
Quarterly oil demand growth (left) and 2025–2027 balance summary (right) from IEA, OPEC, and EIA comparisons highlight divergent but generally modest growth outlooks amid conflict uncertainty.
LNG: Supply Wave Sets Stage for Buyer’s Market
Demand vs. Physical Delivery:
Global LNG trade is rebalancing faster than expected. IEA projects LNG supply growth exceeding 7% in 2026 (fastest since 2019), led by North American additions. Demand growth accelerates to 2%, driven by China and emerging Asia, but new regas capacity and price-sensitive buying will be needed to absorb the wave. U.S. exports remain near record levels (18 Bcf/d), though some projects face timeline slips.
JKM spot prices have been volatile (recently ~$16/MMBtu) due to Gulf disruptions, but the structural surplus points to softening. Wood Mackenzie and others forecast a 5%+ demand rebound in Asia, yet overall supply outpaces this, creating ~50–100+ MTPA of potential overhang by late decade.
Forecasts:
IEA, WoodMac, and Shell outlooks converge on a multi-year LNG glut starting in earnest in 2026, with prices trending toward $5–9/MMBtu (Henry Hub-linked contracts provide downside protection).
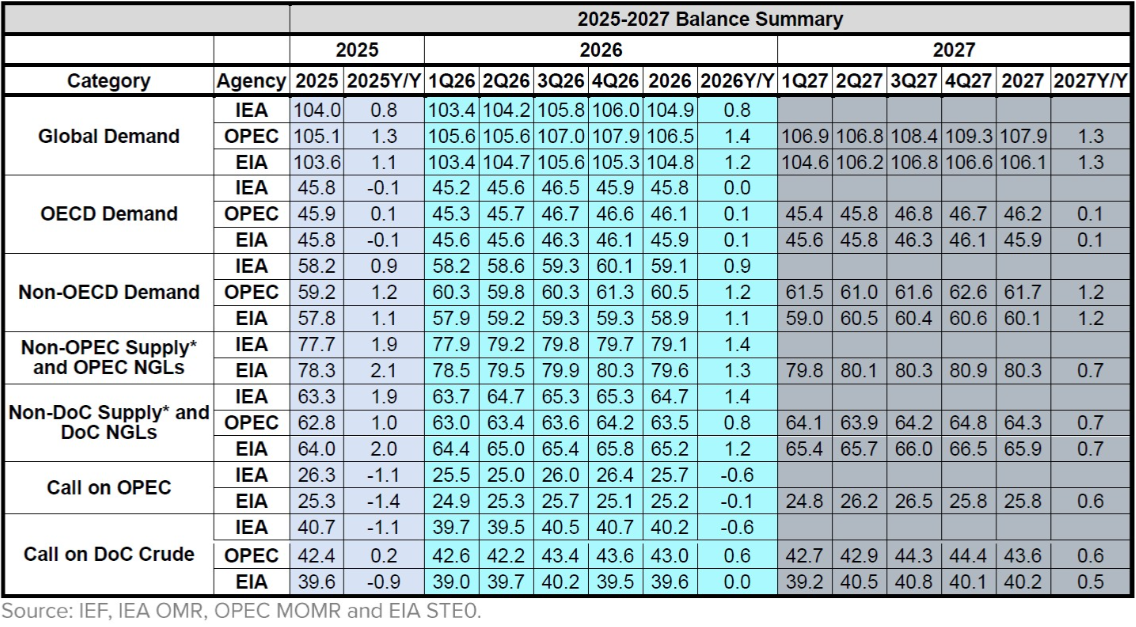
Shell LNG supply vs. demand outlook illustrates the impending surplus from new capacity coming online 2026–2030.
Refined Products: Diesel and Jet Fuel Tightest
Gasoline demand remains steady but faces efficiency headwinds. Diesel and jet fuel are more vulnerable: Gulf refining curtailments (~3–4 mb/d at risk) have tightened middle distillates globally. U.S. distillate stocks are below average, supporting strong crack spreads.
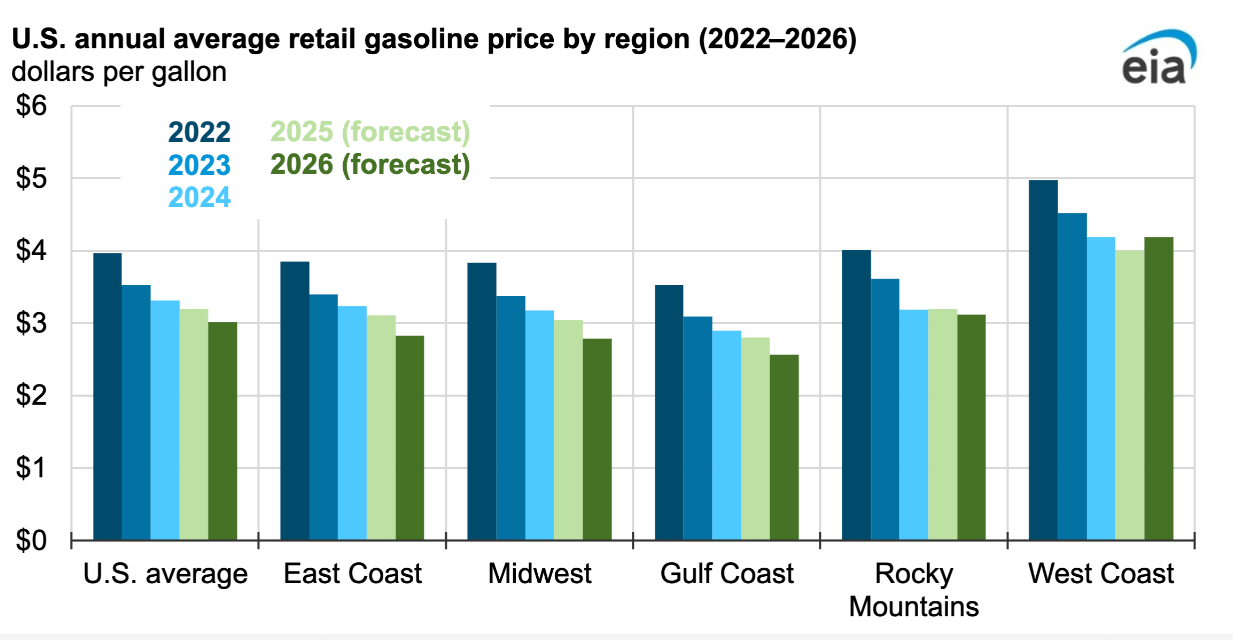
EIA Forecasts (U.S. retail): Gasoline: Average $3.70/gal in 2026 (peak ~$4.30/gal in April), up from $3.10/gal in 2025.
Diesel: Average $4.80/gal (peak >$5.80/gal in April).
Jet fuel demand growth slows to ~1.1% through 2026 amid slower aviation recovery in affected regions.
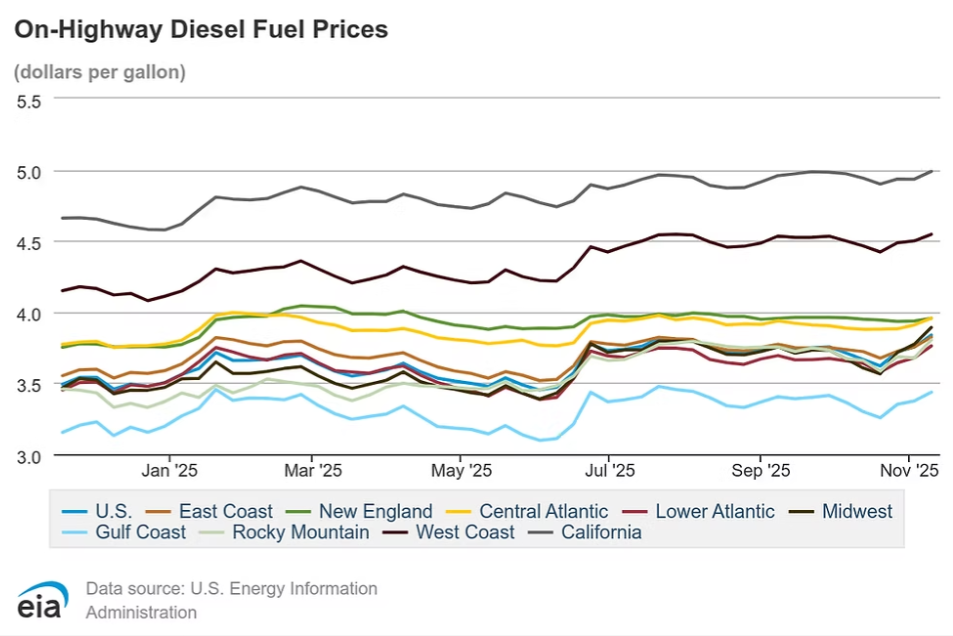
U.S. on-highway diesel and regional gasoline price trends (EIA data) show upward pressure persisting into 2026 before potential moderation.
What Consumers Will Face
U.S. drivers and businesses should brace for elevated pump prices through mid-2026. Gasoline and especially diesel will remain elevated (diesel >$5/gal peaks possible regionally), raising trucking, shipping, and agricultural costs. Heating and power bills could see indirect LNG-linked pressure in Europe/Asia, though U.S. Henry Hub-linked contracts buffer households. Aviation ticket prices may rise on jet fuel tightness. Longer-term (late 2026–2027), normalization and LNG oversupply should ease headline energy inflation, but volatility remains high if the conflict drags on.
Investor Lens: Positioning for Volatility and Fundamentals
Short-term: High prices and tight products favor upstream producers and refiners. Integrated majors (ExxonMobil – XOM, Chevron – CVX) benefit from diversified portfolios and strong balance sheets. U.S. shale/low-breakeven operators (Permian-focused) and midstream (EPD, KMI) offer stability. Refiners (Valero – VLO, Marathon – MPC) are well-positioned on robust diesel/jet cracks. LNG exporters like Cheniere Energy (LNG) stand out: long-term contracts insulate from spot weakness, while U.S. arbitrage opportunities persist amid global disruptions. Avoid pure-play new projects exposed to uncontracted volumes. Longer-term (2027+): Focus on resilient, low-cost assets as surpluses build. Diversified majors and contracted LNG players remain preferable to high-cost or spot-heavy names. Monitor OPEC+ compliance and conflict resolution for entry points.
Bottom Line: Oil prices are likely to peak in Q2 2026 before easing toward $80–90/bbl (or lower) on supply normalization, while LNG enters a buyer-friendly phase with structural oversupply.
The only certainty is that the old pricing matrices are being rewritten in real time. The disparity between physical delivery and paper prices for futures is absolutely out of balance. This out-of-balance is being observed by US oil and gas producers, and they are practicing fiscal responsibility by deploying exploration capital as if the price will remain in the $70 range. The other key trend we are seeing is the use of AI in the oil and gas market to reduce administrative costs and keep production going.
We saw the U.S. Rig count fall by 3 this week, but yet prodcution still increased. I am trying to weed through the reporting to see how long this can continue.
The global restructuring around oil, natural gas, and LNG is going to be a huge transition. China will not be buying oil at way below market prices, and the Belt and Road initiatives will be challenging to maintain without the lopsided trading advantage of “Stollen Oil”. I use the term “Stolen Oil” because they trade the oil for $20 to $30 below market prices and then sell products and services back to that country at inflated prices. The real question is, do you think China will sit idly while the game is changed in front of them? I do not have that answer.
I was on several calls yesterday for new production drilling projects, and they are extremely promising. The world will need oil and gas for decades, while 90% of the oil and gas produced today comes from depleted or depleting fields. New exploration needs to be planned, and capital saved during the high prices for new exploration. – Stu Turley
Consumers absorb higher near-term costs; investors should favor quality, hedged plays in a volatile but fundamentally shifting market
Appendix: Sources and Links
- EIA Short-Term Energy Outlook (April 2026): https://www.eia.gov/outlooks/steo/
- IEA Oil Market Report – April 2026: https://www.iea.org/reports/oil-market-report-april-2026
- OPEC Monthly Oil Market Report – April 2026: https://www.opec.org/monthly-oil-market-report.html (or direct PDF download)
- Wood Mackenzie LNG Outlook / IEA Gas Market Report (Q1 2026 references)
- Comparative analyses via IEF.org (demand growth and balance charts)
- Additional financial views: J.P. Morgan, Goldman Sachs research summaries (publicly referenced).
All data is current as of April 17, 2026. Forecasts are scenario-dependent on conflict resolution; always cross-reference latest agency releases. Energy News Beat – Delivering clarity in complex energy markets.