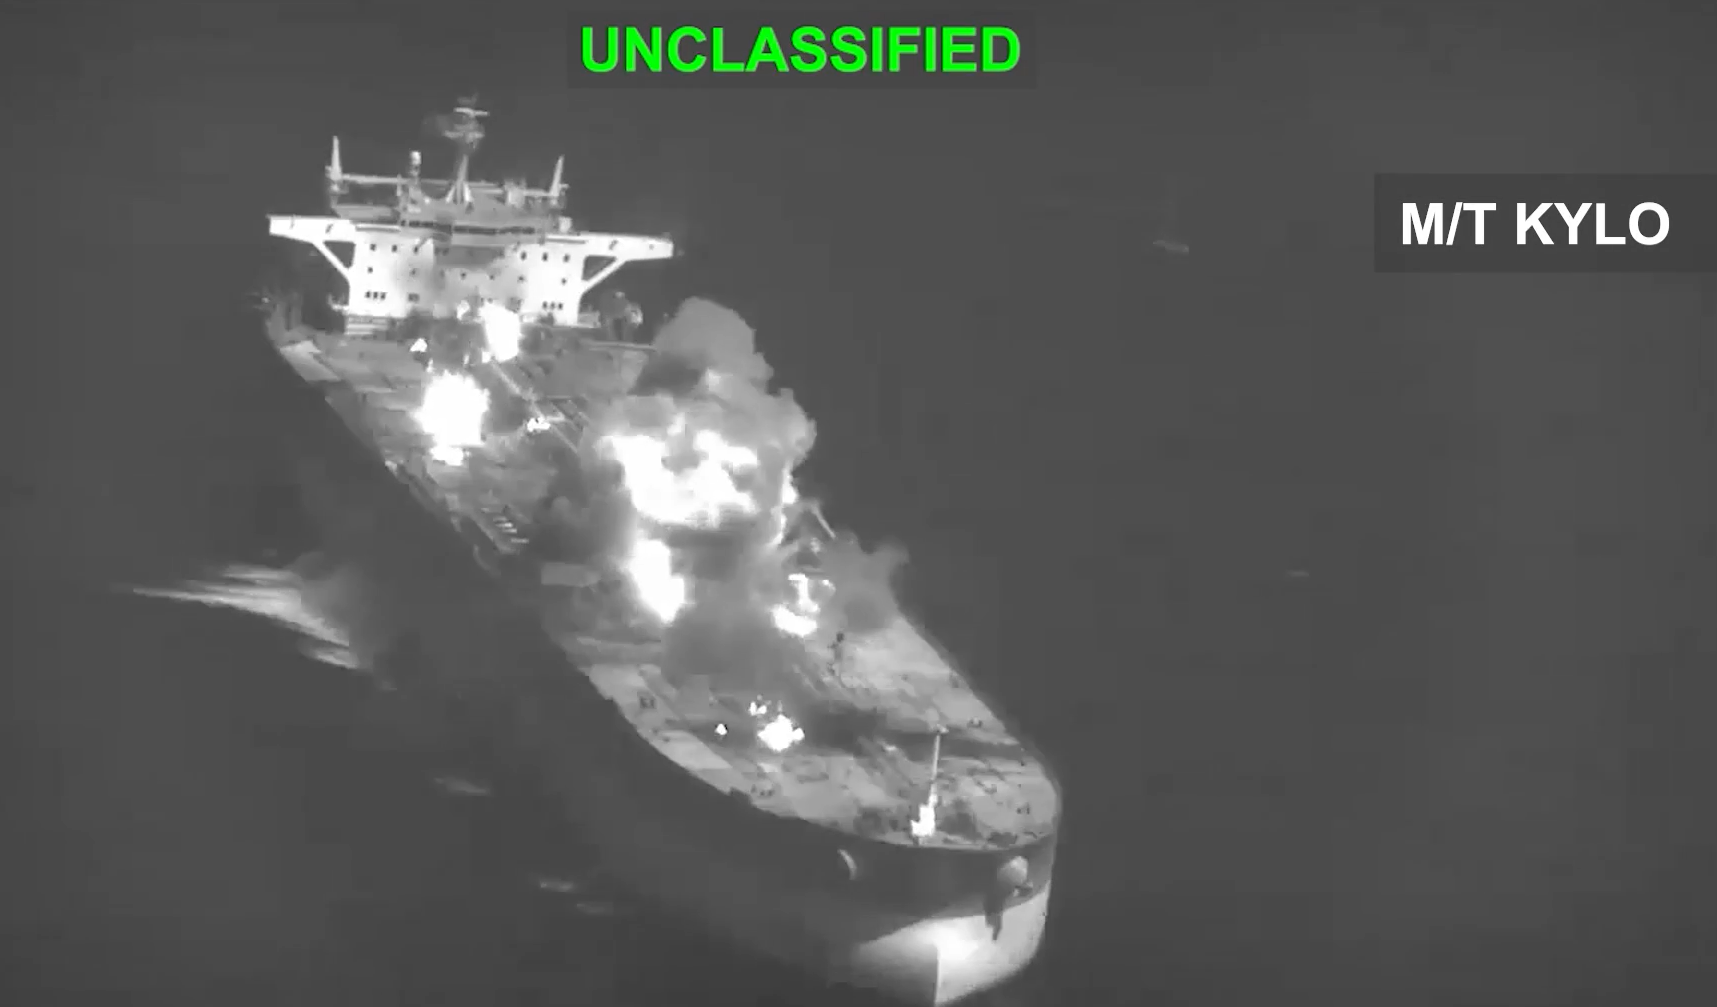
U.S. Central Command struck three Islamic Revolutionary Guard Corps-linked crude oil tankers on September 5 after Iran fired ballistic missiles at two U.S. Navy warships in regional waters. The American ships evaded the attack. No U.S. personnel were harmed. Tehran’s shadow fleet paid the bill.
That is the energy war in one exchange: Iran shoots at U.S. hulls; Washington takes Iranian barrels and steel off the water.
What CENTCOM Said
In its official statement and X post, CENTCOM reported that IRGC forces launched ballistic missiles toward a U.S. aircraft carrier and a guided-missile destroyer. Both ships “successfully evaded multiple unprovoked Iranian attacks.”
The U.S. response was immediate and economic as much as military:
M/T Downy — permanently disabled off Kharg Island, Iran’s main crude export hub.
M/T Stark 1 — permanently disabled near Jask, on the approach to the Strait of Hormuz.
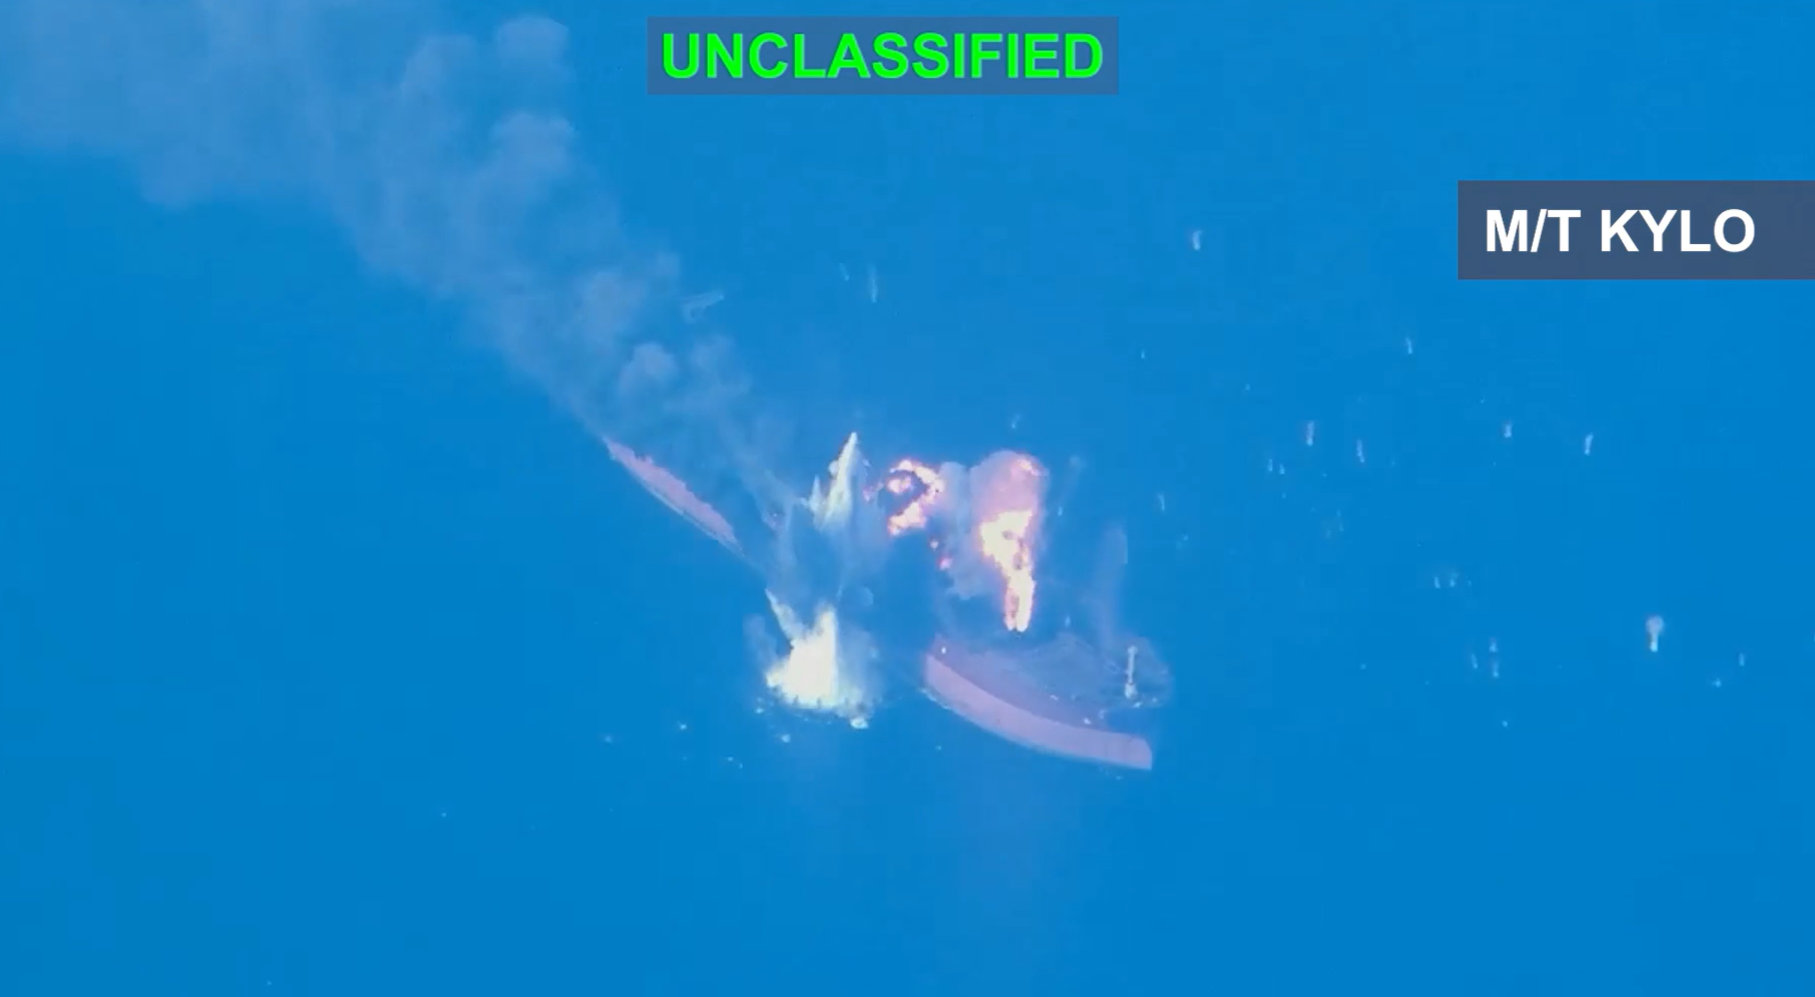
M/T Kylo (also known as “Noxen”) — completely destroyed in the Gulf of Oman. The tanker was unladen. Crews were ordered to abandon ship before U.S. forces struck it in multiple critical locations.
CENTCOM said the three vessels belong to a “multibillion-dollar shadow network that funds the IRGC and its regional proxies,” and that “Iran has no means by which to defend them.”Adm. Brad Cooper, CENTCOM commander, put the ratio in plain language:
“Let the message to the IRGC be clear: If you shoot at two of our ships, we will impose an even higher economic cost — taking out three of yours. We will not hesitate to defend American forces, and if necessary, destroy Iran’s limited and exposed oil fleet.”
CNN later reported radio warnings issued before at least one strike, including a U.S. aircraft telling Stark 1 it had 10 minutes to clear crew from the stern. Iranian state media separately claimed a tanker was hit near Kharg. There were no reported casualties on the targeted tankers in the U.S. account.
The strikes come after a month of relative calm collapsed and fighting over Hormuz resumed. The war that began with U.S. and Israeli strikes on February 28 has already turned the strait from a routine oil highway into a contested corridor with a U.S. blockade on Iranian ports and a running fight over who actually controls transit.
How Many U.S. Ships Were Targeted — and Hit
In this incident, two U.S. Navy warships were targeted. Zero were hit. CENTCOM identified them only as an aircraft carrier and a guided-missile destroyer. Both evaded the missiles. No American personnel were harmed.
That distinction matters. Targeting is not the same as a hit. Iran can launch. Getting through U.S. defenses at sea is another problem.CENTCOM did not name the two ships. Broader war reporting has documented U.S. personnel casualties across the campaign — Stars and Stripes cited Pentagon figures of 18 U.S. service members killed and more than 790 wounded as of this week — but those numbers cover the wider fight, including bases and other operations, not a confirmed strike on a U.S. Navy warship in Saturday’s attack.
Saturday’s scoreboard, as CENTCOM framed it: Iran targeted two U.S. warships and hit none. The United States targeted three IRGC oil tankers and disabled or destroyed all three.
Strait of Hormuz Traffic in the Last Month
Pre-war, the strait handled on the order of 138 vessels a day, or roughly 900-plus transits a week. That world is gone.
August 2026 traffic was a fraction of that baseline, and the numbers depend on who is counting.U.S.-facilitated transits logged in Joint Maritime Information Center-style updates ran in bursts of roughly 27 to 74 ships per 48- to 72-hour window through August and into early September. Recent windows included 74 ships over August 20–22, 65 over August 27–29, 39 over August 30–31, and 44 over September 1–2. Add those windows up and U.S.-facilitated traffic for August is on the order of several hundred ships — not the thousands that used to pass in a normal month.
Commercial tracking tells a similar story at a lower altitude:Kpler counted about 121 crossings in the week of August 17–23, after 118 the prior week. Lloyd’s List Intelligence put one mid-August week at 108 transits, a post-MoU high that was still far below normal.
UKMTO data showed 101 outbound full transits in the seven days ending August 28.
Kpler tracked crude moving through Hormuz at about 2.3 million barrels per day in August, down from 4.49 million bpd in July and 15.82 million bpd in the three months before the February attacks.
CENTCOM’s own running tally is higher than AIS-only counts because many ships now run dark. As of August 21, the command said it had assisted about 1,300 commercial vessels through the strait since early May, moving more than 660 million barrels of crude on protected southern routes. Earlier CENTCOM comments referred to “hundreds of ships” in recent two-month windows and, in midsummer, nearly 1,500 vessels carrying roughly 750 million barrels over a longer stretch.
The honest read: Hormuz is not sealed shut. It is also not open in any pre-war sense. U.S. forces are pushing a southern corridor. Iran is still trying to dictate the northern route and tax or punish traffic that ignores it. The result is a thin, expensive, heavily escorted trickle compared with the 20 million barrels a day of oil and products that used to move through the chokepoint.
How Much Iranian Oil Is Still Making It to Market
Iran spent years rebuilding exports under sanctions. The 2026 war and the U.S. blockade punched a hole in that recovery.
Crude production (EIA-linked annual averages):
|
Year
|
Crude production (million b/d)
|
|---|---|
|
2020
|
2.51
|
|
2021
|
2.95
|
|
2022
|
3.14
|
|
2023
|
3.53
|
|
2024
|
3.95
|
|
2025
|
4.05
|
Exports to market:
- 2020: about 0.34–0.40 million b/d after “maximum pressure.”
- 2023: roughly 1.4 million b/d.
- 2024: about 1.5 million b/d.
- 2025: EIA estimated 1.58 million b/d of crude and condensate, generating about $48 billion, with 99.4% going to China. Other trackers put 2025 closer to 1.6–1.7 million b/d.
- Early 2026, pre-war: about 1.7–2.0 million b/d.
- March 2026: still near 1.8–1.9 million b/d as cargoes rushed out.
- May 2026: collapse to 209,000–260,000 b/d under the first blockade — a six-year low.
- June 2026: rebound to about 1.75 million b/d after a memorandum of understanding briefly lifted pressure. UANI tracked 52.7 million barrels for the month.
- July 2026: The blockade returned July 14. Loadings fell to roughly 740,000 b/d.
- August 2026: Kpler, Vortexa, and related reporting put loadings around 220,000–277,000 b/d — more than 80% below August 2025’s 1.7 million b/d. Reuters reported that for about seven weeks after the July 14 blockade, no meaningful Iranian crude cargoes successfully transited Hormuz to China. What still sold came from floating storage already outside the Gulf.
That is the 2026 oil story in one line: Iran got back to mid-1 million-barrel export rates under sanctions, then lost most of the waterborne route when the United States decided the shadow fleet itself was a target set.
Saturday’s tanker strikes fit that campaign. Kharg Island is where Iran loads the majority of its crude. Jask sits on the Hormuz approach. The Gulf of Oman is the escape hatch. Hitting Downy, Stark 1, and Kylo is not just retaliation for two missed missiles. It is another cut in the logistics chain that funds the IRGC.
Market Reality
The strait still moves some Gulf oil — just not Iran’s oil in any volume that resembles 2025. Neighbors have rerouted more barrels through Fujairah, the East-West Pipeline, and whatever southern-corridor sailings U.S. forces can protect. Iran is sitting on stranded cargoes inside the blockade line and a shrinking floating-storage cushion in Asia.
Cooper’s 2-for-3 message was not subtle. Iran can keep firing at U.S. warships. The United States can keep subtracting tankers from a fleet Tehran cannot escort. For oil markets, the question is no longer whether Iranian barrels are sanctioned on paper. It is how many physically clear the water — and how long China can live off storage that is not being replenished.
Appendix: Sources and Links
CENTCOM primary
- CENTCOM official release: https://www.centcom.mil/MEDIA/PUBLIC-RELEASES/Article/4591744/centcom-destroys-3-irgc-oil-tankers-after-iran-targets-2-us-navy-warships/
- CENTCOM X post: https://x.com/CENTCOM/status/2096231596449767452
- DVIDS video/release: https://www.dvidshub.net/video/1021952/centcom-destroys-3-irgc-oil-tankers-after-iran-targets-2-us-navy-warships
Incident coverage
- CNN: https://www.cnn.com/2026/09/05/middleeast/iran-us-tanker-kharg-intl
- BBC: https://www.bbc.co.uk/news/articles/cj64rrne643o
- Stars and Stripes: https://www.stripes.com/theaters/middle_east/2026-09-05/us-strikes-iran-oil-carriers-22761207.html
- NBC News: https://www.nbcnews.com/world/iran/us-strikes-3-iranian-oil-tankers-iran-targets-rcna596222
- Al Arabiya: https://english.alarabiya.net/News/middle-east/2026/09/05/centcom-says-it-struck-three-iranian-oil-tankers-after-irgc-targeted-two-us-warships
- Defence Blog: https://defence-blog.com/u-s-forces-destroy-three-iranian-oil-tankers/
Hormuz traffic
- Heimdall / JMIC transit tables: https://heimdallsbrief.com/jmic-hormuz-transits
- Lloyd’s List Intelligence, Aug. 27 brief: https://www.lloydslistintelligence.com/resources/blog/strait-of-hormuz-brief-27-august-2026
- Kpler / Foreign Policy Journal week of Aug. 17–23: https://www.foreignpolicyjournal.com/2026/08/27/strait-of-hormuz-traffic-holds-steady-as-route-uncertainty-persists-kpler-data-shows/
- Gulf News / CENTCOM 1,300-vessel tally: https://gulfnews.com/business/energy/1300-commercial-vessels-transited-strait-of-hormuz-since-may-2026-us-centcom-1.500648368
- Reuters on August Hormuz crude flows: https://www.reuters.com/commentary/reuters-open-interest/asias-crude-oil-imports-stay-soft-august-challenging-us-hormuz-claims-2026-08-27/
- New York Times on U.S.-protected corridor: https://www.nytimes.com/2026/08/19/business/iran-hormuz-oman-us-navy.html
- Energy Connects / Bloomberg on U.S. transit counts: https://www.energyconnects.com/news/gas-lng/2026/june/us-forces-see-nearly-1-000-hormuz-crossings-since-ceasefire/
Iranian oil production and exports
- EIA 2025 Iran export snapshot via LeapRate: https://www.leaprate.com/financial-services/rules-and-regulation/the-last-ledger-eias-iran-report-captures-a-48bn-oil-trade-on-the-eve-of-the-war/
- YCharts / EIA annual crude production: https://ycharts.com/indicators/iran_crude_oil_production_annual
- UANI June 2026 Tanker Tracker: https://www.unitedagainstnucleariran.com/analysis/june-2026-iran-tanker-tracker
- Reuters May 2026 export collapse: https://www.reuters.com/business/energy/iranian-oil-exports-fall-lowest-level-six-years-data-shows-2026-06-04/
- Reuters Sept. 1 blockade/export stall: https://www.usnews.com/news/world/articles/2026-09-01/blockade-succeeds-where-sanctions-failed-as-iran-oil-exports-stall
- IBTimes / Kpler August loadings: https://www.ibtimes.com/iranian-oil-exports-plunged-over-80-august-us-blockade-persists-data-shows-3806898
- S&P Global on 2026 output recovery limits: https://www.spglobal.com/energy/en/news-research/latest-news/crude-oil/061926-iranian-oil-output-and-export-recovery-may-lag-middle-east-neighbors-analysts
- EIA older Iran country analysis (2023–24 baseline): https://www.eia.gov/international/content/analysis/countries_long/Iran/pdf/Iran%20CAB%202024.pdf