
Saudi Arabia, Iraq, and West African sellers are cutting prices to cover record tanker bills, and Brent futures barely flinch. The catch: the barrel that actually reaches a refinery costs more than the screen says, not less. Here is what that gap means for your fill-up, your grocery bill, and the odds of a recession. Tomorrow morning at 9:00 Central, Stu Turley, Charlie Garcia, and Doomberg will be on the Energy News Beat Podcast and the Capital Mischief Podcast. We’ll cover this article, and the Staff used AI or Super Intelligence to assemble my show notes before the show. Now you can get a glimpse of Stu’s prep before a show. I’m not sure I have seen many podcast show notes published before the podcast airs, but here we are.
You can watch the episode live here on October 8 at 9:00 Central.

Show Notes: This will help if you want to ask questions durring the live feed.
The barrel you never see, and the one you pay for
Fill a 15-gallon tank with regular today and you hand over about $65.50. A year ago the same tank cost $46.82. AAA puts the national average at $4.37 for regular and $6.30 for diesel, against $3.12 and $3.68 a year ago (AAA). In Georgia, truck driver Lloyd Smith told Atlanta News First he fills up about every other day, for $1,400 to $1,500 a time. OOIDA’s George O’Connor puts the rule of thumb plainly: “Every dollar increase per gallon in diesel adds around $400 per week in operating cost” (Daily Caller News Foundation via Tennessee Star). At today’s diesel price, that is roughly $1,048 a week more than a year ago for a typical long-haul rig (ENB calculation), and some of that lands on the grocery shelf.
So it stings to read that producers are now discounting crude. Saudi Arabia just cut its November price to Asia to the lowest level in six years. Iraq is offering October cargoes at more than $30 under its benchmarks. West African barrels are being marked down by double digits. If sellers are slashing prices, why does the screen still say Brent is about $100, and why is your pump still near $4.37?
A reader put that question to ENB with a thesis: Gulf producers are discounting crude because tanker fees are so high, and those discounts aren’t showing up in Brent or WTI futures. We checked it against pricing documents, freight data, physical-market assessments and what traders say. Short answer: the reader is partly right, and the part that’s wrong matters most for your wallet.
Yes, the discounts are real
Start with Saudi Arabia. Aramco set its November Arab Light official selling price (OSP) to Asia at $5.00 a barrel below the Oman/Dubai average. That is a $3 cut from October’s minus $2.00, and the widest discount since June 2020, according to the Reuters report of the pricing document (EnergyNow/Reuters; Business Times). Both numbers in the reader’s note are right; they describe the same move. A Reuters survey had expected a hike. Three Asian refining sources told Reuters the cuts “appeared to be aimed at compensating buyers for the elevated freight costs.”
The swing over the year is striking. In May, with the Strait of Hormuz largely shut, Arab Light carried a record $19.50 premium to Oman/Dubai (Reuters via Zawya). By August it had flipped to a discount after an $11 cut, the biggest in Reuters data back to 2003 (EnergyNow/Reuters). November’s minus $5 completes a $24.50 round trip.
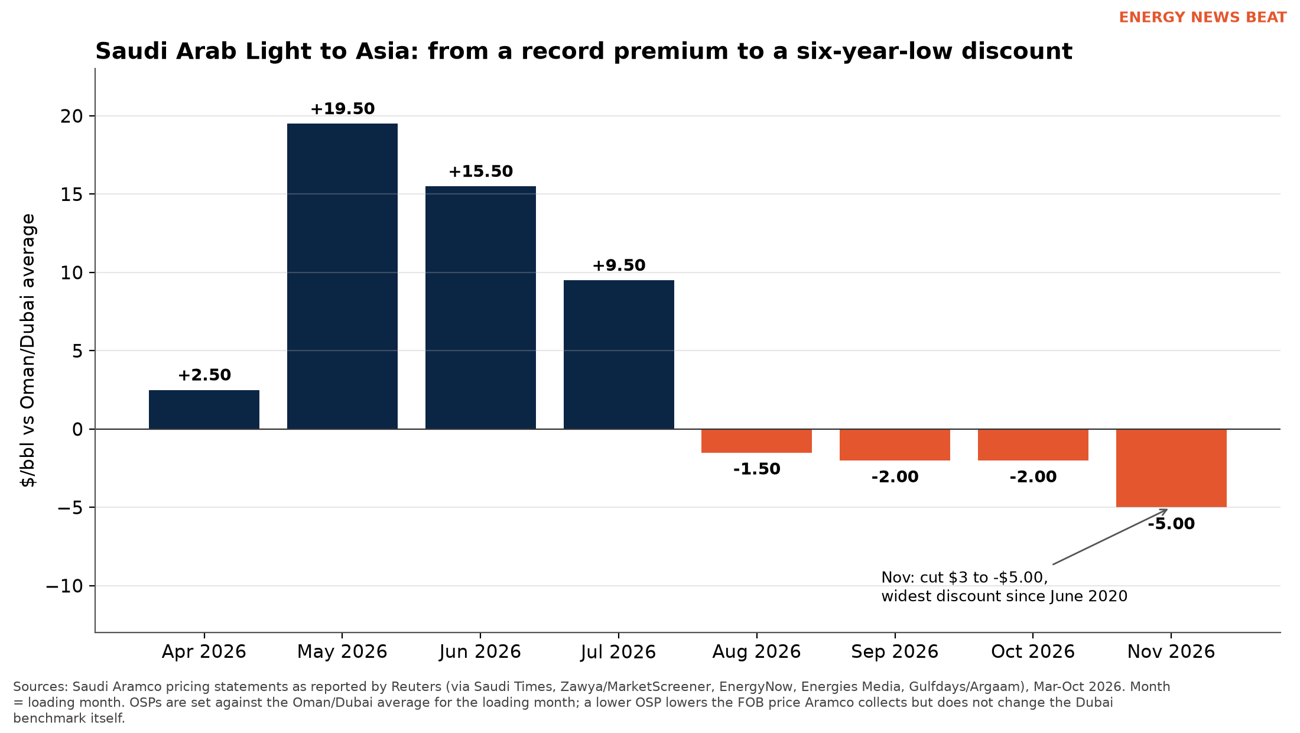
Chart 2. Saudi Arab Light OSP to Asia vs. the Oman/Dubai average, April–November 2026 loadings. Sources: Saudi Aramco pricing statements as reported by Reuters and syndication partners (see Appendix A).
Iraq is going further. SOMO’s official October OSP for Basrah Medium was actually set at parity with Oman/Dubai, and Basrah Heavy at minus $3.30 (SNSUC). The deep cut sits in a separate layer: SOMO offered term buyers discounts of $34.50 (Medium) and $37 (Heavy) per barrel off destination benchmarks to lift October cargoes FOB, wider than the sub-$30 discounts for August and September, “as freight rates soared and risks to lifting inside the Strait of Hormuz remained” (Reuters via Zawya; Shafaq). Reuters also reported on Sept. 28 that Aramco was weighing a discount of about $9 a barrel on ship-to-ship cargoes off Oman, after selling them at premiums of $10 to $20 over OSP in prior weeks (Baird Maritime/Reuters).
West Africa tells the same story. By Oct. 2, Congo’s Djeno was offered around $15.35 under Dated Brent and Angola’s Hungo around $9.90 under (CommodityScope). In June, Platts had Djeno at minus $10.845, then a record back to 2013 (Reuters via CNBC Africa). Bloomberg ran the headline “West Africa Oil Trades at Record Discount as Freight Costs Surge” on Oct. 7; ENB could not read the paywalled story and does not cite a number from it. Canada too: November Western Canada Select settled $24.80 under WTI at Hardisty, the widest since November 2023, because record tanker rates made re-exporting heavy barrels from the Gulf Coast “cost-prohibitive,” traders told Reuters (via BOE Report).
Freight is eating the difference
ENB covered the freight bill in detail on Oct. 4 (ENB); here is the short version and what has changed since. The Baltic Exchange’s TD3C route, a 270,000-ton supertanker from the Gulf to China, hit a record $1.33 million a day on Monday, Oct. 5, up 10% in a week and about 21 times a year earlier (Gulf Insider/Lloyd’s List); TokenPost reported the same record on Wednesday morning (TokenPost). LSEG put a year-ago rate near $80,000 a day (EnergyNow/Reuters).
Per ton, TD3C went from $45.42 on Feb. 27, the last trading day before the war, to $229.76 at the end of September (Anadolu/Baltic Exchange). At about 7.33 barrels per ton for a medium crude like Arab Light, that is roughly $6 a barrel then and $31 a barrel now (ENB conversion). Insurance is on top: war-risk premiums run 6% to 10% of hull value, “adding as much as $20 million in insurance costs for a single supertanker voyage into the Gulf” (TBS News).
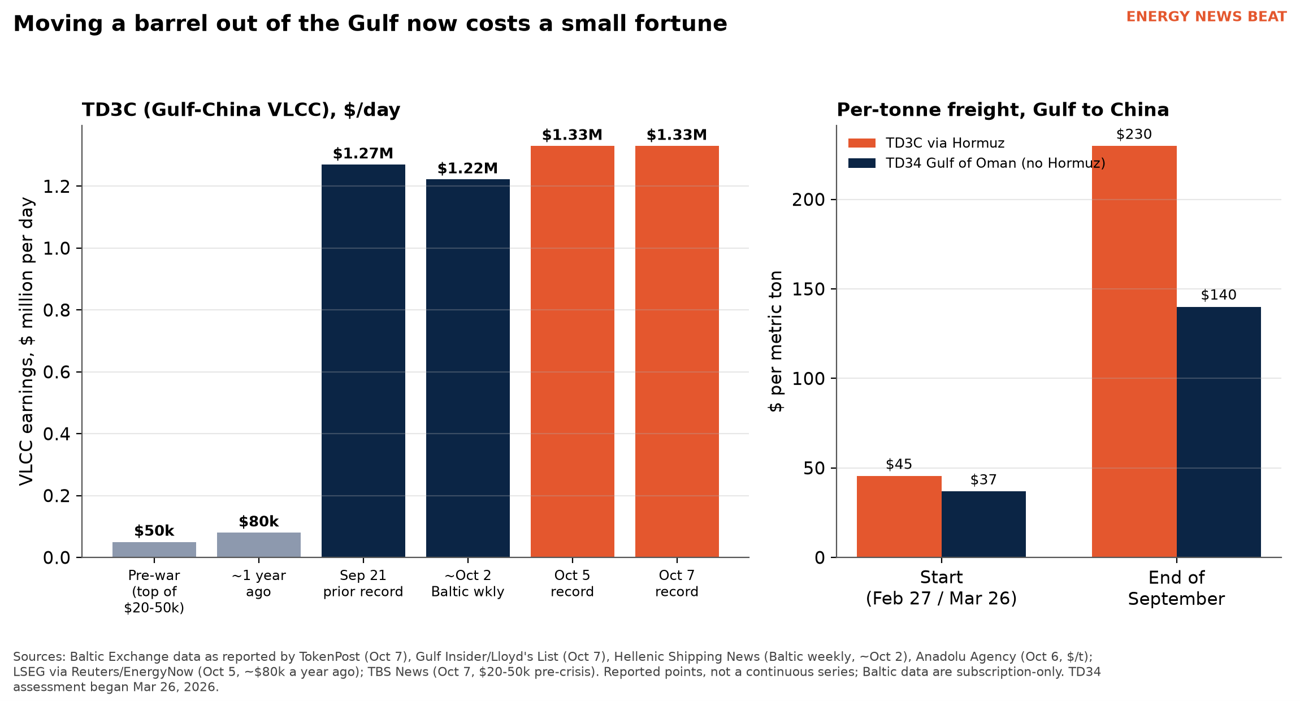
Chart 4. Reported TD3C VLCC earnings and per-ton Gulf–China freight. Sources: Baltic Exchange via TokenPost, Gulf Insider/Lloyd’s List, Hellenic Shipping News and Anadolu; LSEG via Reuters; TBS News.
A refiner in Korea cares what a barrel costs in its tank, not at Ras Tanura. When freight rises $25 a barrel, someone eats it. Robin Mills of Qamar Energy told AGBI: “The discounts are pretty interesting because they’re a measure of just how expensive it is to move oil through the Gulf.” CommodityScope’s weekly put it more bluntly: “FOB differentials are being forced lower by freight rather than simple oversupply” (CommodityScope).
Why Brent barely notices
Here the reader’s instinct holds up. Brent futures are a North Sea contract settled in London. A Saudi OSP cut is priced off Dubai and Oman. An Iraqi term rebate never prints on any exchange at all. Michael Ryan, a freight analyst at Sparta, told Anadolu that freight “will price some grades out of Asia unless sellers offer steep discounts on FOB” prices. In Anadolu’s paraphrase, Ryan said the impact of high freight would not necessarily appear directly in the outright Brent price; it shows up instead in grade differentials and in the Brent-Dubai exchange of futures for swaps (EFS).
That is what the paper market is doing. The Brent/Dubai EFS fell about $2 to $7.57 a barrel on Oct. 6, and the Nov/Dec Dubai spread eased from $3.30 to $2.70 (Flux). Kpler’s Homayoun Falakshahi wrote that with Saudi loadings at a six-year high, “the physical market is looser than the paper structure suggests,” and that “producers with ships can defend volume; those without must pay for it in differentials. The Gulf price war has effectively begun” (Kpler). That explains why Saudi Arabia, with a national fleet of about 50 VLCCs, cut only $3 while Iraq, short of ships, is rebating $30-plus.
But the delivered barrel is not cheap. It is very expensive
Now the part that cuts against the thesis. If you measure at the refinery gate instead of the loading port, physical crude is trading above futures, often far above. EIA’s Brent spot series, a physical North Sea assessment, was $125.44 on Oct. 6, when the front-month ICE Brent future settled at $100.58. The gap averaged $12.36 in September and peaked at $33.26 on Oct. 2, versus about $1.48 in February and $0.53 in late 2025 (EIA; ICE via Yahoo Finance; ENB calculation).
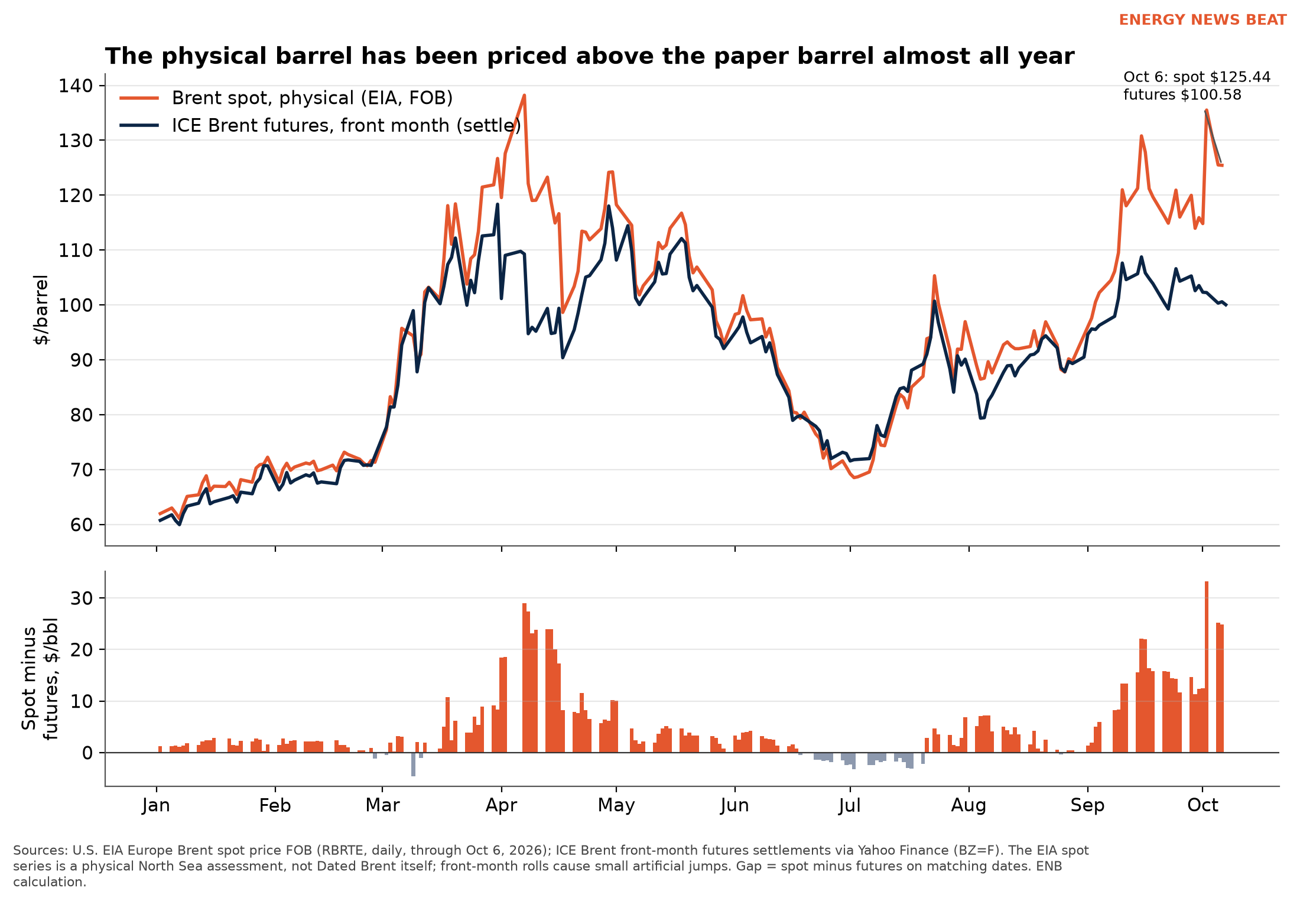
Chart 1. EIA Brent spot (physical) vs. ICE Brent front-month futures, and the gap between them, Jan. 2–Oct. 6, 2026. Sources: U.S. EIA; ICE via Yahoo Finance; ENB calculation.
The people who buy and sell the physical stuff say the same. Chevron CEO Mike Wirth said on Oct. 6 that “the landed price of physical oil in Asia is currently closer to $150 per barrel than $100, where Brent oil futures are trading” (Reuters via ETEnergyworld). Aramco CEO Amin Nasser said some physical barrels are changing hands at $20 to $50 over Brent (Business Upturn). Wood Mackenzie says Norway’s Johan Sverdrup moved from a typical 3% discount to a record $24 premium to Brent, with medium-sour crude in Europe priced above $140 (Wood Mackenzie). And the same West African oil that looks cheap at the dock looks dear on arrival: Indian Oil bought Angolan Nemba for November delivery at Dated Brent plus $18, and Murban at plus $13 to $14 (Reuters via Egypt Oil & Gas). Chinese independents paid $12 to about $20 over ICE Brent delivered for Iraqi and Qatari crude (Reuters via Economic Times).
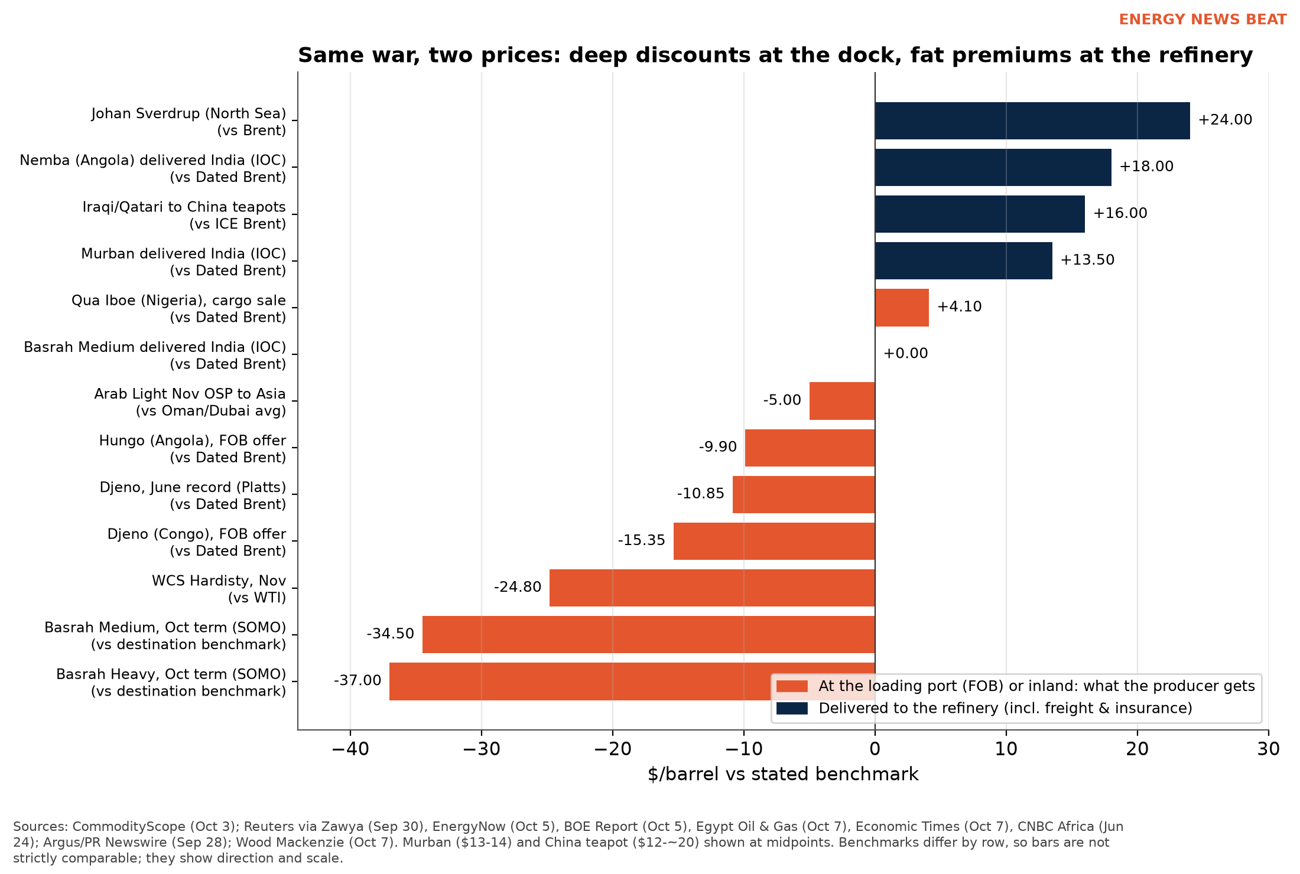
Chart 3. Reported FOB discounts vs. delivered premiums, late September–early October 2026 (June Djeno record for reference). Benchmarks differ by row. Sources: see Appendix A.
This also reconciles ENB’s earlier Hormuz coverage, which found physical Brent running well above futures at times (ENB, Oct. 6). Both things are true at once. Atlantic Basin crude that can reach a refinery quickly commands a big premium. Gulf and West African crude that needs an expensive, risky voyage has to be marked down at the dock to compete. Brent futures sit in the middle, and the tanker owners and insurers collect the spread.
Verdict on the thesis: partly right
- Supported: Gulf and West African producers are cutting FOB prices and differentials, and buyers and analysts tie it to freight. Saudi, Iraqi and West African cuts all check out.
- Supported: Those cuts barely move outright Brent or WTI. They show up in OSPs, grade spreads, Dubai structure and the Brent-Dubai EFS, as Sparta and Kpler describe.
- Not supported: That physical oil is “cheaper than the trading floor says.” Delivered physical crude is trading $12 to $50 over Brent, depending on grade and destination. The producer gets less, the refiner pays more, and freight and insurance absorb the gap. That CIF-high, FOB-low pattern explains the whole picture.
For drivers, the takeaway is uncomfortable. A Saudi discount at the loading port does not mean cheaper gasoline at your corner station, because the refinery is paying for the voyage, not the dock price.
Demand destruction: real abroad, mild at home
ENB has argued that oil is not running to $200 because high prices are killing demand. The evidence is strongest outside the United States. The IEA’s September report forecast world oil demand to fall 2.5 million barrels a day in 2026, 940,000 b/d steeper than a month earlier, with losses concentrated in diesel-type fuels and petrochemical feedstocks in Asia (IEA). EIA’s October outlook trimmed 2026 world consumption to about 102.4 million b/d, from 102.6 in September, and 2027 to 104.6 from 105.0 (EIA STEO; ENB comparison of vintages). FGE NexantECA and Energy Aspects cut China’s fourth-quarter crude import forecasts by about 400,000 b/d, to 9.2 to 9.3 million b/d, well below last year’s 11.6 million (OilPrice). Refinery runs in Shandong fell to about 55% by late September as margins turned negative (Reuters via Economic Times). Breakwave’s tanker desk wrote that “demand destruction has become the primary mechanism required to rebalance the market” (Breakwave).
At home the picture is softer. EIA’s implied U.S. gasoline demand averaged 8.78 million b/d over the four weeks to Oct. 2, just 0.3% below the same weeks of 2025. Distillate was down 1.6% and 3.0% below the 2021–25 average. Jet fuel was up 6.0% (EIA; ENB calculation). EIA’s outlook has U.S. gasoline use averaging 8.75 million b/d this year, about 2% below 2025. That is a bend, not a break.
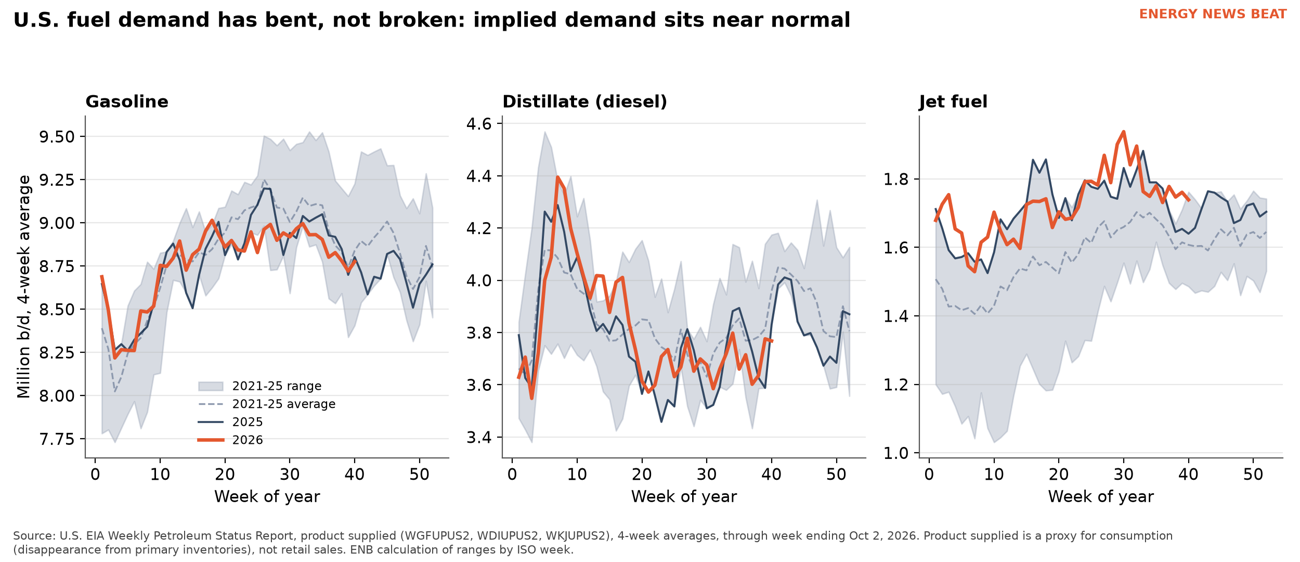
Chart 5. U.S. product supplied (4-week average) for gasoline, distillate and jet fuel: 2026 vs. 2025 and the 2021–2025 range. Source: U.S. EIA; ENB calculation.
Trucking is mixed. ATA’s tonnage index was 1.6% below a year earlier in August, and chief economist Bob Costello said tonnage was “down in four of the last five months” (ATA). Cass shipments, though, posted their first year-over-year gain since January 2023 (Cass). On the road, Georgia drivers told Atlanta News First fleets are laying off drivers and parking trucks.
The counterpoint matters: global inventories are still falling. EIA estimates stocks drew about 1.9 million b/d in the third quarter (EIA press release), and the IEA counts 507 million barrels of observed draws since February (IEA). Demand is weakening, but supply is still weaker. That is why prices have not collapsed.
How consumers and investors see it
Ask people on Main Street and you hear a recession. The University of Michigan’s sentiment index fell to 48.1 in September, down 7% in a month and 12.7% from a year earlier. Year-ahead inflation expectations jumped to 4.6%, from 3.4% in February before the war began (University of Michigan). The Conference Board’s confidence index dropped 6.7 points to 81.9; average 12-month inflation expectations rose to 6.1%. Chief economist Dana Peterson said write-in mentions of “oil and gas prices in particular, rose to new heights” (Conference Board).
“These days, I don’t go home on my lunch break so that I don’t waste gas money. I preserve it as best I can.” — Talia, a Clark County school bus driver and Teamster, Las Vegas (FOX5 Las Vegas)
Las Vegas artist Lucy Brownlee, who began driving for Lyft last year to cover her bills, said that with gas up more than $1.50 a gallon since she started, “it just doesn’t make sense anymore” (FOX5). Both spoke at a Democratic Party event; Georgia Republicans answered a similar truckers’ event by blaming Democratic energy policy (Atlanta News First). The fuel bills aren’t partisan.
Wall Street sees something else. The S&P 500 closed at 7,819 on Oct. 6, near a record, the VIX volatility gauge was about 15, and high-yield bond spreads were only about 3 percentage points over Treasurys (FRED: S&P 500, VIX, ICE BofA HY). Those are not recession prices. The bond market’s worry is rates: the 10-year Treasury yield was 5.31% on Oct. 5 (FRED). Rapidan Energy’s Bob McNally told CNBC the freight workaround is not built to last: “Nobody in Washington thinks this is sustainable financially.” And on oil: “If the market believed that this was sustainable, I think you would be seeing much lower prices.”
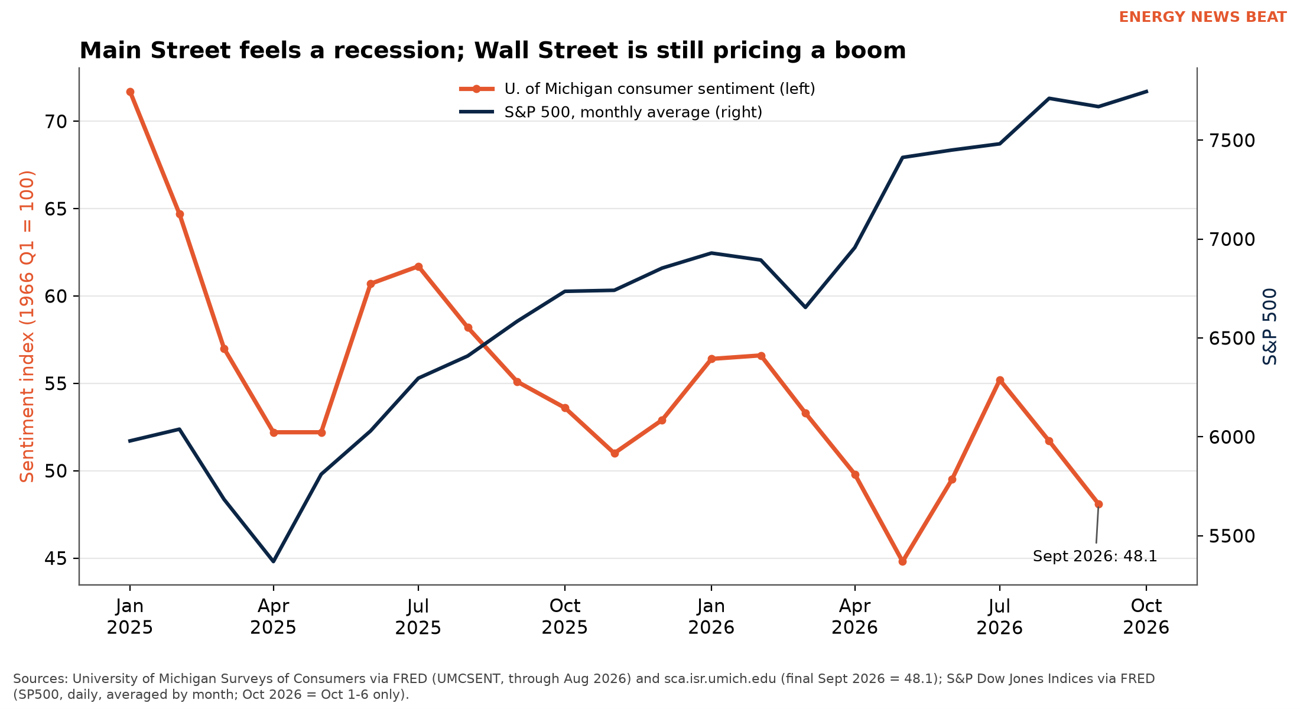
Chart 6. University of Michigan consumer sentiment vs. the S&P 500, January 2025–October 2026. Sources: University of Michigan via FRED and sca.isr.umich.edu; S&P Dow Jones Indices via FRED.
Does demand destruction end in a recession?
History says it often has. James Hamilton’s classic 1983 paper found that “all but one of the U.S. recessions since World War II have been preceded, typically with a lag of around three-fourths of a year, by a dramatic increase in the price of crude petroleum,” while cautioning that this “does not mean that oil shocks caused these recessions” (Hamilton, JPE 1983; see also his survey Historical Oil Shocks). Lutz Kilian showed that spikes driven by booming demand hurt far less than true supply disruptions (Kilian, AER 2009). Ben Bernanke, Mark Gertler and Mark Watson argued that much of the damage after past oil shocks came from the Federal Reserve’s tightening in response, not just from oil itself (Brookings, 1997).
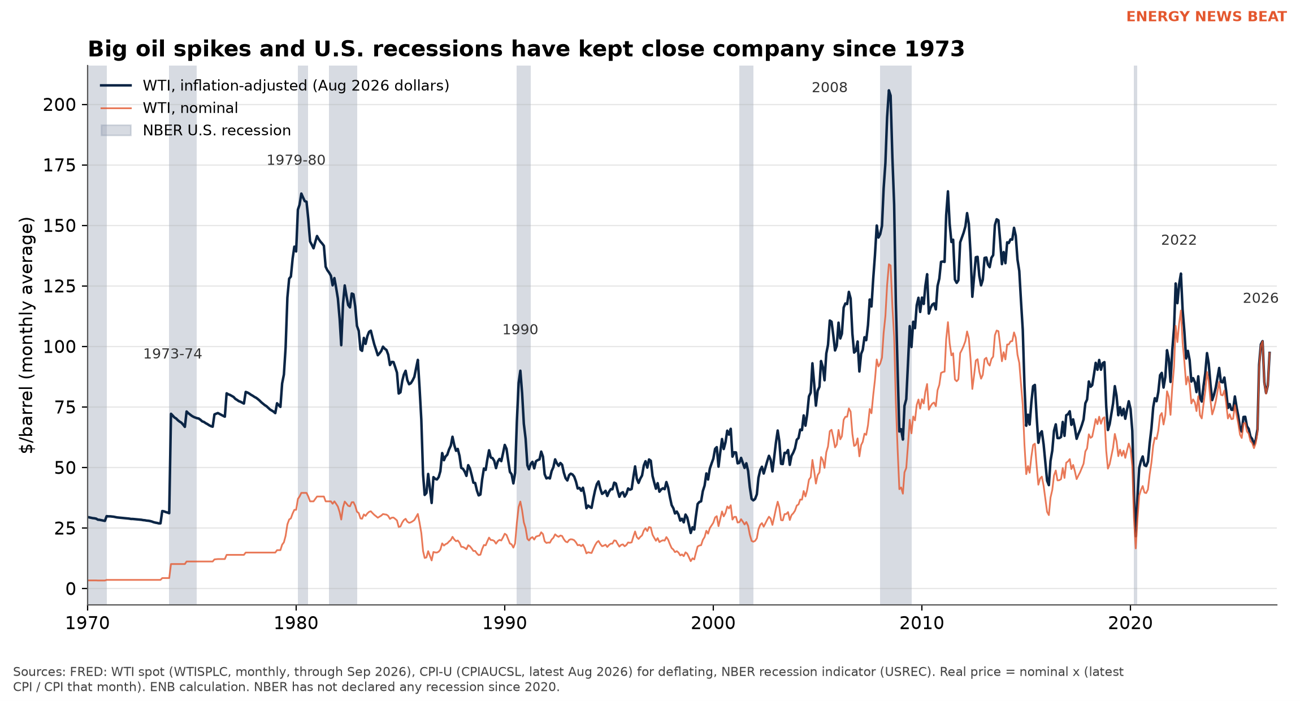
Chart 7. WTI crude, nominal and inflation-adjusted, with NBER recessions shaded, 1970–September 2026. Sources: FRED (WTISPLC, CPIAUCSL, USREC); ENB calculation.
By Kilian’s yardstick, 2026 is the dangerous kind of shock: a supply disruption, not a demand boom. And by the Bernanke-Gertler-Watson yardstick, the Fed has now done the thing that historically turned oil shocks into recessions. The reader said the Fed “just raised rates,” and that is correct. On Sept. 16, 2026, the FOMC voted 12–0 to raise the federal funds target range by a quarter point to 3.75% to 4.00%, saying “inflation remains elevated” (Federal Reserve). It was the first increase since the Fed’s 2025 cuts took the range down to 3.50%–3.75% (FRED). The next meeting is Oct. 27–28 (Fed calendar). Still, the 2022 shock is a reminder that the pattern isn’t automatic: oil rose about 70% into mid-2022 and the Fed hiked hard, but NBER has not declared a recession since 2020 (NBER; Appendix F).
Is the U.S. heading there?
The data split. September payrolls rose just 29,000, below the 84,000 expected, and unemployment rose to 4.2% (CNBC). But the Sahm rule, which flags a recession when the three-month unemployment average rises half a point above its 12-month low, reads 0.00 for September (FRED). The Atlanta Fed’s GDPNow model has third-quarter growth at 3.7% as of Oct. 6 (Atlanta Fed). The yield curve is upward sloping, at +1.06 points (10-year minus 3-month) and +0.48 (10-year minus 2-year) on Oct. 6 (FRED, FRED).
The forecasters mostly lean against a recession. Goldman Sachs’ Jan Hatzius cut his 12-month odds to 15% in the week of Sept. 7, from 30% in March, while flagging another oil shock as the trigger to watch (EnergyReader). The New York Fed’s yield-curve model puts the chance of recession by August 2027 at about 13.9% (NY Fed). Prediction markets are lower still: Polymarket at about 6.5% for a U.S. recession by the end of 2026, and Kalshi’s contract on two negative GDP quarters at 3 to 4 cents on Oct. 7 (Polymarket; Kalshi). The highest figure ENB found is J.P. Morgan’s 35% chance of a U.S. and global recession in 2026, but that dates from its December 2025 outlook, before the war (J.P. Morgan); ENB did not find a newer public J.P. Morgan number.
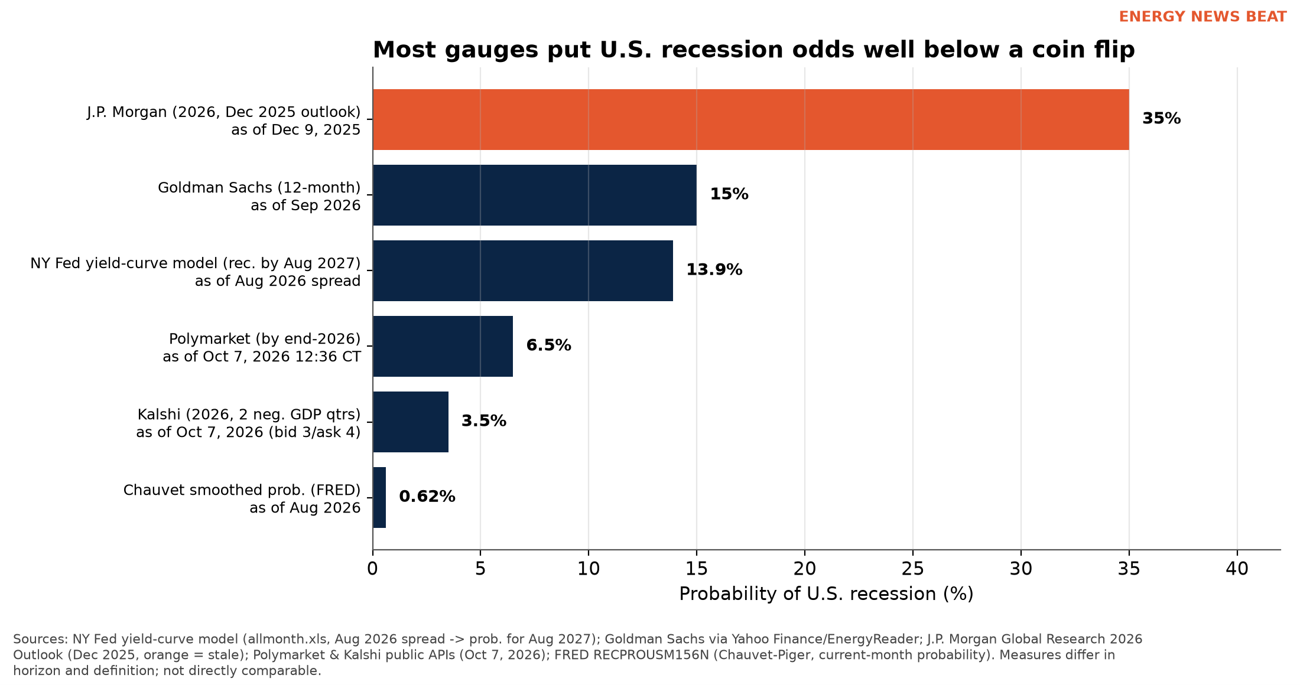
Chart 8. U.S. recession probabilities by source. Horizons and definitions differ. Sources: NY Fed; Goldman Sachs via EnergyReader; J.P. Morgan; Polymarket; Kalshi; FRED.
Our read: the U.S. is not in a recession today, and most gauges don’t expect one within a year. But the ingredients Hamilton and Bernanke warned about, a supply-driven oil shock plus a Fed raising rates into it, are both on the table, and payroll growth has nearly stalled. One more leg up in oil, or another Fed hike, would change the math fast.
And the rest of the world?
No major forecaster expects a global recession in its base case, but all of them see a slowdown. The IMF’s July update projects world growth of 3.0% in 2026, with the euro area at 0.9%, Japan 0.6%, China 4.6% and India 6.4%, and the Middle East and North Africa contracting 0.5% (IMF). The IMF’s October outlook is not yet out. The OECD’s Sept. 23 interim outlook has world growth at 2.9%, the U.S. 2.2%, the euro area 1% and China 4.5%, and warns that “the buffers that absorbed the energy shock are being depleted” (OECD). The World Bank, in June, projected 2.5% global growth, the weakest since the pandemic, with directly affected Gulf economies falling to close to zero; a severe scenario cut global growth to 1.3% (World Bank). The weakest links are energy importers with thin cushions: Europe, Japan and much of emerging Asia.
What to watch
- November OSPs from Iraq, Kuwait and ADNOC. None were public by ENB’s deadline. If they follow Saudi Arabia lower, the “Gulf price war” is broadening.
- The Brent-Dubai EFS and Dated-to-futures spreads. These are where FOB weakness and delivered strength show up first, long before outright Brent.
- TD3C and war-risk premiums. If freight eases, FOB discounts should shrink and delivered premiums should fall, which is the only route to cheaper pump prices that doesn’t require a recession.
- The Oct. 27–28 FOMC meeting and the Oct. 29 advance estimate of third-quarter GDP (Fed; Atlanta Fed release calendar).
- The IEA’s October oil report and the IMF’s October World Economic Outlook.
Appendices
Appendix A. Sources (accessed Oct. 7, 2026, about 11:00 a.m.–1:15 p.m. CT unless noted)
Gulf official selling prices and producer discounts
- Reuters via EnergyNow, “Saudi Arabia Unexpectedly Cuts November Oil Prices to Asia to 6-Year Lows” (Oct. 5, 2026). https://energynow.com/2026/10/saudi-arabia-unexpectedly-cuts-november-oil-prices-to-asia-to-6-year-lows/
- Reuters via The Business Times, “Saudi Arabia unexpectedly cuts oil prices to Asia” (Oct. 5, 2026). https://www.businesstimes.com.sg/companies-markets/energy-commodities/saudi-arabia-unexpectedly-cuts-oil-prices-asia
- Dow Jones via MarketScreener, “Saudi Arabia Slashes Crude Prices for Asia as Exports Recover” (~Oct. 4–5, 2026; scout lead, headline/summary only). https://www.marketscreener.com/news/saudi-arabia-slashes-crude-prices-for-asia-as-exports-recover-update-ce785ddbd089f724
- The Saudi Times, April 2026 Arab Light OSP to Asia (+$2.50) (Mar. 2026). https://thesauditimes.net/en/saudi-aramco-raises-april-arab-light-crude-price-for-asian-buyers-as-regional-premiums-surge/
- Reuters via Zawya, “Saudi Arabia cuts Arab Light June OSP for Asia from record levels” (May 5, 2026; May +$19.50, June +$15.50). https://www.zawya.com/en/business/energy/saudi-arabia-cuts-arab-light-june-osp-for-asia-from-record-levels-mwfnwg55
- Investing.com analysis, Saudi July OSP (+$9.50) (June 2026). https://www.investing.com/analysis/saudi-arabia-slashes-oil-prices-again-as-asian-demand-weakens-200681722
- Reuters via EnergyNow, “Saudi Arabia Cuts August Arab Light Asia OSP, Biggest Drop in Over Two Decades” (July 6, 2026). https://energynow.com/2026/07/saudi-arabia-cuts-august-arab-light-asia-osp-biggest-drop-in-over-two-decades/
- Energies Media, September Arab Light OSP −$2.00 (Aug. 2026). https://energiesmedia.com/saudi-aramco-arab-light-price-september/
- Gulfdays/Argaam, “Saudi Aramco sets Arab crude OSP for October” (Sept. 2026). https://gulfdays.net/saudi-aramco-sets-arab-crude-osp-for-october-2/
- Reuters via Zawya, “Iraq’s SOMO offers deeper discounts for October-loading crude, document shows” (Sept. 30, 2026). https://www.zawya.com/en/projects/energy/iraqs-somo-offers-deeper-discounts-for-october-loading-crude-document-shows-1458192
- Shafaq News, “SOMO offers up to $37 discount on Basrah crude” (Sept. 30, 2026). https://shafaq.com/en/Economy/SOMO-offers-up-to-37-discount-on-Basrah-crude
- SNSUC Crude Watch, Iraq October OSPs (Oct. 2, 2026; secondary aggregator). https://www.snsuc.com/en/news/cw-20261002-1
- Reuters via Baird Maritime, Aramco considering ~$9 discount on Oman STS crude (Sept. 28, 2026). https://www.bairdmaritime.com/shipping/tankers/saudi-aramco-considers-discounting-sts-crude-to-reclaim-lost-market-share
- AGBI, “Gulf sellers discount oil to win back buyers” (Oct. 7, 2026; Robin Mills quote). https://www.agbi.com/analysis/oil-and-gas/2026/10/gulf-sellers-discount-oil-to-win-back-buyers/
Physical differentials, delivered prices and the paper market
- CommodityScope, “Physical Markets Weekly” (Oct. 3, 2026; Djeno, Hungo, Suezmax rates). https://commodityscope.com/news/261003
- Reuters via CNBC Africa, “Global physical crude markets mired in discounts as Middle East ramps up supply” (June 24, 2026). https://www.cnbcafrica.com/2026/global-physical-crude-markets-mired-in-discounts-as-middle-east-ramps-up-supply
- Reuters via BOE Report, “Discount on Western Canada Select hits 2023 levels amid soaring global freight costs” (Oct. 5, 2026). https://boereport.com/2026/10/05/discount-on-western-canada-select-hits-2023-levels-amid-soaring-global-freight-costs/
- Reuters via Egypt Oil & Gas, “India’s IOC Purchases 3 mmbbl of Crude for November Delivery” (Oct. 7, 2026). https://www.egyptoil-gas.com/news/indias-ioc-purchases-3-mmbbl-of-crude-for-november-delivery/
- Reuters via Economic Times, “Chinese independent refiners turn to Iraq, Qatar as Iranian crude supplies dwindle” (Oct. 7, 2026). https://economictimes.indiatimes.com/news/international/world-news/chinese-independent-refiners-turn-to-iraq-qatar-as-iranian-crude-supplies-dwindle/articleshow/134753732.cms
- Wood Mackenzie press release, Johan Sverdrup record $24/bbl premium to Brent (Oct. 7, 2026). https://www.woodmac.com/press-releases/saudi-pipeline-disruption-drives-johan-sverdrup-crude-to-record-us$24bbl-brent-premium-lifting-partner-cashflow-forecasts-to-a-potential-us$7.1-billion
- Argus/PR Newswire, first WAF crude trade on Argus Open Markets (Qua Iboe at Dated +$4.10) (Sept. 28, 2026). https://www.prnewswire.com/news-releases/first-waf-crude-trade-initiated-on-argus-open-markets-platform-302891317.html
- Kpler (Homayoun Falakshahi), “Aramco goes full circle: why rising Saudi exports are bearish diffs but not bearish risk” (~Sept. 30–Oct. 1, 2026). https://www.kpler.com/blog/aramco-goes-full-circle-why-rising-saudi-exports-are-bearish-diffs-but-not-bearish-risk
- Flux/Onyx, “Brent falls to $98 as rising Mideast exports weigh on sentiment” (Oct. 6, 2026). https://www.flux.live/reports/brent-falls-to-98-as-rising-mideast-exports-weigh-on-sentiment/
- Business Upturn, Aramco CEO Amin Nasser: physical barrels $20–$50 above Brent (Oct. 5, 2026). https://businessupturn.com/world/saudi-aramco-ceo-says-physical-oil-barrels-trade-20-50-above-brent-why-the-gap-signals-a-much-tighter-market-than-futures-suggest/
- Reuters via ETEnergyworld, “Chevron CEO warns oil supply buffers thinning as physical crude prices near $150” (Oct. 6, 2026). https://energy.economictimes.indiatimes.com/news/oil-and-gas/chevron-ceo-warns-oil-supply-buffers-thinning-as-physical-crude-prices-near-150/134736760
- Reuters via EnergyNow, Chevron CEO on thinning supply buffers (Oct. 6, 2026; HTTP 403 to ENB, read via ETEnergyworld). https://energynow.com/2026/10/thinning-supplies-oil-fuel-supply-buffers-are-thinning-as-middle-east-conflict-continues-chevron-ceo-says/
- U.S. EIA, Europe Brent Spot Price FOB (RBRTE), daily. https://www.eia.gov/dnav/pet/hist/LeafHandler.ashx?n=PET&s=RBRTE&f=D
- ICE Brent futures front month (BZ=F) via Yahoo Finance, daily settlements. https://finance.yahoo.com/quote/BZ%3DF/history/
- Bloomberg, “West Africa Oil Trades at Record Discount as Freight Costs Surge” (Oct. 7, 2026; paywalled, headline only, URL unverified). https://www.bloomberg.com/news/articles/2026-10-07/west-africa-oil-trades-at-record-discount-as-freight-costs-surge
Freight and insurance
- CNBC, crude tankers, Hormuz and Iran attacks (Oct. 6, 2026; McNally and Meade quotes). https://www.cnbc.com/2026/10/06/crude-oil-tanker-strait-hormuz-iran-attack.html
- TokenPost, “Oil Tanker Rates Hit Record $1.33 Million on Saudi Arabia-China Route” (Oct. 7, 2026). https://www.tokenpost.com/news/investing/27401
- Gulf Insider (citing Lloyd’s List, Baltic Exchange), “The $1 Million Tanker Was Just The Start” (Oct. 7, 2026). https://www.gulf-insider.com/the-1-million-tanker-was-just-the-start-every/
- Hellenic Shipping News/Baltic Exchange, “VLCC Tanker Market Firming Once More” (~Oct. 2–4, 2026). https://www.hellenicshippingnews.com/vlcc-tanker-market-firming-once-more/
- Anadolu Agency, “Fivefold Hormuz freight surge forces Middle East crude discounts to stay competitive” (Oct. 6, 2026). https://www.aa.com.tr/en/energy/oil/fivefold-hormuz-freight-surge-forces-middle-east-crude-discounts-to-stay-competitive/60077
- The Business Standard, “Hormuz crisis drives tanker crew pay, freight and insurance costs higher” (Oct. 7, 2026). https://www.tbsnews.net/worldbiz/middle-east/hormuz-crisis-drives-tanker-crew-pay-freight-and-insurance-costs-higher-1564971
- Energy News Beat, “$1.3 Million a Day: When Freight Forces Paper Oil to Meet the Physical Barrel” (Oct. 4, 2026). https://energynewsbeat.co/crude-oil/1-3-million-a-day-when-freight-forces-paper-oil-to-meet-the-physical-barrel/
- Energy News Beat, Iran’s tanker attacks keep pump prices high (Oct. 6, 2026). https://energynewsbeat.com/crude-oil/irans-tanker-attacks-keep-pump-prices-high-even-as-gulf-oil-exports-rebound/
Demand
- IEA, Oil Market Report, September 2026 (Sept. 11, 2026). https://www.iea.org/reports/oil-market-report-september-2026
- U.S. EIA, Short-Term Energy Outlook, October 2026 (Oct. 6, 2026) and September 2026 archive. https://www.eia.gov/outlooks/steo/
- U.S. EIA press release on the October STEO (Oct. 6, 2026). https://www.eia.gov/pressroom/releases/press593.php
- U.S. EIA, Weekly product supplied (WGFUPUS2, WDIUPUS2, WKJUPUS2, WRPUPUS2), through Oct. 2, 2026. https://www.eia.gov/dnav/pet/pet_cons_wpsup_k_w.htm
- OilPrice.com, “Analysts Cut China’s Q4 Crude Import Forecasts by 400,000 Bpd” (Sept. 30, 2026). https://oilprice.com/Latest-Energy-News/World-News/Analysts-Cut-Chinas-Q4-Crude-Import-Forecasts-by-400000-Bpd.html
- Breakwave Advisors, Bi-Weekly Tanker Report (Oct. 6, 2026). https://www.breakwaveadvisors.com/insights/10626wetreport2026llk784
- American Trucking Associations, “ATA Truck Tonnage Index Fell 0.5% in August” (Sept. 2026). https://www.trucking.org/news-insights/ata-truck-tonnage-index-fell-05-august
- Cass Information Systems, Cass Transportation Indexes, August 2026. https://www.cassinfo.com/freight-audit-payment/cass-transportation-indexes/august-2026
Consumers and investors
- AAA national averages (Oct. 7, 2026). https://gasprices.aaa.com/
- University of Michigan Surveys of Consumers, final September 2026. https://www.sca.isr.umich.edu/
- The Conference Board via PR Newswire, “U.S. Consumer Confidence Fell in September” (Sept. 29, 2026). https://www.prnewswire.com/news-releases/us-consumer-confidence-fell-in-september-302892867.html
- FOX5 Las Vegas, Nevada Democrats criticize gas, diesel prices (Oct. 6, 2026). https://www.fox5vegas.com/2026/10/06/nevada-democrats-criticize-gas-diesel-prices-under-lombardo-trump-economy/
- Atlanta News First, “Georgia truck drivers say soaring diesel prices forcing layoffs, parked trucks” (Oct. 6, 2026). https://www.atlantanewsfirst.com/2026/10/06/georgia-truck-drivers-say-soaring-diesel-prices-forcing-layoffs-parked-trucks/
- Daily Caller News Foundation via Tennessee Star, “Diesel hits record even as oil prices fall” (Sept. 23, 2026; OOIDA quote). https://tennesseestar.com/news/diesel-hits-record-even-as-oil-prices-fall/dcnf/2026/09/23/
- FRED: S&P 500 (SP500), VIX (VIXCLS), ICE BofA US High Yield OAS (BAMLH0A0HYM2), 10-year Treasury (DGS10). https://fred.stlouisfed.org/series/SP500
Federal Reserve, U.S. recession indicators and forecasts
- Federal Reserve, FOMC statement (Sept. 16, 2026). https://www.federalreserve.gov/newsevents/pressreleases/monetary20260916a.htm
- Federal Reserve, FOMC meeting calendars. https://www.federalreserve.gov/monetarypolicy/fomccalendars.htm
- FRED, federal funds target range upper limit (DFEDTARU). https://fred.stlouisfed.org/series/DFEDTARU
- CNBC, September 2026 jobs report (Oct. 2, 2026). https://www.cnbc.com/2026/10/02/jobs-report-september-2026.html
- Federal Reserve Bank of Atlanta, GDPNow (updated Oct. 6, 2026). https://www.atlantafed.org/cqer/research/gdpnow
- EnergyReader, “Goldman Cuts 12-Month Recession Odds to 15%…” (Sept. 15, 2026). https://www.energyreader.io/brief/12498
- J.P. Morgan Global Research, 2026 market outlook (Dec. 9, 2025). https://www.jpmorgan.com/insights/global-research/outlook/market-outlook
- New York Fed, yield curve as a leading indicator (FAQ) and allmonth.xls data. https://www.newyorkfed.org/research/capital_markets/ycfaq
- New York Fed, allmonth.xls (downloaded Oct. 7, 2026). https://www.newyorkfed.org/medialibrary/media/research/capital_markets/allmonth.xls
- Polymarket, “US recession by end of 2026?” (public API read Oct. 7, 2026, ~12:36 p.m. CT). https://polymarket.com/event/us-recession-by-end-of-2026
- Kalshi, KXRECSSNBER-26 (public API read Oct. 7, 2026). https://kalshi.com/markets/kxrecssnber
- FRED: SAHMREALTIME, T10Y3M, T10Y2Y, UNRATE, PAYEMS, RECPROUSM156N, T5YIE. https://fred.stlouisfed.org/series/SAHMREALTIME
History and economics
- Hamilton, J.D. (1983), “Oil and the Macroeconomy since World War II,” Journal of Political Economy 91(2). https://www.journals.uchicago.edu/doi/10.1086/261140
- Hamilton, J.D. (2011), “Historical Oil Shocks,” NBER Working Paper 16790. https://www.nber.org/papers/w16790
- Kilian, L. (2009), “Not All Oil Price Shocks Are Alike,” American Economic Review 99(3). https://www.aeaweb.org/articles?id=10.1257/aer.99.3.1053
- Bernanke, Gertler & Watson (1997), “Systematic Monetary Policy and the Effects of Oil Price Shocks,” Brookings Papers on Economic Activity. https://www.brookings.edu/articles/systematic-monetary-policy-and-the-effects-of-oil-price-shocks/
- NBER, U.S. business cycle dating. https://www.nber.org/research/business-cycle-dating
- FRED: WTISPLC, CPIAUCSL, USREC. https://fred.stlouisfed.org/series/WTISPLC
Global outlooks
- IMF, World Economic Outlook Update, July 2026 (July 8, 2026), report page. https://www.imf.org/en/publications/weo/issues/2026/07/08/world-economic-outlook-update-july-2026
- IMF, July 2026 WEO Update text and projections table (PDF). https://www.imf.org/-/media/files/publications/weo/2026/update/july/english/text.pdf
- IMF, opening remarks at the July 2026 WEO press conference. https://www.imf.org/en/news/articles/2026/07/08/sp070826-weo-update-july-2026-press-conference-opening-remarks
- OECD, Interim Economic Outlook press release (Sept. 23, 2026). https://www.oecd.org/en/about/news/press-releases/2026/09/global-growth-holds-up-despite-successive-shocks-but-risks-persist.html
- World Bank, Global Economic Prospects press release (June 11, 2026). https://www.worldbank.org/en/news/press-release/2026/06/11/global-economic-prospects-june-2026-press-release
Access notes: The WSJ article cited in the reader’s briefing (Oct. 5) is paywalled and was not read; the Saudi figures were verified against Reuters copies. Reuters.com returned HTTP 401/403 and was read via syndication (EnergyNow, Zawya, BOE Report, Economic Times, Egypt Oil & Gas, Baird Maritime, CNBC Africa, Business Times). EnergyNow returned 403 for some pages. Bloomberg, Platts, Argus assessments, Baltic Exchange data and the Lloyd’s List original are subscription products; only public reports of their numbers were used. The IMF data XLSX returned “Access Denied”; IMF figures come from the July update PDF table.
Appendix B. Key figures
| Item | Figure | Source |
| Arab Light OSP to Asia, Nov. loading | −$5.00 vs Oman/Dubai (cut $3 from −$2.00); widest since June 2020 | Reuters via EnergyNow, Oct. 5 |
| Arab Light OSP to Asia, May loading (record) | +$19.50 vs Oman/Dubai | Reuters via Zawya, May 5 |
| Arab Medium / Heavy, Nov. | −$6.00 / −$7.35 (each cut $5) | Reuters via EnergyNow, Oct. 5 |
| Arab Light to NW Europe, Nov. | raised $3 across all grades | Reuters via EnergyNow, Oct. 5 |
| Iraq SOMO Oct. term FOB discounts | Basrah Medium −$34.50; Heavy −$37.00 vs destination benchmarks | Reuters via Zawya, Sept. 30 |
| Iraq official Oct. OSP to Asia | Basrah Medium parity; Heavy −$3.30 vs Oman/Dubai | SNSUC, Oct. 2 |
| Aramco Oman STS discount under discussion | ~$9/bbl off OSP (after premiums of $10–$20) | Reuters via Baird Maritime, Sept. 28 |
| Djeno / Hungo FOB offers | ~−$15.35 / ~−$9.90 vs Dated Brent (Oct. 2) | CommodityScope, Oct. 3 |
| Djeno Platts record (June) | −$10.845 vs Dated (records back to 2013) | Reuters via CNBC Africa, June 24 |
| WCS Hardisty, Nov. | −$24.80 vs WTI; widest since Nov. 2023 | Reuters via BOE Report, Oct. 5 |
| Nemba / Murban / Basrah Medium delivered India | Dated +$18 / +$13–14 / ~flat | Reuters via Egypt Oil & Gas, Oct. 7 |
| Iraqi/Qatari to Chinese teapots, delivered | +$12 to ~+$20 vs ICE Brent | Reuters via Economic Times, Oct. 7 |
| Johan Sverdrup | record +$24/bbl vs Brent; medium sour >$140 in Europe | Wood Mackenzie, Oct. 7 |
| EIA Brent spot vs ICE front month, Oct. 6 | $125.44 vs $100.58 (gap $24.86); Sept. avg gap $12.36 | EIA; ICE via Yahoo; ENB calc. |
| Brent/Dubai EFS | ~$7.57/bbl, down ~$2 (Oct. 6) | Flux/Onyx, Oct. 6 |
| TD3C VLCC earnings | $1.33M/day record (Oct. 5; also Oct. 7); ~21x a year ago; prior record $1.27M (Sept. 21) | Gulf Insider/Lloyd’s List; TokenPost |
| TD3C per ton | $45.42 (Feb. 27) → $229.76 (end-Sept.) ≈ $6.2 → $31.3/bbl at 7.33 bbl/t | Anadolu/Baltic; ENB conversion |
| War-risk insurance | 6–10% of hull value; up to $20M per VLCC voyage into Gulf | TBS News, Oct. 7 |
| IEA 2026 world demand | −2.5 mb/d (940 kb/d steeper than prior month) | IEA OMR, Sept. 11 |
| EIA world consumption 2026 / 2027 | 102.44 / 104.65 mb/d (Sept. STEO: 102.60 / 104.98) | EIA STEO Oct. & Sept. 2026 |
| Global stock draw, 3Q26 | 1.9 mb/d (EIA estimate) | EIA press release, Oct. 6 |
| China Q4 crude imports (FGE, EA) | 9.2–9.3 mb/d vs 11.6 last year (cut ~400 kb/d) | OilPrice, Sept. 30 |
| AAA national, Oct. 7 | Regular $4.3667; diesel $6.3015 (year ago $3.1214 / $3.6803) | AAA |
| Fed funds target | Raised 25 bp to 3.75%–4.00% on Sept. 16, 2026 (12–0); next meeting Oct. 27–28 | Federal Reserve |
| U.S. payrolls / unemployment, Sept. | +29,000 / 4.2% | CNBC (BLS), Oct. 2 |
| GDPNow, 3Q26 | 3.7% (Oct. 6) | Atlanta Fed |
| UMich sentiment, Sept. final | 48.1; 1-yr inflation exp. 4.6%; long-run 3.4% | University of Michigan |
| Conference Board confidence, Sept. | 81.9 (−6.7); expectations 63.6; 12-mo inflation exp. 6.1% (avg) | Conference Board, Sept. 29 |
Appendix C. Thesis scorecard: are Gulf discounts missing from benchmark futures?
| Claim | What ENB found | Verdict |
| Saudi cut Nov. Arab Light to Asia by $3, widest discount since 2020 | Confirmed. −$5.00 vs Oman/Dubai, a $3 cut; widest since June 2020. Refiners tie it to freight. | For |
| Producers discount because of tanker fees | Confirmed by buyers (Reuters), SOMO language, AGBI/Mills, CommodityScope, Sparta. | For |
| $1M/day to ship a tanker Gulf–China | Confirmed, now higher: TD3C $1.33M/day record. | For |
| West African crude at record discounts | Confirmed at the FOB level (Djeno ~−$15.35 beyond June’s record −$10.845); Bloomberg number not verified. | For |
| Discounts not reflected in Brent/WTI futures | Largely true for outright price. Visible instead in OSPs, grade spreads, Dubai structure, Brent-Dubai EFS (−$2 to $7.57). | For |
| Physical oil is therefore cheaper than futures | Not supported. Delivered physical trades $12–$50 above Brent (Wirth, Nasser, IOC, teapots, Sverdrup, EIA spot). | Against |
| A glut is building that paper hasn’t priced | Mixed. Kpler: “physical market is looser than the paper structure suggests”; Gulf exports near pre-war. But EIA: stocks drew 1.9 mb/d in 3Q; IEA: 507 mb drawn since Feb. | Mixed |
| CIF high, FOB low because of freight | Supported. FOB discounts plus ~$25/bbl freight increase plus insurance ≈ delivered premiums. | Explains both |
| Saudi move is purely about freight | Partly. Dow Jones also cites recovering Mideast exports and competition among producers; Aramco is defending share (Kpler). | Mixed |
Overall: partly supported. The discounts are real and freight-driven, and outright Brent/WTI doesn’t show them. But the delivered (CIF) barrel is far more expensive than futures, so the “missing” discount is captured by freight and insurance, not by refiners or drivers.
Appendix D. Demand-destruction data
D-1. U.S. implied demand, 4-week average to week ending Oct. 2, 2026 (thousand b/d)
| Product | 2026 | Same wk 2025 | 2021–25 avg | 2021–25 range | vs 2025 | vs 5-yr avg |
| Gasoline | 8,776 | 8,802 | 8,822 | 8,338–9,154 | -0.3% | -0.5% |
| Distillate | 3,768 | 3,830 | 3,886 | 3,706–4,139 | -1.6% | -3.0% |
| Jet | 1,739 | 1,640 | 1,622 | 1,496–1,762 | +6.0% | +7.2% |
| Total | 21,050 | 20,896 | 20,491 | 19,963–20,896 | +0.7% | +2.7% |
Source: EIA Weekly Petroleum Status Report; ENB calculation (data/demand_4wk_vs_prior_years.csv). March 1–Oct. 2 average vs same period 2025: gasoline −0.2%, distillate +1.1%, jet −0.1%, total products +1.0%.
D-2. EIA STEO consumption forecasts, October vs. September 2026 vintage (million b/d)
| Series | 2025 (Oct) | 2026 (Oct) | 2026 (Sep) | 2027 (Oct) | 2027 (Sep) |
| World | 104.41 | 102.44 | 102.60 | 104.65 | 104.98 |
| United States | 20.73 | 20.60 | 20.58 | 20.81 | 20.80 |
| China | 16.58 | 16.03 | 16.08 | 16.30 | 16.45 |
| OECD Europe | 13.52 | 13.37 | 13.36 | 13.48 | 13.50 |
| Japan | 3.10 | 2.96 | 2.96 | 2.95 | 2.95 |
| Other non-OECD Asia | 14.95 | 14.79 | 14.82 | 15.56 | 15.56 |
| U.S. motor gasoline | 8.93 | 8.75 | 8.76 | 8.75 | 8.75 |
| U.S. distillate | 3.91 | 3.85 | 3.83 | 3.89 | 3.85 |
| U.S. jet fuel | 1.74 | 1.73 | 1.72 | 1.74 | 1.74 |
Source: EIA STEO tables 3a and 4a (data/STEO_m.xlsx, data/STEO_sep26.xlsx); annual averages computed by ENB.
D-3. Other demand signals
| Indicator | Reading | Source |
| IEA world demand 2026 | −2.5 mb/d; refinery runs 4.2 mb/d lower y/y in August | IEA OMR, Sept. 11 |
| China Q4 crude imports | 9.2–9.3 mb/d (FGE, Energy Aspects) vs 11.6 a year earlier | OilPrice, Sept. 30 |
| Shandong independent refinery runs | ~55% end-Sept. from ~60% at start; losses 250–500 yuan/t | Horizon Insights via Reuters/ET, Oct. 7 |
| ATA truck tonnage, Aug. | 112.7; −0.5% m/m; −1.6% y/y; −4.3% from March peak | ATA |
| Cass shipments, Aug. | +5.6% m/m; +2.1% y/y (first y/y gain since Jan. 2023); expenditures +18.7% y/y | Cass |
| U.S. jet fuel, 4-wk avg | +6.0% vs 2025 (no sign of air-travel demand destruction) | EIA; ENB calc. |
| Global inventories | −1.9 mb/d in 3Q26 (EIA); −507 mb Feb.–Aug. observed (IEA) | EIA; IEA |
Appendix E. U.S. recession indicator dashboard
| Indicator | Latest | Date | Signal | Source |
| Fed funds target range | 3.75%–4.00% (hiked 25 bp) | Sept. 16, 2026 | Tightening into an oil shock | Fed |
| Nonfarm payrolls | +29,000 | Sept. 2026 | Weak | CNBC/BLS |
| Unemployment rate | 4.2% | Sept. 2026 | Edging up | FRED |
| Sahm rule (real time) | 0.00 | Sept. 2026 | No trigger (0.50) | FRED |
| 10y–3m Treasury spread | +1.06 pts | Oct. 6, 2026 | Not inverted | FRED |
| 10y–2y Treasury spread | +0.48 pts | Oct. 6, 2026 | Not inverted | FRED |
| 10-year Treasury yield | 5.31% | Oct. 5, 2026 | High borrowing costs | FRED |
| 5-yr breakeven inflation | 2.37% | Oct. 6, 2026 | Contained | FRED |
| GDPNow, 3Q26 | 3.7% SAAR | Oct. 6, 2026 | Solid growth | Atlanta Fed |
| NY Fed yield-curve model | 13.9% (recession by Aug. 2027) | Aug. 2026 spread | Low | NY Fed |
| Chauvet-Piger smoothed probability | 0.62% | Aug. 2026 | Low | FRED |
| Goldman Sachs 12-month odds | 15% (from 30% in March) | Week of Sept. 7, 2026 | Low–moderate | EnergyReader |
| J.P. Morgan | 35% (U.S. and global, 2026) | Dec. 9, 2025 (stale) | Moderate | J.P. Morgan |
| Polymarket | ~6.5% (recession by end-2026) | Oct. 7, 2026 | Low | Polymarket |
| Kalshi | 3¢ bid / 4¢ ask; last 3¢ (two negative GDP qtrs in 2025–26) | Oct. 7, 2026 | Low | Kalshi |
| HY credit spread (OAS) | 3.03 pts | Oct. 6, 2026 | Calm | FRED |
| VIX | 15.0 | Oct. 6, 2026 | Calm | FRED |
| S&P 500 | 7,819 | Oct. 6, 2026 | Near record | FRED |
| UMich sentiment | 48.1 | Sept. 2026 (final) | Very weak | UMich |
| Conference Board confidence | 81.9; expectations 63.6 | Sept. 2026 | Weak | Conference Board |
Chart A1. Treasury yield-curve spreads since 2019 and the real-time Sahm rule since 2000. Source: FRED.
Appendix F. Historical oil shocks vs. U.S. recessions
| Episode | Trough → peak (WTI, monthly avg) | Rise | Peak in Aug. 2026 $ | NBER recession |
| 1973-74 Arab embargo | Jan 1973 $3.56 → Jan 1974 $10.11 | +184% | $72 | Nov 1973-Mar 1975 |
| 1979-80 Iranian revolution | Jun 1978 $14.85 → Apr 1980 $39.50 | +166% | $163 | Jan 1980-Jul 1980 |
| 1990 Iraq-Kuwait | Jun 1990 $16.87 → Oct 1990 $35.92 | +113% | $90 | Jul 1990-Mar 1991 |
| 2007-08 demand/supply squeeze | Jan 2007 $54.57 → Jun 2008 $133.93 | +145% | $206 | Dec 2007-Jun 2009 |
| 2022 Russia-Ukraine | Aug 2021 $67.73 → Jun 2022 $114.84 | +70% | $130 | None (as of Sep 2026) |
| 2026 Iran war/Hormuz | Dec 2025 $57.97 → May 2026 $102.13 | +76% | $102 | None (as of Sep 2026) |
Sources: FRED WTISPLC (monthly), CPIAUCSL, USREC; ENB calculation (data/oil_shocks_vs_recessions.csv). Windows chosen by ENB around each episode; the 1973–74 figures reflect the posted-price era. The 2026 window runs to September 2026 (Sept. 2026 monthly avg $97.31). Economists’ views: Hamilton (1983) found all but one postwar recession preceded by an oil-price spike, about three quarters earlier, while warning this doesn’t prove causation; Kilian (2009) separates supply shocks from demand-driven spikes; Bernanke, Gertler and Watson (1997) attribute much of the post-shock damage to the Fed’s tightening response.
Appendix G. Global outlook, 2026 real GDP growth (%)
| Region | IMF (July 2026) | OECD (Sept. 2026) | World Bank (June 2026) |
| World | 3.0 | 2.9 | 2.5 |
| United States | 2.3 | 2.2 | — |
| Euro area | 0.9 | 1.0 | — |
| Germany | 0.7 | — | — |
| United Kingdom | 1.0 | — | — |
| Japan | 0.6 | — | — |
| China | 4.6 | 4.5 | — |
| India | 6.4 | — | — |
| Saudi Arabia | 1.7 | — | — |
| Middle East & N. Africa (IMF) / MENAAP (WB) | -0.5 | — | 1.6 |
| Russia | 1.1 | — | — |
| Brazil | 2.4 | — | — |
| Emerging & developing economies | 3.8 | — | 3.6 |
| East Asia & Pacific (WB) | — | — | 4.2 |
| Europe & Central Asia (WB) | — | — | 2.1 |
| Latin America & Caribbean | 2.4 | — | 2.2 |
| South Asia (WB) | — | — | 6.3 |
| Sub-Saharan Africa | 4.3 | — | 4.0 |
Sources: IMF WEO Update table; OECD Interim Outlook press release (only World, U.S., euro area, China published in the release); World Bank GEP. World Bank “developing economies” and IMF “EMDEs” are similar but not identical groupings. World Bank downside scenario: 1.3% global growth. IMF assumed Hormuz reopening from mid-July, which did not fully happen; the IMF October WEO is not yet published.
Appendix H. Data gaps, conflicting figures, corrections and blocked sources
- Reader’s “$3 cut” vs. scout’s “$5 below”: both correct. November Arab Light is −$5.00 vs Oman/Dubai, down $3 from October’s −$2.00.
- “Just raised rates”: The FOMC raised 25 bp to 3.75%–4.00% on Sept. 16, 2026. No correction needed.
- Sparta quote: the scout presented “would not necessarily appear directly in the outright Brent price” as a direct quote. In Anadolu’s story it is a paraphrase of Michael Ryan, and ENB presents it that way. Ryan’s direct quote is the “price some grades out of Asia” line.
- Iraq’s two layers: SOMO’s official October OSP to Asia was parity (Medium) and −$3.30 (Heavy); the $34.50/$37 figures are separate term-buyer FOB discounts. Do not conflate them.
- Middle East export volumes conflict: Breakwave 18.5 mb/d (7 days to Oct. 1), Kpler ≥16.5 mb/d ex-Iran (Sept. 1–28), CommodityScope ~13 mb/d on its basis (Sept. 1–28). Not used as a headline number.
- Bloomberg West Africa “record discount” (Oct. 7): headline confirmed by the scout; body and figure not read. No number cited.
- No November OSPs found yet from Iraq (SOMO), Kuwait (KPC) or ADNOC’s first Dubai-linked Murban differential.
- Freight series: Baltic Exchange data are subscription-only; Chart 4 uses reported points, not a continuous series. Per-barrel freight uses ENB’s 7.33 bbl/t assumption.
- EIA Brent spot ≠ Dated Brent: EIA’s RBRTE is a physical North Sea FOB assessment sourced from Thomson Reuters; Platts Dated Brent (subscription) can differ. The Oct. 2 spike ($135.51) looks like a one-day dislocation and should be read with caution.
- P. Morgan recession odds (35%) date from Dec. 2025; no newer public figure found.
- OECD regional detail beyond the U.S., euro area and China was not in the press release; ENB left those cells blank rather than use unverified figures.
- Chevron/Wirth: EnergyNow page returned 403; quote verified via ETEnergyworld’s Reuters copy.
- Brent futures curve (Dec $100.36, Feb $95.17) reported by Commodity Board was not independently verified and was not used.
- Political framing of consumer quotes: the Las Vegas and Georgia quotes came from party-organized events; ENB notes this in the text.
- Paywalled/blocked: WSJ (Oct. 5 OSP story; not read), Reuters.com (401/403; syndicated copies used), Bloomberg (403), FT, Platts, Argus, Lloyd’s List, QCIntel teasers, IMF XLSX (Access Denied; PDF used), EnergyNow (some 403s).
Appendix I. Methods and data files
Build: prep_data.py → make_charts.py → build_doc.py → LibreOffice headless PDF export. Folder: /workspace/enb-crude-discounts-recession/ (data/, charts/, raw/, render/). Times are U.S. Central (CDT, UTC−5) unless noted.
Chart 1: data/physical_vs_paper_daily.csv from EIA RBRTEd.xls and Yahoo BZ=F (yahoo_bzf_daily.csv). Gap = spot − front-month settle on matching dates.
Chart 2: data/saudi_arab_light_osp_asia_2026.csv (Reuters-reported Aramco pricing statements).
Chart 3: data/grade_differentials_reported.csv. Midpoints used for ranges (Murban $13–14; teapots $12–~$20).
Chart 4: data/vlcc_freight_reported_points.csv; data/freight_per_tonne_points.csv.
Chart 5 & D-1: EIA weekly XLS (WGFUPUS2w, WDIUPUS2w, WKJUPUS2w, WRPUPUS2w) → eia_product_supplied_weekly.csv, eia_product_supplied_4wk.csv, demand_4wk_vs_prior_years.csv. Ranges by ISO week, 2021–2025.
Chart 6: data/mainstreet_vs_wallstreet.csv (FRED UMCSENT + UMich Sept. final 48.1; FRED SP500 monthly mean).
Chart 7 & App. F: data/oil_real_and_recessions_monthly.csv; oil_shocks_vs_recessions.csv. Real = nominal × CPI(Aug 2026)/CPI(month).
Chart 8 & App. E: data/recession_probabilities_by_source.csv; nyfed_yieldcurve_recprob.csv (from nyfed_allmonth.xls); fred_latest_values.csv; raw/poly.json, raw/kalshi.json.
Appendix D-2: STEO_m.xlsx (Oct. 2026) and STEO_sep26.xlsx (archive), tables 3atab/4atab → steo_consumption_annual_vintages.csv.
Appendix G: data/global_outlook_2026.csv.
Wallet math: 15-gal fill-up = AAA regular × 15. Trucker cost = (AAA diesel today − year ago) × $400/week per $1 (OOIDA rule of thumb). Freight per barrel = $/t ÷ 7.33.
Raw pages saved in raw/ (HTML/TXT) for Kpler, Flux, WoodMac, Business Upturn, OilPrice, Economic Times, Breakwave, Zawya, AGBI, CommodityScope, TokenPost, Gulf Insider, Hellenic, FOX5, ANF, Tennessee Star, Conference Board, UMich, CNBC, ATA, Cass, IEA, EnergyReader, J.P. Morgan.