

As the 2026 Iran War continues to ripple through global energy markets—particularly with disruptions tied to the Strait of Hormuz—policymakers, energy producers, and consumers are closely watching the inflationary fallout. A timely new working paper from the Federal Reserve Bank of Dallas provides a rigorous, scenario-based framework for quantifying exactly how oil price shocks from the conflict could affect U.S. inflation. Released in early April 2026 and based on real-time data through March 2026, the study titled “The Impact of the 2026 Iran War on U.S. Inflation: A Scenario Analysis” (Working Paper No. 2609) delivers clear, quantitative projections that energy market participants should not ignore.
Authored by Dallas Fed economists Lutz Kilian, Michael D. Plante, Alexander W. Richter, and Xiaoqing Zhou, the paper combines two powerful modeling approaches: a calibrated nonlinear dynamic stochastic general equilibrium (DSGE) model of the global oil market to forecast quarterly WTI crude prices under different war-related disruption scenarios, and a monthly structural vector autoregression (VAR) model to translate those price paths into impacts on U.S. gasoline prices, headline and core PCE inflation, and household inflation expectations.
The Core Scenario: Strait of Hormuz Closure
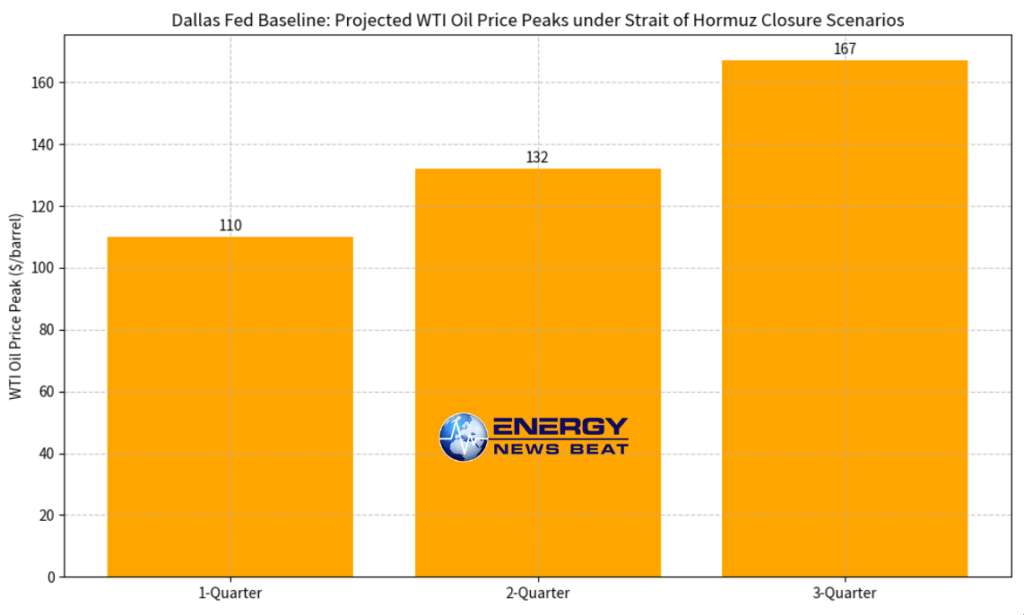
The baseline analysis assumes a complete closure of the Strait of Hormuz—through which roughly 20% of global oil supply flows—lasting for one, two, or three quarters. Key assumptions include no immediate pipeline diversion and full reopening after the specified duration. The DSGE model, calibrated to historical geopolitical shocks like the 1973 Arab-Israeli War, generates these oil price paths:1-quarter closure:
WTI peaks at $110/barrel in April 2026 before declining.
2-quarter closure: Peaks at $132/barrel in July 2026.
3-quarter closure: Peaks at $167/barrel in October 2026.
These are not hypothetical extremes; they reflect the scale of recent market reactions to the conflict.
Inflation Impacts: Headline, Core, and Expectations
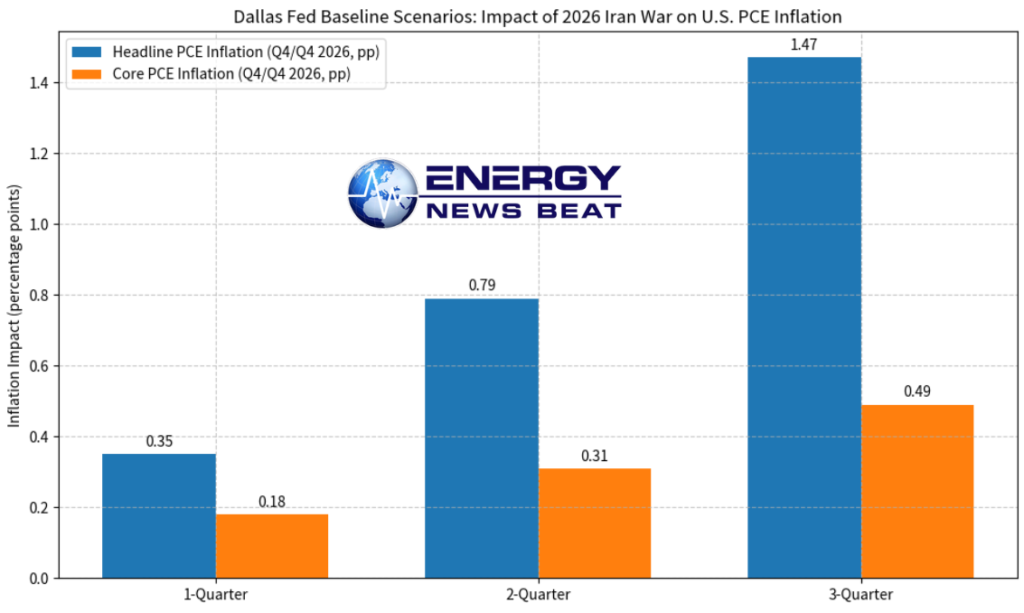
Using the projected oil and gasoline price paths (with crude oil representing about 50% of gasoline production costs), the VAR model—estimated on data from April 1990 through February 2026—simulates the pass-through to inflation. Results are expressed as percentage-point (pp) deviations from a no-war baseline for Q4/Q4 2026:Baseline Scenarios
|
Closure Duration
|
Headline PCE Inflation Impact (Q4/Q4)
|
Core PCE Inflation Impact (Q4/Q4)
|
|---|---|---|
|
1 Quarter
|
+0.35 pp
|
+0.18 pp
|
|
2 Quarters
|
+0.79 pp
|
+0.31 pp
|
|
3 Quarters
|
+1.47 pp
|
+0.49 pp
|
Headline effects peak sharply during the disruption (e.g., +5.2 percentage points annualized in March 2026 for the 1-quarter case) but fade as the strait reopens. Core inflation rises more modestly and persistently.
Alternative scenarios test sensitivity: Greater uncertainty about reopening (Scenario 1) amplifies impacts (headline up to +1.83 pp).
A smaller 15% supply shortfall (Scenario 2) mutes them (headline as low as +0.16 pp).
Longer expected duration (Scenario 3) raises initial peaks but slightly lowers longer-run effects in some cases.
Importantly, inflation expectations remain largely anchored: 1-year-ahead expectations rise modestly (0–0.77 pp peak), while 5- to 10-year expectations show negligible change (0–0.09 pp). The authors emphasize that differences in assumed shortfall size, duration, and uncertainty largely explain why private-sector inflation forecasts have varied so widely since the conflict began.
Broader Context and Real-World Verification
The Dallas Fed analysis aligns closely with observed market moves. Since the escalation in late February/early March 2026, Brent crude has surged above $100–$120/barrel at times, U.S. gasoline prices have climbed above $4/gallon in many regions, and March CPI data already reflected an energy-driven spike.
Independent forecasts from the OECD, Goldman Sachs, and Oxford Economics similarly warn of 0.5–1+ pp added to headline inflation under prolonged disruption scenarios, with risks of mild recessionary pressure if prices average $130–$140/barrel for extended periods.
The paper’s methodology offers a transparent blueprint for real-time crisis analysis—valuable for energy executives, traders, and policymakers navigating the current uncertainty.
What It Means for Energy Markets
For the energy sector, the takeaway is clear: even a temporary Hormuz disruption can deliver a meaningful but ultimately transitory inflation impulse, concentrated in headline readings. Longer or more uncertain closures amplify second-round effects into core inflation and could complicate the Federal Reserve’s path toward its 2% target. Yet the study also underscores resilience—long-term expectations have not unanchored, suggesting markets view the shock as largely supply-driven and reversible.
As the situation in the Middle East evolves, Energy News Beat will continue monitoring oil flows, refinery margins, and downstream impacts. The full Dallas Fed paper provides the detailed figures, robustness checks, and appendices needed for deeper dives.
- Primary Source – Kilian, L., Plante, M.D., Richter, A.W., & Zhou, X. (2026). “The Impact of the 2026 Iran War on U.S. Inflation: A Scenario Analysis.” Federal Reserve Bank of Dallas Working Paper No. 2609.
- News Coverage
- Reuters (April 7, 2026): “Iran war may boost inflation, but not expectations, per Dallas Fed research” – https://www.reuters.com/business/iran-war-may-boost-inflation-not-expectations-per-dallas-fed-research-2026-04-07/
- Forbes, Axios, NYT, and others are confirming the March inflation data and oil price reactions (March–April 2026).
- Additional Context
- Wikipedia summary of economic impacts (updated April 2026).
- OECD and private-sector forecasts referenced in the analysis.
All charts in this article were generated from data tables and figures in Dallas Fed WP2609 for illustrative purposes. The views expressed here are those of Energy News Beat and do not necessarily reflect the Federal Reserve. Stay tuned for updates as new data emerges.