
Even the most optimistic reopening of the Strait of Hormuz won’t deliver a quick fix. Physical barrels tell a far harsher story than paper futures.
Art Berman (@aeberman12) nailed it in his May 25, 2026, post: There is no clean, modelable “successful reopening” of the Strait of Hormuz. Even in the wildly optimistic scenario, the supply crisis likely doesn’t bottom until November — and that’s just restoring flows. Layer on production damage, insurance paralysis, refinery disruptions, depleted inventories, and shattered supply chains, and the timeline stretches further.
This isn’t theoretical. It’s the reality of the largest oil supply disruption in modern history.
The 2026 Strait of Hormuz Shock
Following the escalation of the Iran conflict in late February 2026, Iran effectively closed the Strait of Hormuz — the chokepoint through which ~20% of global oil trade (roughly 20 million barrels per day pre-crisis) normally flows. Net supply losses, after partial offsets via pipelines and other routes, have exceeded 10 million barrels per day at peaks. The International Energy Agency called it the largest supply disruption in the history of the global oil market.
Saudi Arabia and the UAE have rerouted some volumes via pipelines, but capacity is limited. Tankers face war-risk premiums that can make voyages uneconomic or uninsurable. Production has been shut in across the region. Inventories have drawn down sharply. Refineries are scrambling for compatible feedstock.
Paper vs. Physical: The Great Disconnect
This is where Berman’s warning about “real prices, not discounted paper barrels” hits hardest.
Paper barrels (Brent and WTI futures contracts) trade on screens months in advance. They reflect expectations, positioning, and the possibility of eventual resolution. They can roll forward and often lag extreme physical stress.
Physical barrels (Dated Brent assessments for actual near-term cargoes with confirmed loading dates, or spot physical trades) reflect real-world scarcity right now: available oil, insurance, shipping, and specific crude quality.
In April 2026, the gap became historic. Dated Brent (physical) spiked above $140/bbl while front-month Brent futures hovered around $96–100. Premiums of $30–40+ per barrel were reported — levels never seen before in this form.
Here is a chart illustrating the divergence (approximate values synthesized from Platts/Dated Brent assessments, ICE futures, EIA spot data, and contemporary reporting):
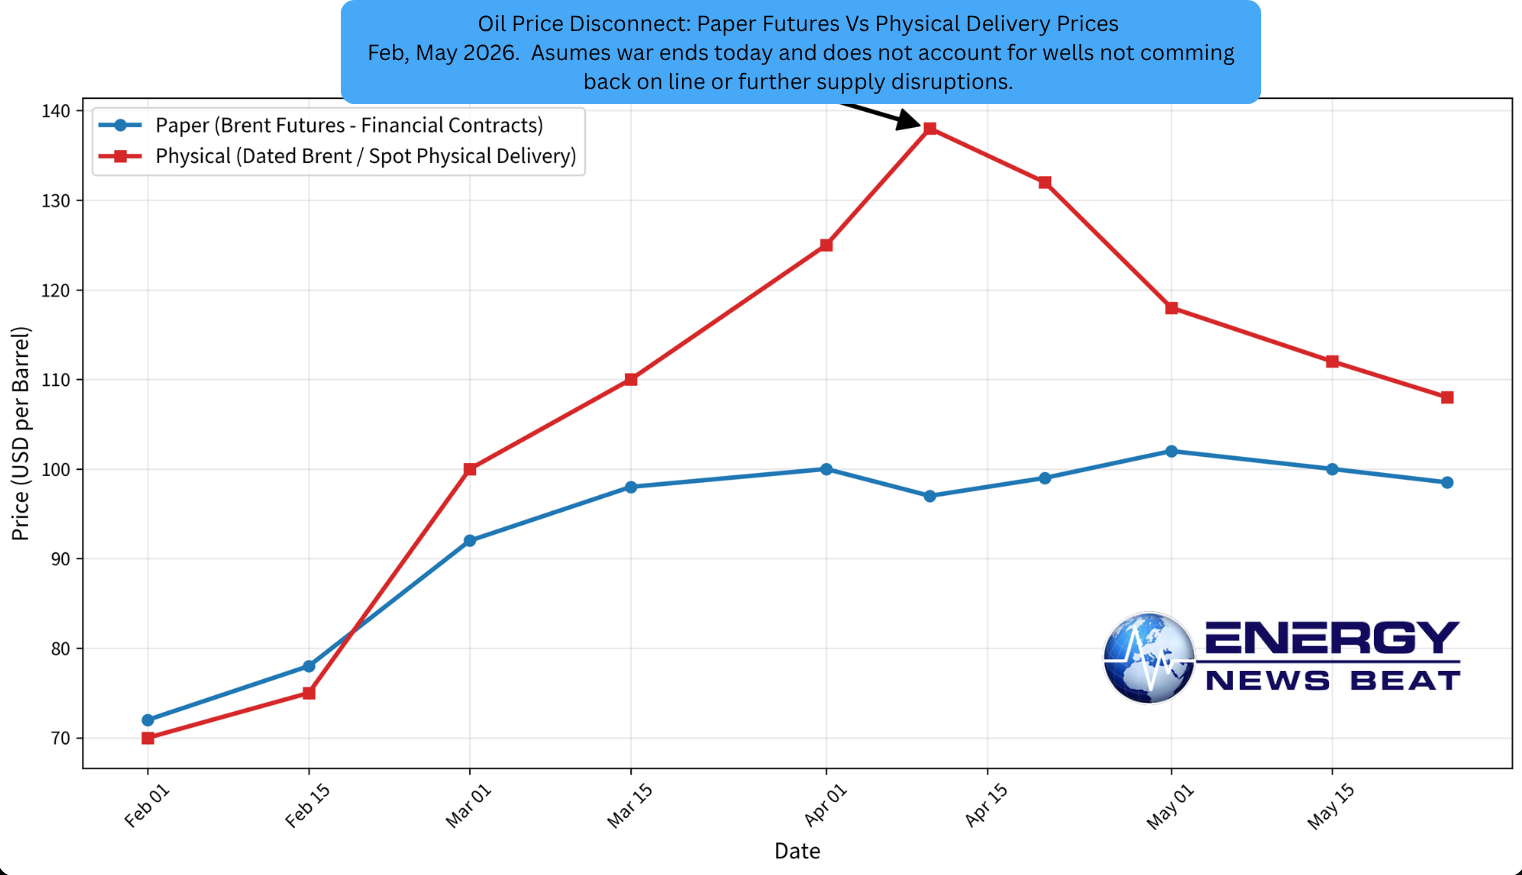
Key takeaway from the graph: The physical market screamed scarcity and stress in March–April. Paper prices, while elevated, masked the true pain for anyone needing actual barrels delivered soon. By late May, futures have eased toward the high $90s–low $100s amid shifting headlines, but the underlying physical tightness and grade mismatches persist.
This disconnect matters enormously. Refiners, airlines, and shippers pay physical prices (or Dated Brent-linked formulas). Futures are for speculators and hedgers rolling contracts.
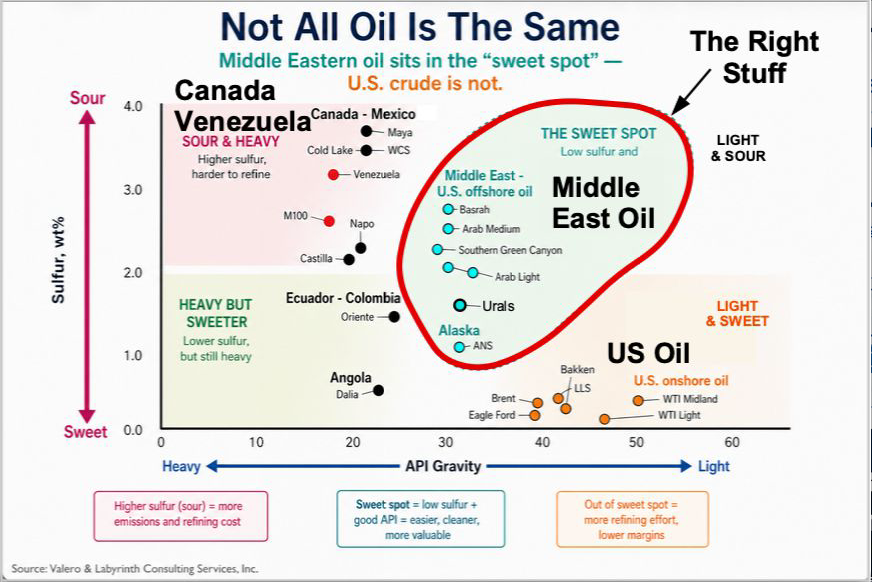
Why Middle East Crudes Are So Hard to Replace
Not all oil is interchangeable. Crude varies dramatically by:
API gravity (light vs. heavy)
Sulfur content (sweet <0.5% vs. sour >1–3%)
Acidity (TAN), metals, and other contaminants
Middle East blends (Arab Light ~33° API / ~1.8% sulfur, Arab Heavy, Iranian Heavy, Basrah, etc.) are typically medium-to-heavy and sour. Decades of investment have configured complex refineries worldwide — especially in Asia (China, India, Japan, Korea, Singapore), Europe, and the US Gulf Coast — specifically for these grades.
These refineries feature high Nelson complexity: cokers, hydrocrackers, and deep conversion units to squeeze maximum distillates (diesel, jet, gasoline) from heavy residuum, plus extensive desulfurization to meet ultra-low sulfur specs.
Switching to alternatives is brutally difficult:
Light sweet crudes (WTI ~41° API / 0.3% S, many US shale grades, some North Sea or Nigerian) produce excess naphtha and light ends. This can flood the gasoline pool while under-utilizing expensive conversion units designed for heavier feed. Product yields shift unfavorably (more gasoline, potentially less diesel/jet depending on configuration). Catalyst and metallurgy compatibility issues arise. Blending helps but only goes so far.
Many Asian refiners are optimized for Middle East sour grades. They cannot simply flip a switch to process large volumes of light sweet without operational changes, yield losses, or reduced utilization.
Reconfiguring a refinery (new units, catalyst changes, major turnarounds) takes months to years and hundreds of millions in capital. It is not a short-term fix.
Even if more US or other non-Middle East oil reaches markets, the grade mismatch creates friction. You can’t just pour light sweet into a refinery built for Arab Heavy and expect the same output or economics. Logistics (pipelines, terminals, tanker parcels) are also often grade-specific or optimized over time.
This is why the supply shock is stickier than simple volume math suggests.
The Longer It Stays Disrupted, the Worse It Gets
Every additional week or month compounds the damage:
Production shut-ins become harder to reverse. Fields need maintenance, reservoir pressure management, and — crucially — confidence that export routes will stay open.
Insurance markets seize up or price in extreme war risk. Some routes become effectively uninsurable.
Inventories deplete further. Rebuilding commercial and strategic stocks takes time even after flows resume.
Refinery and downstream disruptions cascade: specific grade shortages, unplanned maintenance, or uneconomic runs.
Supply chain breakage (tankers repositioned, floating storage builds, port congestion) adds lag.
Economic feedback intensifies: higher prices eventually destroy demand, but the supply side recovers much more slowly.
Berman is right: even a best-case reopening doesn’t instantly normalize the system. Restoring flows is step one. Everything else — production ramp-up, insurance normalization, inventory rebuild, refinery rebalancing — pushes the bottom of the crisis toward November or later in realistic scenarios. We are confirming to get Art on the Energy News Beat Podcast to cover this issue.
Bottom Line
The market has been pricing in hope via paper futures. The physical market has been pricing in reality, and reality is ugly and slow to heal.
This supply shock is not a short-term event that resolves with one headline. It is a multi-month (at minimum) disruption whose full effects on prices, product availability, and the global economy will play out well into the second half of 2026.
Energy News Beat will continue tracking the physical market, grade flows, insurance signals, and refinery runs closely. The paper market can stay optimistic for a while. The real barrels cannot.
- Art Berman (@aeberman12) X post (May 25, 2026): https://x.com/aeberman12/status/2058756300272452021
- Wikipedia: 2026 Iran war fuel crisis — https://en.wikipedia.org/wiki/2026_Iran_war_fuel_crisis
- CSIS: “How to Interpret Wartime Oil Prices” (April 2026) — details paper vs. physical disconnect
- Wall Street Journal: “$133 vs. $99. What Is the Real Price for a Barrel of Oil?” (April 14, 2026)
- Reuters / EIA: Assumptions on Strait closure through late May and supply impacts
- Atlantic Council: “The Strait of Hormuz closure forces a choice: Ration oil now or pay a steep price later” (April 2026)
- Trading Economics / ICE / CME: Current Brent futures curves (as of late May 2026)
- EIA Spot Prices: https://www.eia.gov/dnav/pet/pet_pri_spt_s1_d.htm
- IEA Oil Market Reports and historical commentary on Hormuz
- Industry standard references on crude quality and refinery configuration (API gravity, sulfur, Nelson Complexity Index)
Graph created with approximate synthesized data from Platts/Dated Brent assessments, ICE Brent futures, EIA, and contemporary reporting for illustrative purposes. Actual daily values varied; the scale and timing of the disconnect are well-documented in the cited sources.