


Cato’s Jones Act Waiver Tracker, as of Oct. 30, counted 337 voyages and 90.3 million barrels of gasoline, crude, jet fuel, diesel, propane and more — and called that a floor, not a complete tally. The West Coast, Puerto Rico and New England all used the waiver. Cargo must be loaded by 11:59 p.m. ET Sunday, Nov. 15, or those routes close. As of Tuesday morning, no extension had been announced.
By Energy News Beat | As of November 10, 2026 CST
Sources opened Nov. 10, 2026 CST | Not investment advice
Sunday night, the ships stop loading
Unless the administration extends it, the Jones Act energy-and-fertilizer waiver expires at 11:59 p.m. Eastern Time on Sunday, Nov. 15 (10:59 p.m. CST). U.S. Customs and Border Protection has said any covered product must be loaded onto the ship by that deadline. After that, foreign-flag tankers generally cannot carry those cargoes between U.S. ports. The Department of Homeland Security granted the current extension at the request of the Department of War, under 46 U.S.C. § 501(a). It is not a formal presidential signature on a bill. As of Tuesday morning, Nov. 10, the White House, the Department of War and DHS had not announced a further extension (Center Square, Nov. 9).
What the Cato tracker shows, as of Oct. 30
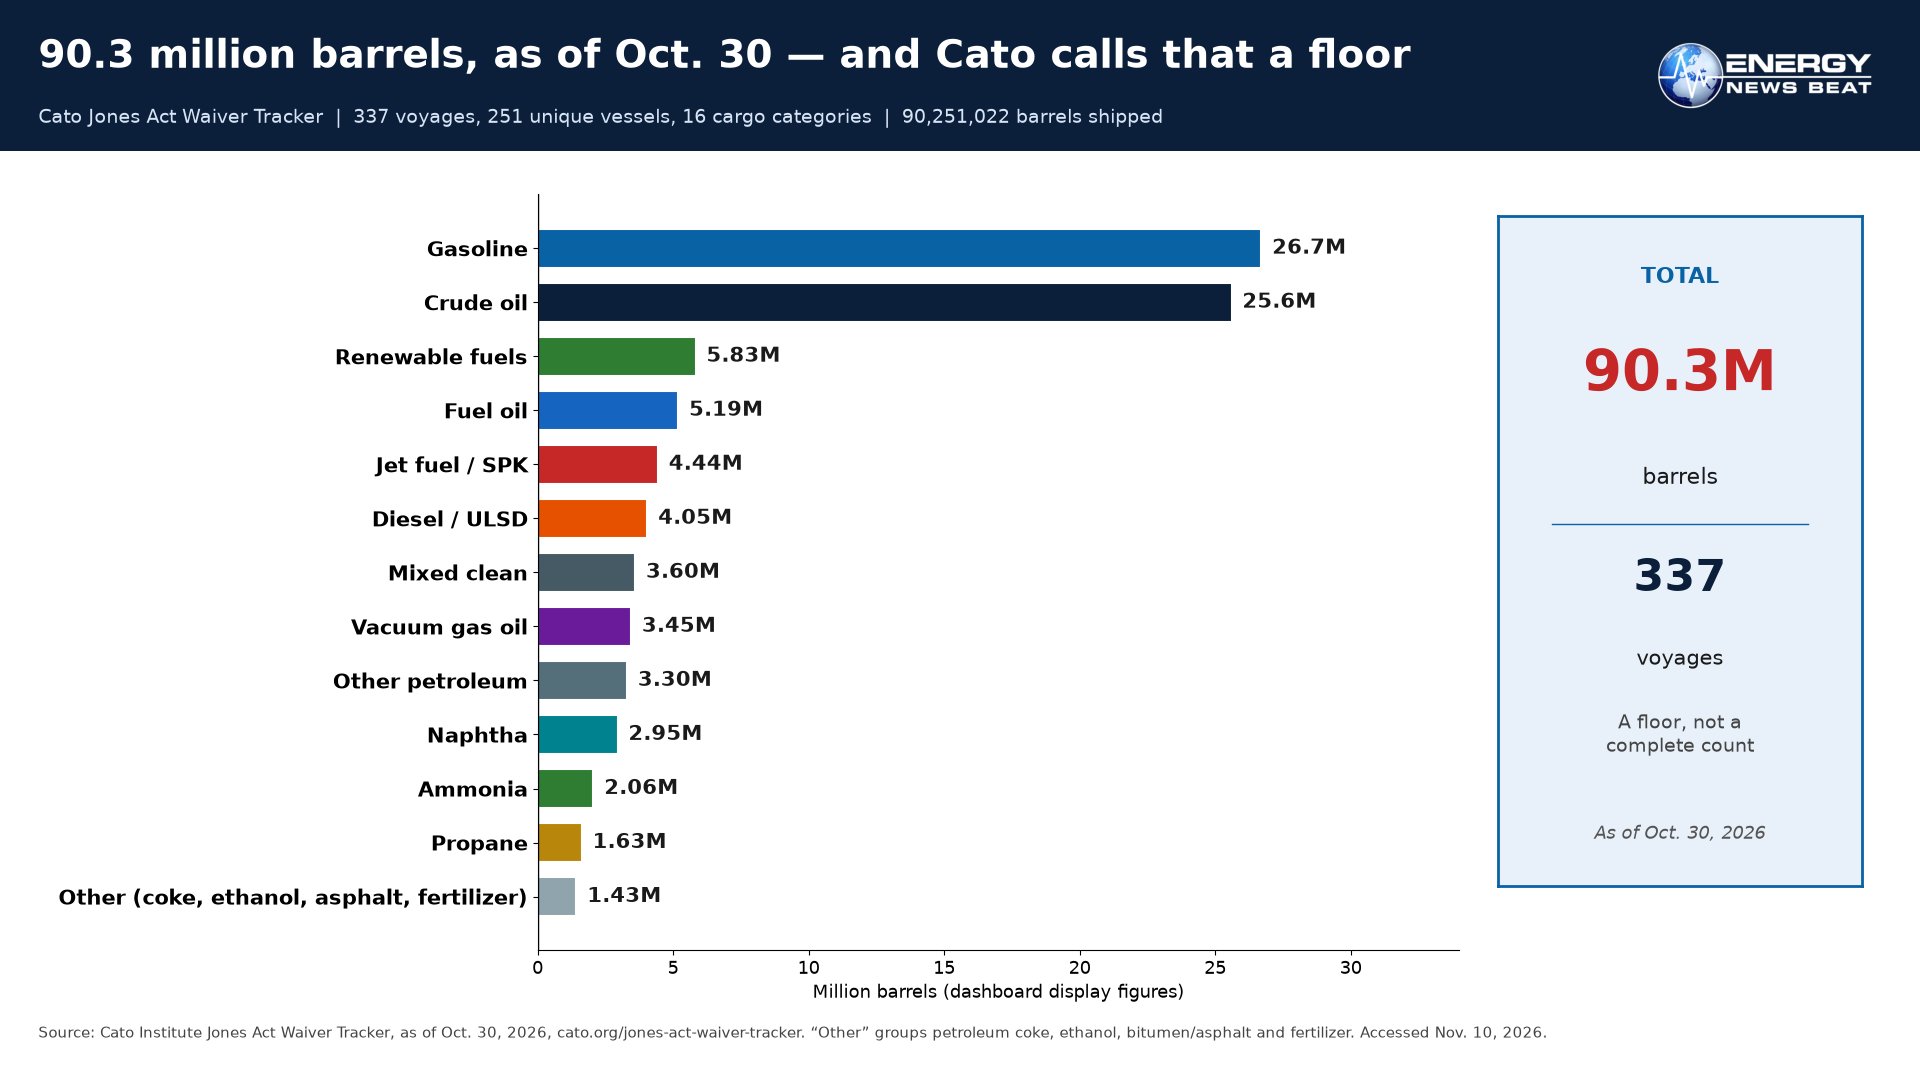
The Cato Institute’s Jones Act Waiver Tracker, built from MARAD voyage reports, showed, as of Oct. 30, 2026, 337 voyages, 251 unique vessels, 82 trips through the Panama Canal, and 90,251,022 barrels in 16 cargo categories. Cato is explicit: the data “is not comprehensive and should be considered a floor for the quantity of cargo moved under the waiver.” Gasoline led the mix, at 98 voyages and 26.7 million barrels. Crude oil was close behind, at 55 voyages and 25.6 million barrels. Propane accounted for nine voyages and 1.63 million barrels. Each voyage is filed under one cargo type, so the category counts add up to the 337 total.
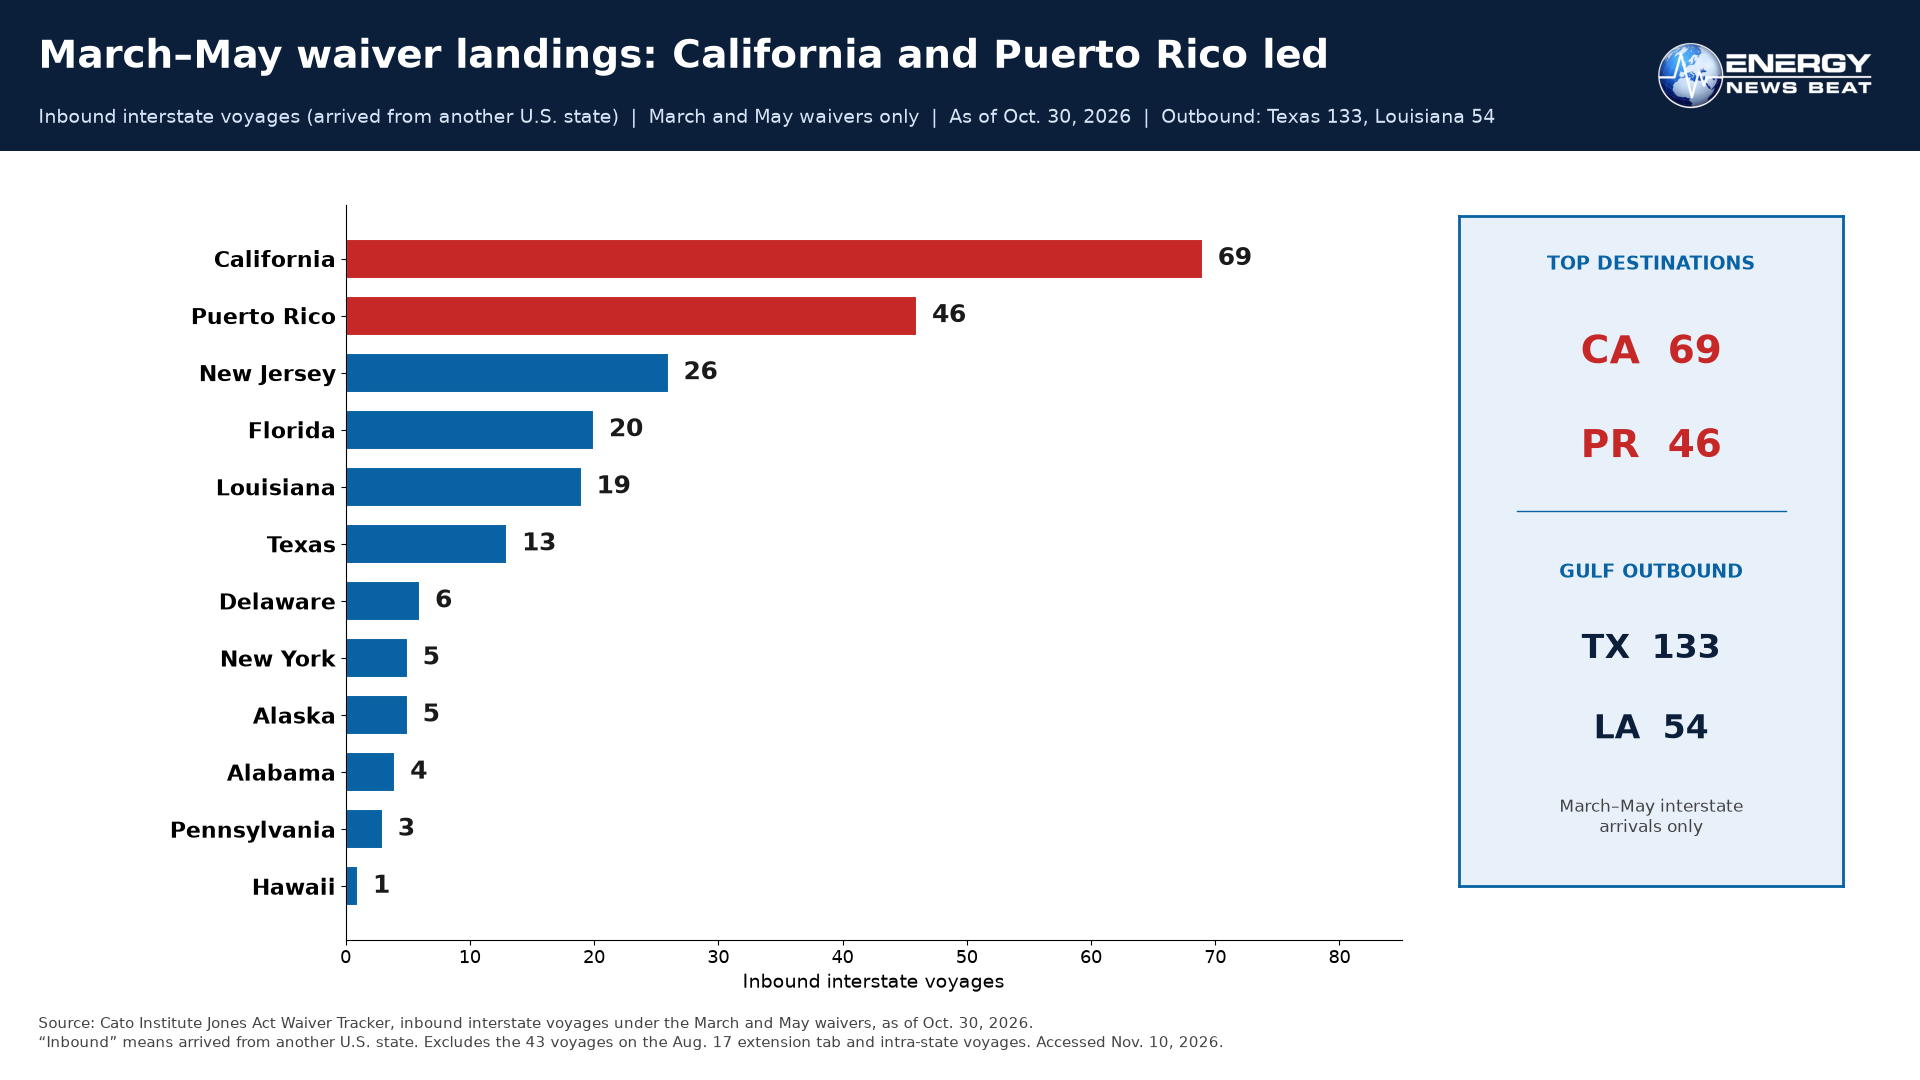
Among voyages arriving from another U.S. state under the March and May waivers — not the 43 voyages under the Aug. 17 extension — California (69) and Puerto Rico (46) led, followed by New Jersey (26), Florida (20), Louisiana (19), Texas (13), Delaware (6), New York (5), Alaska (5) and Alabama (4). Among departures to other states, Texas accounted for 133 and Louisiana for 54.
Cato’s written findings, also summarized by the National Energy & Fuels Institute: In the first 50 days, foreign-flagged tankers moved about 1.59 million barrels of energy products, excluding renewable diesel, Gulf Coast to West Coast, “roughly four times the volume moved by water on that route in all of 2025.” In the first 70 days, “more gasoline and jet fuel were moved from the Gulf Coast to the West Coast than in the entirety of 2020–2025.” Cato said the waiver allowed bulk propane to reach Puerto Rico from the U.S. mainland “for the first time,” and that foreign vessels “supplemented, not replaced, the Jones Act fleet.” With that fleet “fully employed,” each foreign-flag voyage represented demand that would otherwise have gone unmet.
In mid-October, Cato’s Colin Grabow noted the tracker had just recorded its 300th completed voyage and more than 80 million barrels, and found that none of the 56 Jones Act-compliant tankers had been laid up (Grabow, Oct. 15). By the Oct. 30 data, the count had reached 337 voyages and 90.3 million barrels. Grabow’s coast-by-coast totals below are from that mid-October snapshot.
Both coasts, and the islands
In Grabow’s Oct. 15 analysis, 20.7 million barrels moved from other U.S. regions to PADD 5 — the West Coast, Alaska and Hawaii — beating the previous full-year tanker-and-barge record of 16.1 million barrels in 2024. Conventional petroleum products to PADD 5 reached 14.2 million barrels, more than Jones Act vessels delivered from 2008 through 2025, including 2.0 million barrels of finished gasoline and 2.7 million barrels of jet fuel.
Puerto Rico received 10.1 million barrels of petroleum products from the U.S. mainland, including 1.2 million barrels of propane. From April through August, the mainland’s share of Puerto Rico’s propane imports was 78 percent, up from 0.7 percent in all of 2025. Earlier mainland deliveries averaged only about 16,500 barrels a year from 2004 through 2025. No Jones Act oceangoing tanker can carry bulk propane. On the East Coast, 13.3 million barrels of Gulf Coast crude moved to East Coast refineries, and 1.3 million barrels of Gulf Coast petroleum products moved to New England — more than that route carried in 2023 through 2025 combined.
Then the cargoes slowed
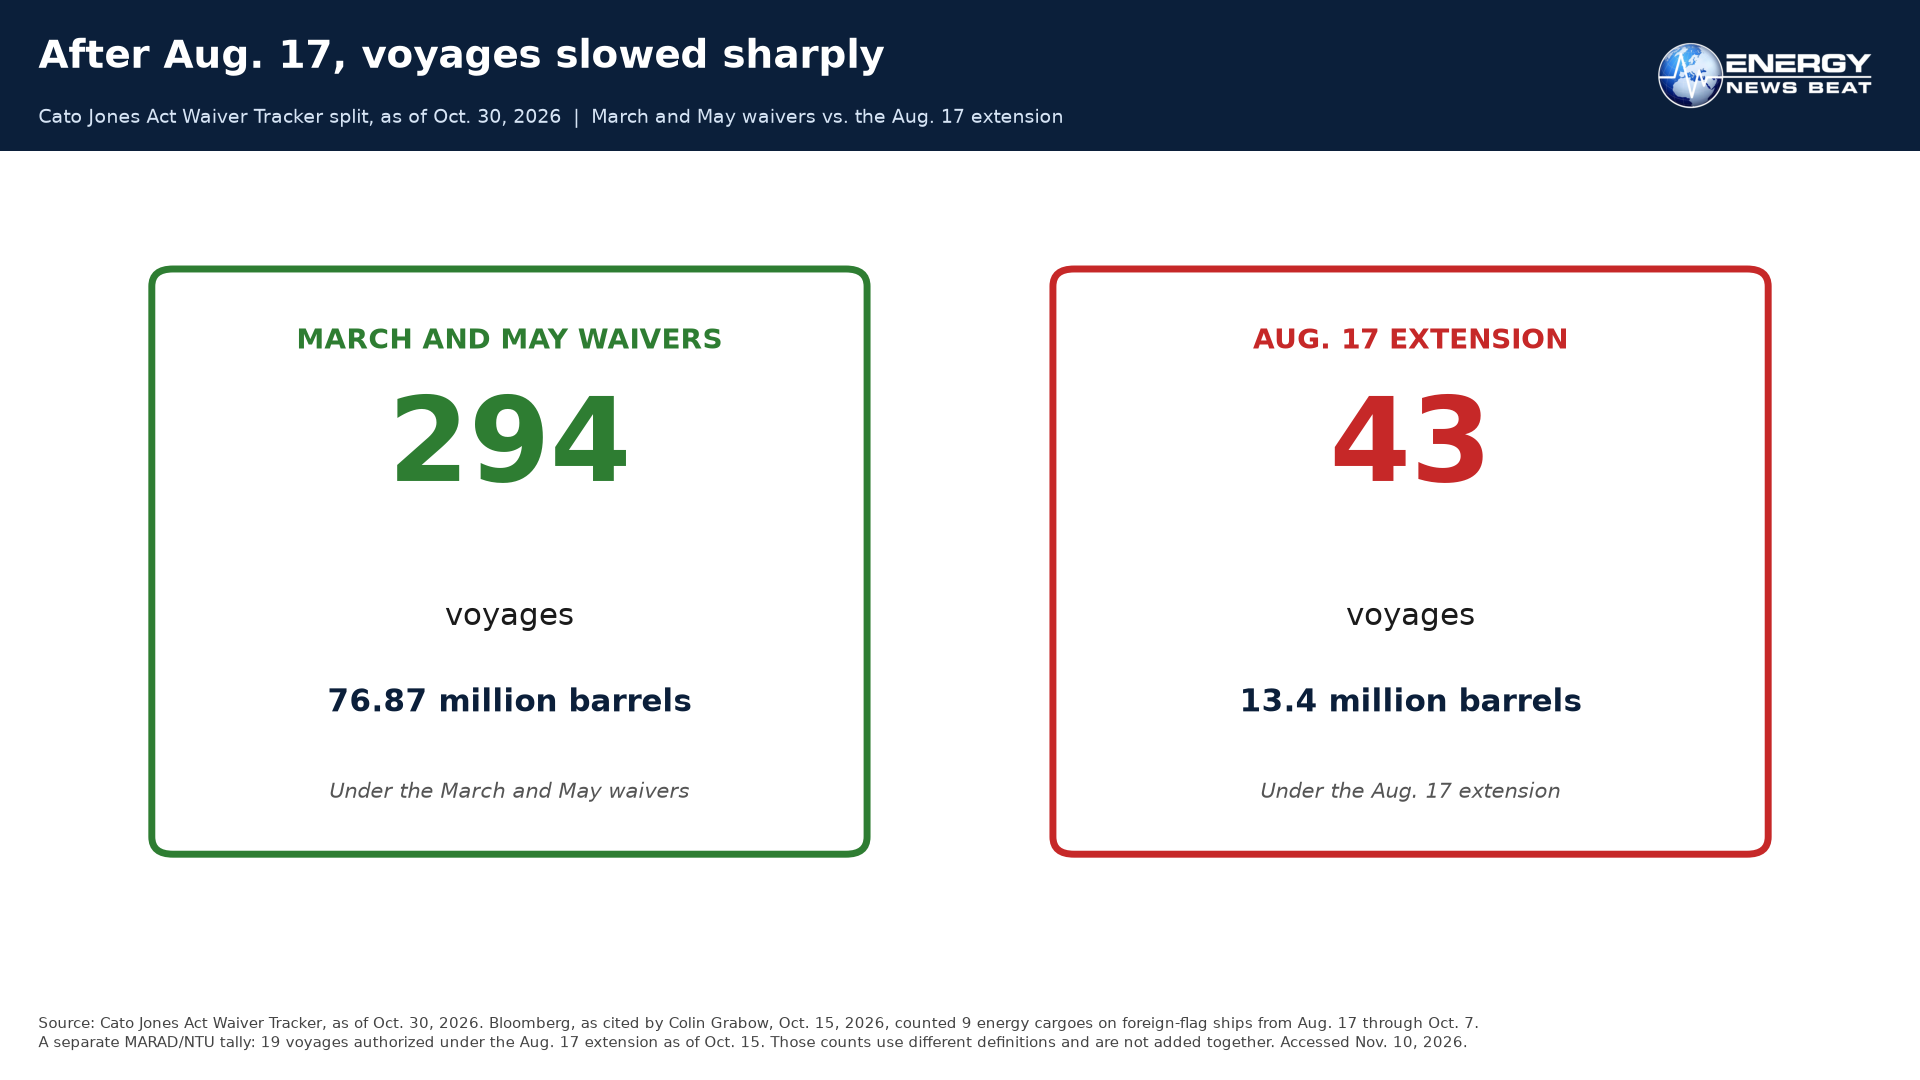
On Aug. 17, the extension added a voyage-by-voyage test. Shippers must file a “VESSEL AVAILABILITY REQUEST,” MARAD surveys coastwise-qualified ships, and the Department of War decides whether a foreign-flag voyage is authorized (CBP CSMS #69519766). Cato’s tracker, as of Oct. 30, shows 294 voyages and 76.87 million barrels under the March and May waivers, against 43 voyages and 13.4 million barrels under the Aug. 17 extension. Bloomberg reported on Oct. 7, as cited by Grabow, Oct. 15, that just nine energy cargoes had moved on foreign-flag ships since Aug. 17, compared with more than 280 voyages in the preceding five months. A National Taxpayers Union coalition letter dated Oct. 22 said 311 voyages were logged under the March and May waivers, per a MARAD report dated Oct. 15, and only 19 were authorized under the stricter August extension. “Authorized” is not the same as completed, and that MARAD tally should not be stacked on the tracker’s 337 or Grabow’s mid-October 300.
Winter is already tight
In the EIA Weekly Petroleum Status Report for the week ended Oct. 30 (next official weekly: Nov. 12), U.S. distillate stocks were 99.3 million barrels, down 11.0 percent from a year earlier. New England held just 2.7 million barrels, down 22.7 percent from a year earlier and 52.7 percent from two years earlier. EIA’s Heating Oil and Propane Update for the week of Nov. 2 put residential heating oil at $6.073 a gallon in New England, $2.525 above a year earlier. On Nov. 10, AAA put regular gasoline at $3.9788 a gallon nationally and diesel at $6.1572. California was still at $5.7108 for regular and $8.1150 for diesel (AAA state averages). NEFI urged an extension on Oct. 26.
What this did — and did not — do for prices
We looked for a proven cut in the retail pump price caused by the waiver. We did not find one, so we will not invent one. The American Action Forum, in a Sept. 2 analysis, estimated $99.9 million to $110.1 million in maritime freight-cost savings over March–November, including about 6.6 cents per gallon on Gulf-to-West-Coast movements (from Argus) and about 1.5 to 2.0 cents per gallon on Gulf-to-East-Coast gasoline, jet fuel and diesel. Those are freight estimates, not measured pump-price cuts. AAF scaled 160-day volumes across eight months and assumed “steady monthly shipment volumes,” a weak assumption after Aug. 17, and wrote that the waiver had had “minimal impact on U.S. gasoline prices” because the Iran / Strait of Hormuz shock dominated the pump.
In a Nov. 3 letter from President Jennifer Carpenter, the American Maritime Partnership, which wants the waiver to lapse, said “published analyses have found no demonstrated retail benefit” and estimated the maximum gasoline effect at “less than one-half cent per gallon.” The letter does not name the underlying study. The fair line is this: the waiver moved American fuel at a lower freight cost and opened routes — bulk propane to Puerto Rico and Hawaii, finished gasoline and jet fuel to the West Coast — that the domestic tanker fleet could not serve on its own. It has not been shown to cut the national average pump price in a measurable way. The consumer benefit is access and regional supply, not “your gas fell X cents because of the waiver.”
The case for letting it lapse
AMP has asked President Trump to let the waiver expire on Nov. 15. It says industry participants report more than $2.6 billion in delayed new-vessel and shipyard investment and more than $700 million in planned Jones Act dredging-vessel investment deferred — member reports, not an audited study. AMP also says more than 28 percent of reported waiver voyages were “on vessels or companies directly tied to China.” Jonathan Helton, writing in The Hill on Oct. 5, found that just seven of 259 voyages as of Sept. 17, or less than 3 percent, were made by ships owned by a Chinese company (Hawaii Free Press reprint). The two percentages use different definitions. Critics, including maritime labor groups and some lawmakers, question whether a nearly eight-month waiver still meets the statute’s “immediate adverse effect on military operations” test (gCaptain, Nov. 4; Center Square, Nov. 9). AMP says targeted waivers under § 501(b) remain available in a true emergency. They do not erase the volumes that reached California, Puerto Rico and New England, or Grabow’s mid-October finding that the Jones Act tanker fleet stayed fully employed.
Consumer and investor views
For households: If you buy gasoline or jet-linked travel on the West Coast, propane in Puerto Rico or Hawaii, or heating oil in New England, the question is whether American barrels can still reach you by water after Sunday night. Do not expect the national average pump price to move on the waiver alone. For investors: A lapse would tighten those same waterborne routes. An Oct. 5 Bloomberg Government review of 128 vessel-availability requests, cited by Center Square, found Valero led with 29 filings. AMP says industry participants report more than $2.6 billion in delayed vessel and shipyard investment. This is not investment advice.
The clock
Energy and free-market groups want the waiver extended. The NTU letter, signed by Americans for Prosperity, Americans for Tax Reform, the American Energy Alliance and others, called an extension “particularly imperative” ahead of winter. API applauded the August extension as a way to “ensure critical fuels reach the regions that need them most.” Any new extension would likely again be a DHS action at the Department of War’s request. The loading clock is Sunday, Nov. 15, at 11:59 p.m. ET — 10:59 p.m. CST.
Proposed Stu’s Take
| Sunday night at 11:59 p.m. Eastern, the ships stop loading. Cato’s tracker, as of October 30, already counted 337 voyages and more than 90 million barrels of American gasoline, crude, jet fuel, diesel and propane moving between American ports. That is a floor, not a complete count. The West Coast got record volumes. Puerto Rico got mainland propane it almost never saw. New England got Gulf Coast product heading into a winter when heating oil is about $6.07 a gallon and New England’s distillate stocks are down about 23 percent from a year ago. I will not tell you this cut the national pump price. The American Action Forum, which estimated roughly $100 million in freight savings, said the national gasoline effect was minimal. What the waiver did was get American fuel to Americans who needed it, and mid-October Cato research found it did that without parking a Jones Act tanker. Let it lapse now and those routes slam shut just as the heat comes on. Extend it.
[STU: OK or edit] |
Appendix A | Linked source list (accessed Nov. 10, 2026 CST)
- Cato Institute, Jones Act Waiver Tracker (official dashboard). Headline counters, cargo mix and state voyage figures in this article are as of Oct. 30, 2026, as displayed on the live dashboard and in the public data that underlies it. Cato states the data is not comprehensive and should be considered a floor. — https://www.cato.org/jones-act-waiver-tracker
- Observable notebook underlying the Cato tracker (Lao / Cato data visualization), version 2612, updated Nov. 5, 2026. Running counters are cited as of Oct. 30. — https://observablehq.com/d/3a87558830e6537f
- Colin Grabow, The Jones Act Waiver by the Numbers, Cato Institute, Oct. 15, 2026, republished at Smart Investment Today. Source for PADD 5, Puerto Rico, East Coast and New England regional volumes; the 300th completed voyage / 80-million-barrel snapshot; zero of 56 Jones Act tankers laid up; and Bloomberg’s Oct. 7 cargo count. — https://smartinvestmenttoday.com/2026/10/15/the-jones-act-waiver-by-the-numbers/
- Colin Grabow, Introducing the Jones Act Waiver Tracker, Cato Institute, July 13, 2026, republished at Smart Investment Today. — https://smartinvestmenttoday.com/2026/07/13/introducing-the-jones-act-waiver-tracker/
- Colin Grabow, The Jones Act Waiver Has Moved More Energy Than Official Numbers Show, Cato Institute, Sept. 21, 2026, republished Sept. 22 by the Grassroot Institute. Source for the Hawaii Fuel Imports Dashboard propane figure discussed in the appendix. — https://www.grassrootinstitute.org/2026/09/jones-act-waiver-benefiting-hawaii-more-than-official-numbers-show/
- National Energy & Fuels Institute, Cato Tracks Jones Act Waiver Activity, June 24, 2026. Reproduces Cato tracker findings on the first 50 and 70 days, Puerto Rico bulk propane, and foreign vessels supplementing a fully employed Jones Act fleet. — https://nefi.com/news-publications/recent-news/cato-tracks-jones-act-waiver-activity
- U.S. Customs and Border Protection, CSMS #69519766, Updated Guidance #4: Implementation of Jones Act Waiver issued to the Department of War, dated March 17, 2026. Posted Aug. 13, 2026. Confirms the second DHS extension at the Department of War’s request; the Aug. 17, 2026, 12:00 a.m. ET start; the Nov. 15, 2026, 11:59 p.m. ET loading deadline; and the vessel-availability request process. — https://content.govdelivery.com/accounts/USDHSCBP/bulletins/424c996
- U.S. Maritime Administration, Domestic Shipping page (voyage reports under 46 U.S.C. § 501(c)). Page last updated Nov. 4, 2026. Direct file downloads from maritime.dot.gov returned HTTP 403. — https://www.maritime.dot.gov/ports/domestic-shipping/domestic-shipping
- National Taxpayers Union et al., letter to President Trump, Oct. 22, 2026. Cites MARAD 501(c) reports dated Oct. 15, 2026: 311 voyages under the March 17 and May 18 waivers, and 19 authorized under the Aug. 17 extension. — https://www.ntu.org/library/doclib/2026/10/Jones-Act-Waiver-Letter.pdf
- American Action Forum, Shuting Pomerleau, The Jones Act Petroleum Waiver: Assessing Flows and Cost Savings, Sept. 2, 2026. — https://www.americanactionforum.org/insight/the-jones-act-petroleum-waiver-assessing-flows-and-cost-savings/
- American Maritime Partnership, letter from President Jennifer Carpenter to President Trump, Nov. 3, 2026, posted Nov. 4 by the American Journal of Transportation. — https://www.ajot.com/news/letter-from-american-maritime-partnership-president-carpenter-to-president-trump
- gCaptain, Maritime Industry Urges Trump to Let Jones Act Waiver Expire November 15, Nov. 4, 2026. — https://gcaptain.com/maritime-industry-urges-trump-to-let-jones-act-waiver-expire-november-15/
- Jonathan Helton, Grassroot Institute, Data from ongoing Jones Act waiver shatters China fearmongering, originally published in The Hill, Oct. 5, 2026; Hawaii Free Press reprint, Oct. 10, 2026. — https://www.hawaiifreepress.com/Articles-Main/ID/49831/Data-from-ongoing-Jones-Act-waiver-shatters-China-fearmongering
- Alton Wallace, The Center Square, Trump’s Jones Act waiver, regarding shipping, expires Sunday unless extended, published Nov. 9, 2026, 10:53 p.m. ET, via Just the News. — https://justthenews.com/nation/states/center-square/trumps-jones-act-waiver-expire-sunday-unless-extended
- U.S. Energy Information Administration, Weekly Petroleum Status Report, Table 6, week ended Oct. 30, 2026 (latest official weekly as of Nov. 10; next release Nov. 12). — https://www.eia.gov/petroleum/supply/weekly/pdf/table6.pdf
- U.S. Energy Information Administration, Weekly Petroleum Status Report, Table 5, week ended Oct. 30, 2026 (motor gasoline stocks). — https://www.eia.gov/petroleum/supply/weekly/pdf/table5.pdf
- U.S. Energy Information Administration, Heating Oil and Propane Update, week of Nov. 2, 2026. — https://www.eia.gov/petroleum/heatingoilpropane/
- AAA Daily Fuel Gauge Report, national averages as of Nov. 10, 2026. — https://gasprices.aaa.com/
- AAA, State Gas Price Averages, as of Nov. 10, 2026. — https://gasprices.aaa.com/state-gas-price-averages/
- National Energy & Fuels Institute, Statement on Heating Fuel Market Conditions, Oct. 26, 2026. — https://nefi.com/news-publications/recent-news/nefi-statement-on-heating-fuel-market-conditions
- American Petroleum Institute, API Applauds Trump Administration Extension of Jones Act Waivers, Aug. 10, 2026. — https://www.api.org/news-policy-and-issues/news/2026/08/10/api-applauds-trump-administration-extension-of-jones-act-waivers
- American Fuel & Petrochemical Manufacturers, Why Waive the Jones Act? Expanding Access to American Energy Is a Clear Win, May 21, 2026. — https://www.afpm.org/newsroom/news/why-waive-jones-act-expanding-access-american-energy-clear-win
- WorkBoat, Third Jones Act waiver takes effect today. How does it differ?, Aug. 17, 2026 (one source for the 238-code count of the August product list; WorkBoat also gives 660 for the March list). — https://www.workboat.com/what-operators-need-to-know-about-the-latest-jones-act-waiver
- Holland & Knight, DHS Extends Jones Act Waiver Again, August 2026 (one source for the 237-code count). — https://www.hklaw.com/en/insights/publications/2026/08/dhs-extends-jones-act-waiver-again
Appendix B | Key excerpts from primary documents and statements
Cato tracker, data limits (on-page text): “this data is not comprehensive and should be considered a floor for the quantity of cargo moved under the waiver.” (Cato Institute Jones Act Waiver Tracker)
Cato tracker, length of the waiver (on-page text): “On March 17, 2026, the Department of Homeland Security issued the longest and broadest waiver of the Jones Act since at least 1950.” (Cato Institute Jones Act Waiver Tracker)
Cato findings, first 50 days: “In the waiver’s first 50 days, foreign-flagged tankers moved approximately 1.59 million barrels of energy products (excluding renewable diesel) from the Gulf Coast to the West Coast, which is roughly four times the volume moved by water on that route in all of 2025.” (Cato tracker findings, as reproduced by NEFI, June 24, 2026)
Cato findings, first 70 days: “In the waiver’s first 70 days, more gasoline and jet fuel were moved from the Gulf Coast to the West Coast than in the entirety of 2020–2025.” (Cato tracker findings, as reproduced by NEFI, June 24, 2026)
Cato findings, Puerto Rico propane: “allowing bulk propane to reach Puerto Rico from the US mainland for the first time.” (Cato tracker findings, as reproduced by NEFI, June 24, 2026)
Cato findings, fleet: “Foreign vessels have supplemented, not replaced, the Jones Act fleet: With the Jones Act tanker fleet fully employed, each foreign-flagged voyage represents demand that would otherwise have gone unmet.” (Cato tracker findings, as reproduced by NEFI, June 24, 2026)
Grabow, Oct. 15, national snapshot: “Earlier this week, the Cato Institute’s Jones Act Waiver Tracker recorded its 300th completed voyage since the waiver was issued on March 17 for the transportation of energy and fertilizer products. Those voyages carried over 80 million barrels without idling a single Jones Act tanker.” (Grabow, Oct. 15, 2026)
Grabow, Oct. 15, PADD 5: “20.7 million barrels of deliveries have moved from other US regions to PADD 5 (the West Coast, Alaska, and Hawaii) under the waiver.” (Grabow, Oct. 15, 2026)
Grabow, Oct. 15, Puerto Rico propane share: “78 percent was the US mainland’s share of Puerto Rico’s propane imports from April through August, compared with 0.7 percent in all of 2025.” (Grabow, Oct. 15, 2026)
Grabow, Oct. 15, Bloomberg slowdown: “Bloomberg reported on October 7 that just nine energy cargoes had moved on foreign-flagged ships since August 17, compared with more than 280 voyages in the preceding five months.” (Grabow, Oct. 15, 2026)
Grabow, Oct. 15, expiry warning: “When it ends, Americans will lose access to the foreign vessels that have made this commerce possible and face costlier alternatives.” (Grabow, Oct. 15, 2026)
CBP, loading deadline: “any covered product must be loaded onboard the relevant vessel before the deadline expires at 11:59 pm Eastern Time on Sunday, November 15, 2026.” (CBP CSMS #69519766, Aug. 13, 2026)
CBP, who granted the extension: “the Department of Homeland Security (DHS) has approved a second extension of the waiver, dated March 17, 2026, at the request of the Department of War (DOW).” (CBP CSMS #69519766)
AAF, freight savings: “generating an estimated $99.9–$110.1 million in cost savings across the U.S. economy over the March–November waiver period.” (AAF, Pomerleau, Sept. 2, 2026)
AAF, pump prices: “the waiver has had minimal impact on U.S. gasoline prices” (AAF, Pomerleau, Sept. 2, 2026)
AAF, volume-scaling caveat: “Estimated total cost savings (Column 4) are projected across the full 8-month waiver period by scaling observed 160-day shipment volumes. These estimates assume steady monthly shipment volumes for petroleum products.” (AAF, Figure 3 note, Sept. 2, 2026)
AMP, no retail benefit: “Published analyses have found no demonstrated retail benefit from the waiver and estimated the maximum effect on the price of gasoline to be less than one-half cent per gallon.” (Carpenter letter, Nov. 3, 2026)
AMP, who makes money: “It has changed who makes money carrying certain cargoes, but it has not made fuel cheaper for Americans.” (Carpenter letter, Nov. 3, 2026)
AMP, China claim: “More than 28 percent of reported waiver voyages were on vessels or companies directly tied to China, including COSCO vessels linked to alleged intelligence-gathering activity.” (Carpenter letter, Nov. 3, 2026)
Helton, Chinese ownership: “just seven of the voyages completed under the waiver, or less than 3 percent, were made by ships owned by a Chinese company.” (Helton, The Hill, Oct. 5, 2026)
NTU / MARAD, first two waivers: “These waivers launched 311 voyages through October 15.” (NTU letter, Oct. 22, 2026, citing MARAD 501(c) reports)
NTU / MARAD, August extension: “Just 19 voyages have been authorized under this stricter waiver.” (NTU letter, Oct. 22, 2026, citing MARAD 501(c) reports)
Center Square, no decision announced: “The White House, Department of War and Department of Homeland Security have not stated whether the waiver will be extended before it expires Sunday night.” (Center Square / Just the News, Nov. 9, 2026, 10:53 p.m. ET)
Appendix C | Cato tracker cargo and destination tables (as of Oct. 30, 2026)
Headline counters, the cargo-type legend and the March/May routes-by-state table come from the Cato Jones Act Waiver Tracker, as of Oct. 30, 2026, as displayed on the dashboard and in the public spreadsheet that underlies it. Cato states that the data is not comprehensive and should be considered a floor. Each voyage is filed under one cargo type, so the category counts add up to the 337 total. Inbound and outbound interstate voyage-by-state figures are from the March and May waivers tab only; they do not include the 43 voyages on the Aug. 17 extension tab. In that table, inbound means arrived from another U.S. state.
Cargo mix
| Cargo type | Voyages (as displayed) | Barrels (as displayed) |
| Gasoline | 98 | 26.7 million |
| Crude oil | 55 | 25.6 million |
| Renewable fuels | 26 | 5.83 million |
| Fuel oil | 27 | 5.19 million |
| Jet fuel / SPK | 20 | 4.44 million |
| Diesel / ULSD | 27 | 4.05 million |
| Mixed clean products | 14 | 3.6 million |
| Vacuum gas oil | 12 | 3.45 million |
| Other petroleum | 11 | 3.3 million |
| Naphtha | 12 | 2.95 million |
| Ammonia | 12 | 2.06 million |
| Propane | 9 | 1.63 million |
| Petroleum coke | 3 | 518,000 |
| Ethanol | 5 | 470,000 |
| Bitumen / asphalt | 4 | 290,000 |
| Fertilizer | 2 | 156,000 |
| Total (tracker counters) | 337 | 90,251,022 |
Inbound interstate voyages by destination (March and May waivers only)
| Destination | Inbound voyages |
| California | 69 |
| Puerto Rico | 46 |
| New Jersey | 26 |
| Florida | 20 |
| Louisiana | 19 |
| Texas | 13 |
| Delaware | 6 |
| New York | 5 |
| Alaska | 5 |
| Alabama | 4 |
| Pennsylvania | 3 |
| Hawaii | 1 |
Selected outbound interstate voyages (Gulf Coast origins; March and May waivers)
| Origin | Outbound voyages |
| Texas | 133 |
| Louisiana | 54 |
Appendix D | Key data table (as-of dates)
| Metric | Value | As-of / source |
| Tracker voyages | 337 | Cato Jones Act Waiver Tracker, as of Oct. 30, 2026 |
| Unique vessels | 251 | Same |
| Panama Canal transits | 82 | Same |
| Barrels shipped | 90,251,022 in 16 cargo categories | Same; Cato calls this a floor |
| Gasoline (tracker) | 98 voyages, 26.7 million barrels | Same |
| Crude oil (tracker) | 55 voyages, 25.6 million barrels | Same |
| Propane (tracker, all routes) | 9 voyages, 1.63 million barrels | Same |
| Grabow completed-voyage snapshot | 300th voyage; more than 80 million barrels | Grabow, Oct. 15, 2026 (earlier snapshot of the same tracker) |
| Jones Act tankers laid up | Zero of 56 | Grabow, Oct. 15, 2026 (not on the live tracker) |
| PADD 5 from other U.S. regions | 20.7 million barrels | Grabow, Oct. 15, 2026 |
| Prior full-year PADD 5 record | 16.1 million barrels (2024; 98% renewable diesel) | Grabow, Oct. 15, 2026 |
| Puerto Rico from mainland | 10.1 million barrels, including 1.2 million barrels of propane | Grabow, Oct. 15, 2026 |
| Mainland share of PR propane imports | 78% (April–August 2026) vs. 0.7% in 2025 | Grabow, Oct. 15, 2026 |
| Gulf crude to East Coast refineries | 13.3 million barrels | Grabow, Oct. 15, 2026 |
| Gulf products to New England | 1.3 million barrels | Grabow, Oct. 15, 2026 |
| Hawaii propane (MARAD-recorded) | 196,000 barrels | Grabow, Oct. 15, 2026 |
| Cato tracker, March and May waivers | 294 voyages, 76.87 million barrels | Cato tracker, as of Oct. 30, 2026 |
| Cato tracker, Aug. 17 extension | 43 voyages, 13.4 million barrels | Same |
| Voyages before Aug. 17 (Bloomberg) | More than 280 in the preceding five months | Bloomberg, Oct. 7, via Grabow, Oct. 15 |
| Energy cargoes Aug. 17–Oct. 7 (Bloomberg) | 9 on foreign-flag ships | Bloomberg, Oct. 7, via Grabow, Oct. 15 |
| MARAD voyages, March and May waivers | 311 (report dated Oct. 15) | NTU letter, Oct. 22, citing MARAD reports dated Oct. 15 |
| Authorized under Aug. 17 extension | 19 (as of Oct. 15) | Same; authorized, not necessarily completed |
| AAF estimated freight savings | $99.9–$110.1 million, March–November projection | AAF, Sept. 2, 2026; assumes steady monthly volumes |
| AAF on national pump prices | “Minimal impact on U.S. gasoline prices” | AAF, Sept. 2, 2026 |
| AMP on retail benefit | No demonstrated retail benefit; maximum gasoline effect “less than one-half cent per gallon” (letter attributes this to “published analyses,” not named) | Carpenter letter, Nov. 3, 2026 |
| AMP deferred investment | More than $2.6 billion (vessels/shipyards) and more than $700 million (dredging vessels); member reports, not audited | Carpenter letter, Nov. 3, 2026 |
| AMP “tied to China” | More than 28% of reported voyages, vessels or companies | Carpenter letter, Nov. 3, 2026 |
| Helton, Chinese ownership | Seven of 259 voyages as of Sept. 17, less than 3%, ships owned by a Chinese company | Helton, The Hill, Oct. 5, 2026 |
| U.S. distillate stocks | 99.3 million barrels, −11.0% year over year | EIA WPSR Table 6, week ended Oct. 30, 2026 |
| New England distillate stocks | 2.7 million barrels, −22.7% year over year, −52.7% vs. Nov. 1, 2024 | Same |
| New England residential heating oil | $6.073/gallon, +$2.525 year over year | EIA Heating Oil and Propane Update, week of Nov. 2, 2026 |
| U.S. regular gasoline (AAA) | $3.9788/gallon | AAA, Nov. 10, 2026 |
| U.S. diesel (AAA) | $6.1572/gallon | AAA, Nov. 10, 2026 |
| California regular / diesel (AAA) | $5.7108 / $8.1150 | AAA state averages, Nov. 10, 2026 |
| Loading deadline | 11:59 p.m. ET (10:59 p.m. CST), Sunday, Nov. 15, 2026 | CBP CSMS #69519766 |
| Extension announced as of Nov. 10 morning CST? | No public yes/no from the White House, Department of War, or DHS | Center Square, Nov. 9, 10:53 p.m. ET; checked again the morning of Nov. 10 |
Appendix E | Background: the Jones Act and this waiver
The Jones Act. Section 27 of the Merchant Marine Act of 1920, commonly called the Jones Act, generally requires that merchandise transported by water between U.S. points travel on vessels that are U.S.-built, U.S.-owned, U.S.-flagged and mostly U.S.-crewed. The statute is 46 U.S.C. § 55102. A limited national-defense waiver is available under 46 U.S.C. § 501(a) when the Secretary of War considers a waiver necessary in the interest of national defense to address an immediate adverse effect on military operations, and DHS grants it. A separate, more targeted process exists under § 501(b). Owners and operators of foreign-flag vessels used under a § 501(a) waiver, and the requesting party, must file a post-voyage report with the Maritime Administrator within 10 days (§ 501(c)). MARAD posts those reports on its Domestic Shipping page.
How this waiver was issued. DHS issued the original waiver on March 17, 2026, at the Department of War’s request, during oil-market disruptions tied to the conflict with Iran and pressure on the Strait of Hormuz. It was a 60-day waiver covering energy, fertilizer and a long list of related tariff lines. A first extension, beginning May 18, 2026, ran 90 days through Aug. 16. A second extension, beginning at 12:00 a.m. ET on Aug. 17, 2026, runs 90 days and expires at 11:59 p.m. ET on Sunday, Nov. 15, 2026, with cargo required to be loaded by that deadline (CBP CSMS #69519766). The August extension narrowed the product list and added the vessel-availability request and MARAD survey. Center Square has called a lapse on Nov. 15 the end of 243 days and “the longest continuous waiver period in U.S. history.” Cato’s tracker page calls the March 17 action the longest and broadest Jones Act waiver since at least 1950. Those length claims are the outlets’ characterizations.
What a lapse would mean in practice. If the waiver is not extended, foreign-flag vessels generally could not load covered energy and fertilizer cargoes for coastwise U.S. voyages after 11:59 p.m. ET on Nov. 15. Jones Act-qualified vessels could still operate. Grabow has written that Puerto Rico would likely revert to more distant foreign propane, that East Coast refineries could replace some Gulf Coast crude with imports, and that West Coast buyers could sharply reduce purchases of American fuel. AMP argues that essential cargo can still move on U.S. vessels and that § 501(b) remains available for true emergencies. No extension had been announced as of the morning of Nov. 10, 2026, CST.
Appendix F | Methodology and limits
- Lead volume, voyage, vessel, Panama Canal, cargo-category and state figures come from the Cato Institute Jones Act Waiver Tracker, as of Oct. 30, 2026. Counters — 337 voyages, 251 unique vessels, 82 Panama Canal transits, 16 cargo categories and 90,251,022 barrels — and the cargo-type legend were read from Cato’s dashboard data as of that date, including the public spreadsheet that underlies the tracker. Cato’s dashboard labels its totals as of Oct. 30; its underlying data include some extension-period reports filed into early November. Cato states that the data is not comprehensive and should be considered a floor. Inbound and outbound interstate voyage-by-state counts come from the tracker’s routes-by-state table for the March and May waivers only; they do not include the 43 voyages on the Aug. 17 extension tab. In that table, an arrival from another U.S. state is an inbound (interstate) voyage, and a departure to another state is an outbound voyage.
- Two Cato readings and a separate MARAD tally appear in this article and must not be added together. (1) The Cato tracker, as of Oct. 30: 337 voyages and 90,251,022 barrels. (2) Grabow’s Oct. 15 essay, an earlier snapshot of the same tracker: a 300th completed voyage and more than 80 million barrels, plus the regional PADD 5, Puerto Rico, East Coast and New England breakdowns and the finding that none of 56 Jones Act tankers were laid up. (3) MARAD 501(c) reports dated Oct. 15, as cited by the NTU coalition on Oct. 22: 311 voyages under the March and May waivers, and 19 authorized — not necessarily completed — under the Aug. 17 extension. That MARAD count is a separate dataset. Cato has also said some voyages are missing from MARAD data, which is why tracker totals are a floor.
- Each voyage is filed under one cargo type, so the category counts add up to the 337 total. Displayed barrel figures by cargo were rounded on the dashboard (gasoline 26.7 million, and so on); they reconcile to the 90,251,022-barrel total within ordinary rounding. The article uses the tracker’s displayed propane figure of 1.63 million barrels.
- Regional coast and territory totals (PADD 5 20.7 million barrels, Puerto Rico 10.1 million, Gulf crude to the East Coast 13.3 million, Gulf products to New England 1.3 million, Hawaii propane 196,000 barrels in the MARAD-recorded tally) are attributed only to Grabow’s mid-October snapshot, not to the Oct. 30 tracker counters. The tracker does not publish a matching regional barrel split in the counters used here.
- Cato’s tracker lists 43 voyages and 13.4 million barrels under the Aug. 17 extension, against 294 voyages and 76.87 million barrels under the March and May waivers, as of the Oct. 30 snapshot. NTU, citing MARAD, said 19 voyages were authorized under the Aug. 17 extension as of Oct. 15. Bloomberg, as cited by Grabow on Oct. 15, counted nine energy cargoes on foreign-flag ships from Aug. 17 through Oct. 7. Those three post-August counts use different definitions and dates and are not added together. The idle-tanker finding (zero of 56 Jones Act-compliant tankers laid up) is from Grabow, Oct. 15, not a running counter on the dashboard. AAF’s $99.9–$110.1 million figure is an estimated freight-cost savings, not a measured pump-price cut, and is presented with AAF’s own “minimal impact” language and its note that the March–November total scales 160-day volumes under an assumption of steady monthly shipments — an assumption weakened after Aug. 17.
- Cato’s written findings on the first 50 days, the first 70 days, Puerto Rico bulk propane “for the first time,” and foreign vessels having “supplemented, not replaced” a “fully employed” Jones Act fleet are quoted from Cato tracker findings as reproduced by NEFI on June 24, 2026. Those are historical findings from earlier in the waiver, not Oct. 30 running totals. Grabow’s later (Oct. 15) note that mainland propane deliveries to Puerto Rico averaged about 16,500 barrels a year from 2004 through 2025 is included so that “for the first time” is read as the first real bulk trade, not as a claim that literally zero mainland propane ever moved.
- A September Grabow discussion of Hawaii’s Fuel Imports Dashboard, republished by the Grassroot Institute on Sept. 22, 2026, cited 461,429 barrels of mainland propane to Hawaii in 2026 year to date, a higher figure than the 196,000-barrel MARAD-recorded total in the Oct. 15 essay. The article does not choose one number or add them. The 196,000-barrel figure is identified as the MARAD-recorded tally; the dashboard figure may include unreported cargo.
- EIA distillate stocks are from Weekly Petroleum Status Report Table 6 for the week ended Oct. 30, 2026, and exclude the Northeast Home Heating Oil Reserve and New York’s Strategic Fuels Reserve. Year-over-year percentages are EIA’s published percent-change figures, not a re-calculation from rounded stock levels. Heating-oil prices are from EIA’s Heating Oil and Propane Update for the week of Nov. 2, 2026. AAA prices are the Nov. 10, 2026, published national and state averages. No unofficial Platts/S&P survey of later-week stocks is used in the body.
- DHS, not a formal presidential signature, grants the waiver at the Department of War’s request, per CBP CSMS #69519766. The article uses “the administration’s waivers” in ordinary prose and describes the legal mechanism where it matters. The August covered-product list is described in sources as about 237–238 HTS codes because WorkBoat and Holland & Knight/NEFI differ by one; the CBP attachment was not independently tallied here. WorkBoat gives 660 product categories for the March list. Original March coverage is otherwise described only in general terms because published counts differ (Center Square and some Grabow references use 659; other legal writeups have used 671). AAF’s 619 / 228 product-category counts were not used, because they conflict with those sources.
- AMP’s “less than one-half cent” retail estimate is presented as the letter’s attribution to “published analyses.” The underlying study was not identified in sources reviewed for this article. AMP investment figures are labeled as member reports, not an audited study. The 28 percent and “less than 3 percent” China figures are presented with their different definitions and dates (AMP: vessels or companies “tied to China”; Helton: ships owned by a Chinese company, seven of 259 voyages as of Sept. 17). The argument that a nearly eight-month waiver may no longer meet the statutory “immediate adverse effect on military operations” test is attributed to critics, including maritime labor groups and some lawmakers, as reported by gCaptain and Center Square, not to AMP’s Nov. 3 letter.
- No extension announcement was found as of the morning of Nov. 10, 2026, CST, consistent with Center Square’s Nov. 9, 10:53 p.m. ET report. That status can change before Sunday.
- Not investment advice. No forecasts are presented as fact.
