Hybrid, plug-in hybrid, and electric vehicle sales in the Unites States have increased in recent months as sales of non-hybrid internal combustion engine (ICE) vehicles fueled by gasoline or diesel decreased. In the fourth quarter of 2021, hybrid, plug-in hybrid, and electric vehicles collectively accounted for 11% of light-duty vehicle sales in the United States, according to data from Ward’s Intelligence.
Skip to sub-navigation
February 9, 2022
Source: Graph by the U.S. Energy Information Administration, based on data from Ward’s Intelligence
Hybrid, plug-in hybrid, and electric vehicle sales in the Unites States have increased in recent months as sales of non-hybrid internal combustion engine (ICE) vehicles fueled by gasoline or diesel decreased. In the fourth quarter of 2021, hybrid, plug-in hybrid, and electric vehicles collectively accounted for 11% of light-duty vehicle sales in the United States, according to data from Ward’s Intelligence.
Sales of several existing hybrid, plug-in hybrid, and electric models increased in 2021, but a large portion of the sales increase came from new manufacturer offerings across different market segments. Manufacturers increased the number of non-hybrid ICE vehicle models by 49 in 2021, versus an increase of 126 for hybrid and electric vehicle models.
Source: Graph by the U.S. Energy Information Administration, based on data from Ward’s Intelligence
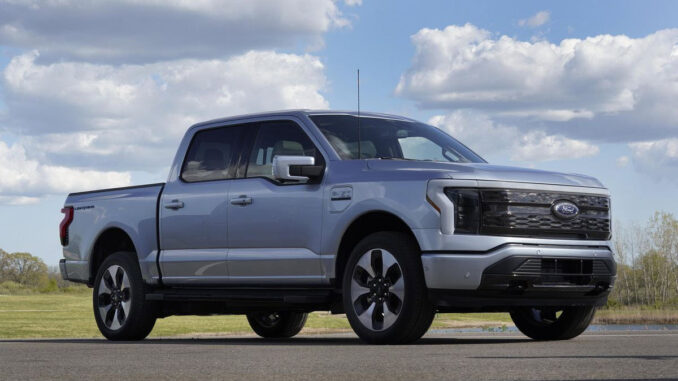
These additional hybrid or electric models were mostly either crossover vehicles, which combine attributes of passenger cars and sport utility vehicles, or vehicles such as vans and pickups, which previously didn’t have many hybrid or electric vehicle options.
Manufacturers of hybrid vehicles and plug-in vehicles have expanded into market segments such as crossovers, vans, and pickups following consumer preference for larger vehicles. Within each electric or hybrid powertrain type, crossover vehicles now account for most sales.
Source: Graph by the U.S. Energy Information Administration, based on data from Ward’s Intelligence
Principal contributor: Michael Dwyer


