The fact that the offshore wind industry is screaming for more subsidies undermines their wilder claims about offshore wind power being ‘free’ and getting cheaper all the time.
The true cost of wind power is staggering – the cost of offshore wind power is astronomical: the latter is more than six times the cost of gas-fired power, which is available around-the-clock, whatever the weather.
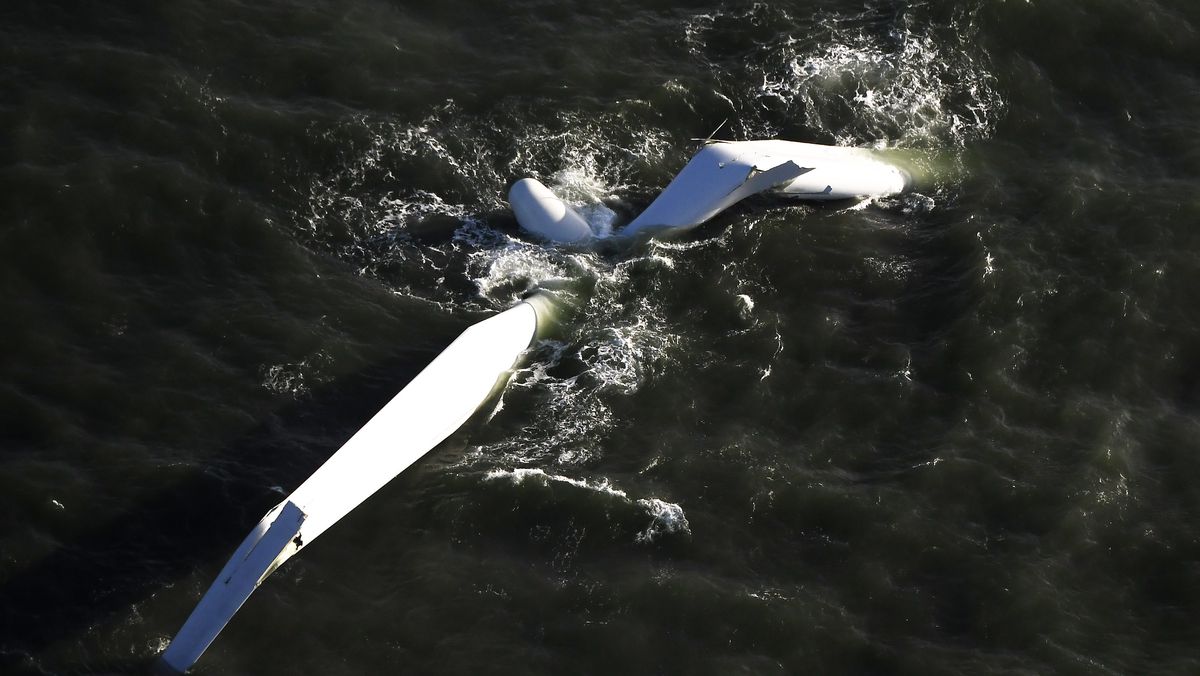
The operating cost of maintaining any industrial machine in a marine environment starts out high and only increases over time, thanks to the corrosive power of saltwater and salt-laden sea air.
Take a machine that, at best, has an economic lifespan of around 12 years and it doesn’t take long before the cost of operating a wind turbine offshore gets out of control.
However, as David Turner reports below, it is not just the rising cost of maintenance that puts paid to the cheap offshore wind power fantasy, it’s the spiralling costs of the raw inputs needed for ever-larger turbines and their erection at sea that means the offshore wind power bubble has truly burst.
Exploding the Cheap Offshore Wind Fantasy
Substack
David Turner
22 February 2023
Summary
The energy industry lobbyists are out with their begging bowls demanding more subsidies to deliver more “investment” in renewables in general and offshore wind in particular. It looks like the developers cannot deliver the wind farms they promised at “record low” strike prices of £37.35/MWh and claims of wind being nine times cheaper than gas were just so much hot air.
The Government’s predictions of decreasing costs of offshore wind were based on continued low commodity prices, the availability of cheap money and unrealistic assumptions about improved operational performance. It’s not looking likely that any of their operational improvement targets will be met.
In addition, the costs of raw materials and energy have gone up dramatically and interest rates have risen sharply pushing up the costs of capital. These factors have had a dramatic effect on the price of offshore wind.
Who would have guessed that a highly mineral intensive and capital intensive source of energy would be very susceptible to commodity and energy price inflation and rising interest rates?
The work of Professor Simon Michaux has shown that the prices of critical minerals are going to continue to rise as demand increases and ore grades for new discoveries fall leading to higher processing costs.
It is beginning to look like the offshore wind power bubble has burst and the fantasy of ever cheaper renewables has come to an end.
Introduction
This week, Energy UK and RenewableUK ran campaigns to lobby the Government for more subsidies for renewables in general and offshore wind in particular. Essentially, Energy UK admits that the bids of £37.35/MWh made during Allocation Round 4 (AR4) in mid-2022 were far too low and now the operators need more money to make their projects viable. This is a far cry from the claims made at the time by Carbon Brief and others that offshore wind power is nine times cheaper than gas.
In earlier articles, we looked at the hidden costs of renewable electricity generation and the pernicious effects expensive electricity has on the overall economy, now this article examines why the claims made in the 2022 auctions were unrealistic and why this is likely to remain the case.
The Government forecast a cost of £100/MWh for new offshore wind farms coming on stream in 2025, in their 2016 energy costs report . Their 2020 report showed the cost falling to £57/MWh for offshore wind farms coming on stream in 2025.
There are many cost drivers that govern the eventual price that needs to be charged for wind power. This article looks at initial capital costs for construction and infrastructure, cost of capital, build time, load factor the expected life of the asset. The actual performance of four wind farms from their published accounts is compared to the Government forecasts and industry publications.
We then take a look at the sensitivity of Government forecasts to changes in these cost factors to explain why Government forecasts and the AR4 bids were unrealistic.
Finally, we take a brief look a the work of Professor Simon Michaux who shows that the prices required to deliver increased supply of key minerals required to deliver wind farms are only going to get more expensive as new discoveries have lower ore grades and are thus more expensive to produce.
Demands from Energy UK and RenewableUK
The results of the Contracts for Difference Round 4 (AR4) auction were announced in July 2022. The winning bids for Offshore wind were set at a strike price of £37.35/MWh at 2012 prices. Now Energy UK says:
“The investment climate has changed dramatically since these contracts were awarded at record low prices. There are now serious concerns that many AR4 projects may not be deliverable at current strike prices.”
They also explain that supply chain and financing costs have risen, raising questions about the deliverability of projects. They also say that developers were relying on the windfall of high electricity prices to justify their projects, by delaying their commitment to Contract for Difference (CfD) prices:
“There are immediate concerns whether CfD Allocation Round 4 (AR4) projects will go ahead. Generators who secured AR4 contracts did so during a period of high prices. As such, many AR4 projects had low strike prices that took account of the ability of generators to factor in a period of merchant exposure before implementing the CfD.”
They also state that the expected prices for AR5 are too low, jeopardizing new projects coming forward. Their solutions are higher prices in the CfD auctions, and tax breaks so renewables providers escape much the Electricity Generation Levy (EGL). In other words, the begging bowl is out for even more subsidies.
RenewableUK used more flowery language to describe the problem and solutions, but also called for higher CfD prices, more tax incentives for renewables and less expensive grid charges. In other words, they demand that others pay for the very long copper cables through hostile terrain that are required to connect up new offshore wind farms. So again, the demand is for ever more subsidies for what is supposed to be a cheap source of energy.
Let’s look at why it has all gone wrong for the offshore wind industry.
Actual Costs of Offshore Wind Farm Electricity
First of all, offshore wind has been far from cheap so far. Modern wind farms receive a subsidy in the form of a CfD contract that guarantees index-linked prices for 15 years.
I have taken an in depth look at four offshore wind farms that provide sufficiently detailed information. Links to the relevant pages at Companies House are provided in the list below.
- Sheringham Shoal operated by Scira Offshore Energy Limited
- Dudgeon
- Beatrice Offshore Windfarm
- East Anglia One
Figure 1 shows the revenue per MWh of electricity generated (£/MWh) for the most recent two financial years. For Beatrice this is the years up to 31 March 2021 and 2022. For the others it is for the two years ending 31 December 2020 and 2021. The horizontal dashed lines show the BEIS forecasts of the Levelised Cost of Energy for Offshore wind farms. The red line shows their estimate (£100/MWh) for new farms coming on stream in 2025, taken from the 2016 report. The 2016 estimate for new capacity in 2020 was £106/MWh. The green line shows the estimated cost for offshore wind farms coming on stream in 2025 (£57/MWh) taken from the 2020 report. In each case, the actual prices achieved are far higher than the estimates for new farms in 2020.
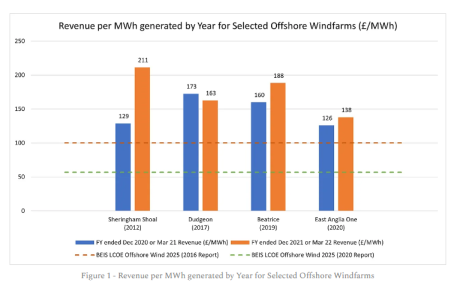
To some extent, this is to be expected because the Government is anticipating improvements in technology to bring costs down in the future. Sheringham Shoal came on stream in September 2012, Dudgeon in February 2017, Beatrice in July 2018 and East Anglia One in July 2020. Looking at Dudgeon, Beatrice and East Anglia One, it does look like there is a general trend downwards in the price of electricity sold for the more recent wind farms. However, East Anglia One that came into operation in 2020, received prices for its electricity 18.8% more expensive than the Government forecast in 2016 for new wind farms in 2020. Moreover, because the CfD contracts are index linked, the prices per MWh rise year on year.
Aficionados of the UK offshore wind sector may ask why Hornsea One and Hornsea Two have not been included in the analysis above. The answer is that these wind farms are operated by Ørsted and their published accounts do not disclose the amount of power generated, so it is not possible to determine their actual performance. Hornsea One was fully commissioned on 28 December 2019 and has a CfD for £140/MWh recorded in its favour, some 32% above the Government’s forecast for 2020. Hornsea 2 began operation at the end of August 2022 and had signed an CfD with a strike price of £57.50/MWh. Similarly, Triton Knoll and Moray East agreed CfDs with strike prices of £74.75/MWh and £57.50/MWh respectively at 2012 prices. However, it has been reported that these farms have not taken up their CfDs and are instead selling power at much higher prices. Of course, these CfDs are index-linked, so by the time they take them up, the strike prices will have risen.
Given that new windfarms coming on stream around 2020 are nowhere near meeting the Government’s forecast for 2020 and lobbyists are already bleating about AR4 agreed prices, it’s not looking good for the 2025 forecasts made in 2020. Let’s dig a bit deeper into the factors that make up the price of offshore wind energy.
Factors Governing Wind Farm Costs
There are a number of factors governing offshore wind farm costs. They include initial capital costs for construction and infrastructure, cost of capital, build time, load factor the expected life of the asset. Between the 2016 and 2020 reports, the Government has made some important changes to its assumptions for wind farms coming on stream in 2025. These are shown in Figure 2.
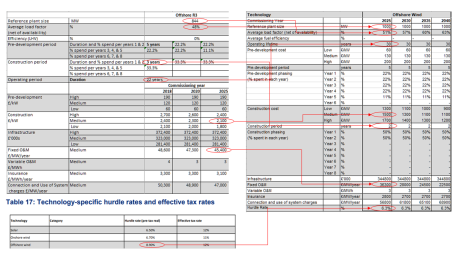
Figure 2 – Changes to Offshore Wind Cost Factors
The reference size has increased from 844MW to 1,000GW. This is probably justified given that windfarms that have come on stream recently have been larger than 1GW. The load factor has increased from 47.67% to 51%. The construction time has been reduced by 33% from three years to two years. The expected lifetime of the wind farm has increased 36% from 22 years to 30 years. Construction costs have fallen 28% from £2,100/kW of capacity to £1,500/kW. The fixed operation and maintenance costs have decreased 20% from £45,400/MW/yr to £36,300/MW/yr and very importantly, the hurdle rate cost of capital has fallen from 8.9% to 6.3%.
Let’s take a look at each of these factors and judge how realistic they are.
Capital Costs
The capital costs for the turbines, installation and infrastructure are a key driver of the price of wind power. Clearly, the higher the costs, the higher electricity prices have to be to recoup those costs. The 2020 Government report assumes that construction costs of wind farms deployed in 2025 will fall 28% compared to what they assumed in their 2016 report. Some of this reduction is driven by the increase in wind turbine size. The larger the turbine, fewer machines are required to deliver the same output. However, each turbine is larger and so contains more materials and requires even larger concrete foundations.
In essence, the construction costs represent the costs of the materials required to manufacture the turbines and secure them on the ocean floor, plus the costs of the energy and labour to transform the raw inputs into the finished article. Figure 3 shows how the prices of key commodities have changed over the past 10 years (all taken from Trading Economics).
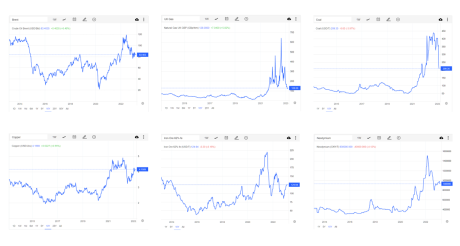
Figure 3 – Changes in Energy and Commodity Prices
The Brent oil price has roughly doubled from ~$40/bbl in 2016 and 2020 to over $80/bbl today. Oil is the feedstock to make the fuel used to extract minerals from the ground and transport materials around. UK gas prices have gone up roughly six-fold from ~20p/therm in 2016 and 2020 to 128p/therm today. Looked at another way, gas prices are still 3 times higher than what might have been regarded as a long-term average of 40p/therm. Coal prices have increased 3-fold from $60-70/t in 2016 and 2020 to $209/t today. Gas and coal are used as fuel to generate the electricity to make steel and concrete and power factories. Iron ore prices have gone up from around $60/tonne in 2016 to over $127/tonne today. Coal and iron ore are the raw materials used to make steel for the turbine towers. Copper prices have roughly doubled from ~$2/lb in 2016 and 2020 to over $4/lb today. Copper is used in the rotors of the turbine generators and in the cables to connect them to the shore. Neodymium prices have more than doubled from ~CNY40K/t to over ~CNY93K/t. Neodymium is a rare earth metal used as a key ingredient in the permanent magnets used in the generators.
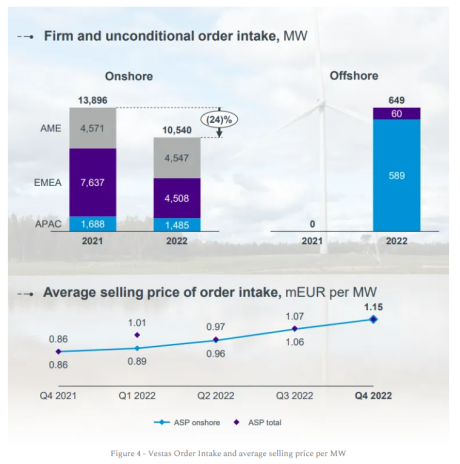
It seems unlikely that the massive increase in commodity costs will have been offset by the economies of scale derived from the larger turbines. This is borne out in the recent investor presentations from Vestas and Siemens Gamesa and of course by the reports from Energy UK and RenewableUK described above.
Vestas is loss-making and its overall order intake is shrinking. Offshore order intake has risen overall, but for Europe was very small at just 60MW, or four of their very large turbines. Figure 4 shows the average selling price of its offshore wind turbines increased 34% from Q4 2021 to Q4 2022.
Siemens is also loss-making and its order intake is also shrinking. Siemens doesn’t disclose the selling price per MW of its offshore turbines, probably because it didn’t sell much in Q1 2023, but its onshore prices increased 25% from Q1 2022 to Q1 2023 and by over 50% since Q1 2020.
The costs of the raw commodities have risen substantially since the Government’s reports were put together, the two main turbine providers are losing money and need to increase prices further to become profitable. It looks highly unlikely that the costs of turbines and installation are going to fall by the predicted 28% between now and 2025 and instead will rise substantially.
Cost of Capital
The cost of capital, or discount rate is a crucial determinant of offshore wind farm costs. The cost of capital is used to discount future cash flows to current values. The higher the discount rate, the lower the current value of future cash flows. The Government changed its hurdle rate assumption for wind farms delivered in 2025 from 8.9% in its 2016 report to 6.3% in its 2020 report.
The hurdle or discount rate required is related to the “risk-free” rate represented by the yield on UK Government gilts. In 2016, the yield on the 10-year gilt was around 1.25% and about 0.35% in 2020. The 30-year gilt yielded around 1.85% and 0.85% respectively in the same two years. Averaging these yields, the 2016 report assumed a 7.35% premium to gilt yields and the 2020 report assumed a 5.7% premium, the average of those two premia is 6.53%.
10-year and 30-year gilts are currently yielding 3.5% and 3.9% respectively. Taking the average of those two figures and applying the 6.53% average premium gives a more realistic hurdle rate for 2025 of 10.23%.
We will look at the dramatic impact this has on the prices of wind electricity in the section on sensitivity.
Build Time
The build time is an important driver of the costs of offshore wind. If it takes longer to build out, the operator has to wait longer before it is generating revenue to repay the money borrowed to build the wind farm. The Government has reduced its assumed construction time by 50% from 3 years to 2 years between the 2016 report and the 2020 report.
The various different wind farms in the comparison shown in Figure 5 below have websites that describe the timeline for construction. The times shown are the time from construction start to full commissioning.
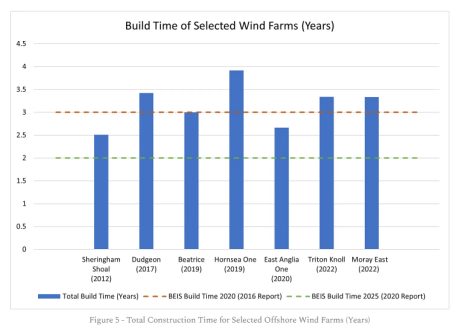
In practice, the wind farms go into partial production part way through construction as some of the early turbines are brought onstream. Therefore, the build times are probably exaggerated a little, but probably not enough to make a significant difference to the overall picture. Most of the offshore windfarms took longer than 3 years to construct, none of them took two years and there’s no apparent downward trend in the overall build time.
It doesn’t look likely that total construction times are going to fall by a whole year by 2025, especially when one considers that windfarms are getting larger and being located further out to sea, complicating logistics.
Offshore Wind Farm Load Factors
Load factors (also known as capacity factors) measure how much electricity will be generated compared to the theoretical maximum if the wind blew at the correct speed all year. The higher the load factor, the more electricity is produced which should lead to lower costs per MWh as the capital expenditure is spread across more units of electricity.
Of course, there are times when the wind doesn’t blow fast enough, or even at all and the turbines produce nothing. There are also times when the wind blows too hard and the turbines have to be turned off to avoid damage and so they produce nothing then either. Figure 6 shows the performance of actual wind farms compared to the Government assumptions for 2020 and 2025.
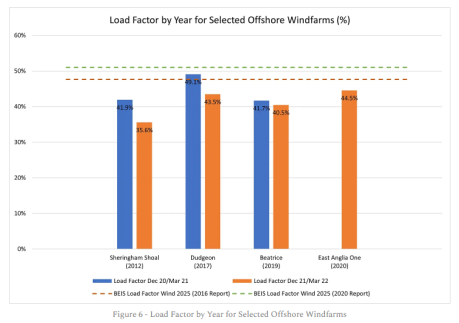
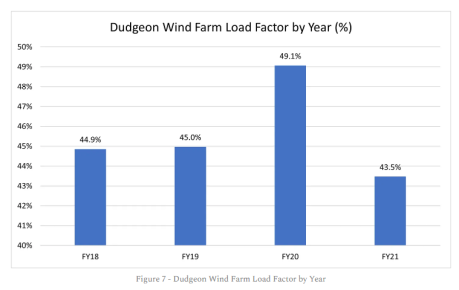
In 2016, the Government assumed a load factor of 47.67% for new wind farms commissioned in 2020 and 2025. The 2020 report assumes a load factor of 51% for turbines commissioned in 2025. These assumptions are averages for every year of the life of the wind farm, not a maximum. In its first full year of operation East Anglia One failed to hit the 2020 target by over three percentage points. Even the performance of Dudgeon in 2020 should be viewed as a one-off performance as it had much lower load factors in its other years of operation as shown in Figure 7.
The load factor of a wind farm is driven by a number of elements including the turbine technology, the layout of the turbines in the sea, the sophistication of the control system and the operation and maintenance regime. To help with its forecasts, the Government commissioned a report from DNV GL to examine the improvements in technology that might improve load factors in the future. The results are shown in Figure 8 below.
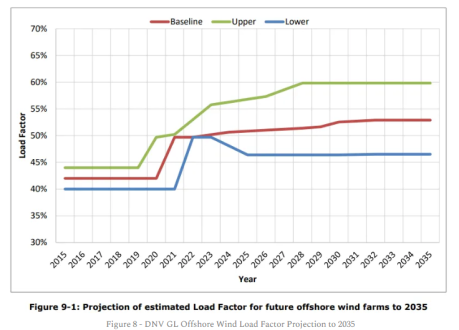
Their baseline estimate is for load factors for new wind farms of 49.7% in 2022, rising to 51% in 2025 and 52.9% in 2030. The improvements to 2030 are driven by moving to larger turbines (15MW compared to 7MW typical today), more advanced control systems and more optimal layouts. We might expect Hornsea One to have a similar performance to East Anglia One as they both use the same model of Siemens 7 MW turbines. Hornsea Two was built using 8MW turbines. Moray East and Triton Knoll, both fully commissioned in 2022, were built using Vestas 9.5MW turbines. However, we won’t know the actual performance of these sites for quite some time.
Vestas is now marketing a 15MW turbine with an implied load factor of over 60% in ideal conditions. Siemens is also marketing a 14MW turbine, but doesn’t make a specific claim for its capacity factor.
We shall have to wait and see how the newer wind farms perform before coming to a complete judgement on the accuracy of the load factor forecasts. However, the first year of operation of East Anglia One shows that hitting the 2020 target even once is challenging, let alone as an average over the life of the wind farm. In its 2020 report, the Government assumes load factors rising to 57% by 2030 (in line with DNV’s upper case) and 63% by 2040 (DNV had a maximum of 60% in 2035). It seems very optimistic to assume the upper case as an average over the whole life of the asset.
Asset Lifetime
The Government changed its assumption on the lifetime of offshore windfarms between its 2016 and 2020 reports. The 2016 report assumed a life of 22 years and the 2020 report increased the life by 36% to 30 years.
Figure 9 sets out the depreciation policies in the accounts of many wind farm companies. The expected life falls well short of 30 years and averages around 24 years.
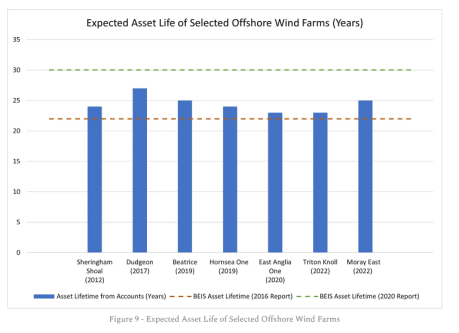
In addition, the expected life of the new 14MW Siemens turbine is 25 years, although Vestas is claiming 30 years for its 15MW turbine. Putting all the data together, it seems very optimistic to assume a 30-year average lifetime for all new offshore wind farms.
Sensitivity of Offshore Wind Prices
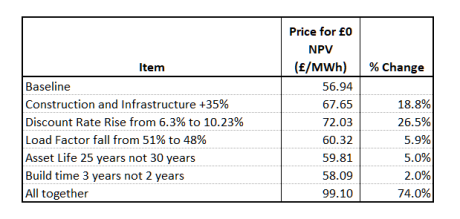
A Discounted Cashflow model has been constructed using the parameters set out in the Government’s 2020 report. This gives a zero NPV using £56.94/MWh strike price so is giving results very close to the Government model; close enough to be a rounding error. Then the various cost drivers were varied to test the sensitivity of prices to the different parameters. The results are shown in Figure 10.
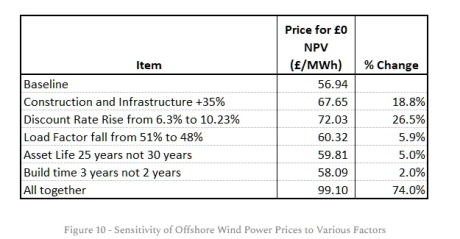
The prices for offshore wind are most sensitive to increased costs of construction and infrastructure and the cost of finance. A 35% increase in the costs of construction (note some projects reporting a 50% increase according to Energy UK) results in an 18.8% increase in the price of electricity. A few percentage points increase in the cost of capital push the electricity prices up 26.5%. Shortfalls in the load factor, asset life and extending the build time have relatively little effect. If all of the changes in the cost drivers come to pass, then offshore wind farm prices rise by 74% to £99.10, almost back to the figures assumed by the Government back in 2016.
Who would have guessed that a highly mineral and capital-intensive source of energy would be very susceptible to commodity and energy price inflation and rising interest rates?
Implications
If scientists such as Professor Simon Michaux are correct, the era of cheap minerals is over. Technologies such as wind and solar power and associated battery storage will demand more and more critical minerals such as copper, nickel, cobalt and lithium. New discoveries of these minerals are required and new discoveries tend to have lower ore grades and so are more energy intensive and expensive to transform into useful metals. This means that these minerals are going to continue to get more expensive for some time to come. This will lead to structurally higher inflation which will mean higher interest rates, so the era of cheap credit is coming to an end.
Therefore, the most important cost drivers for wind power are going to get more expensive, pushing up the price of wind power, which itself will further increase inflation. More subsidies will not fix these problems. In fact, they will make them worse. It is starting to look like offshore wind bubble has popped.
Substack