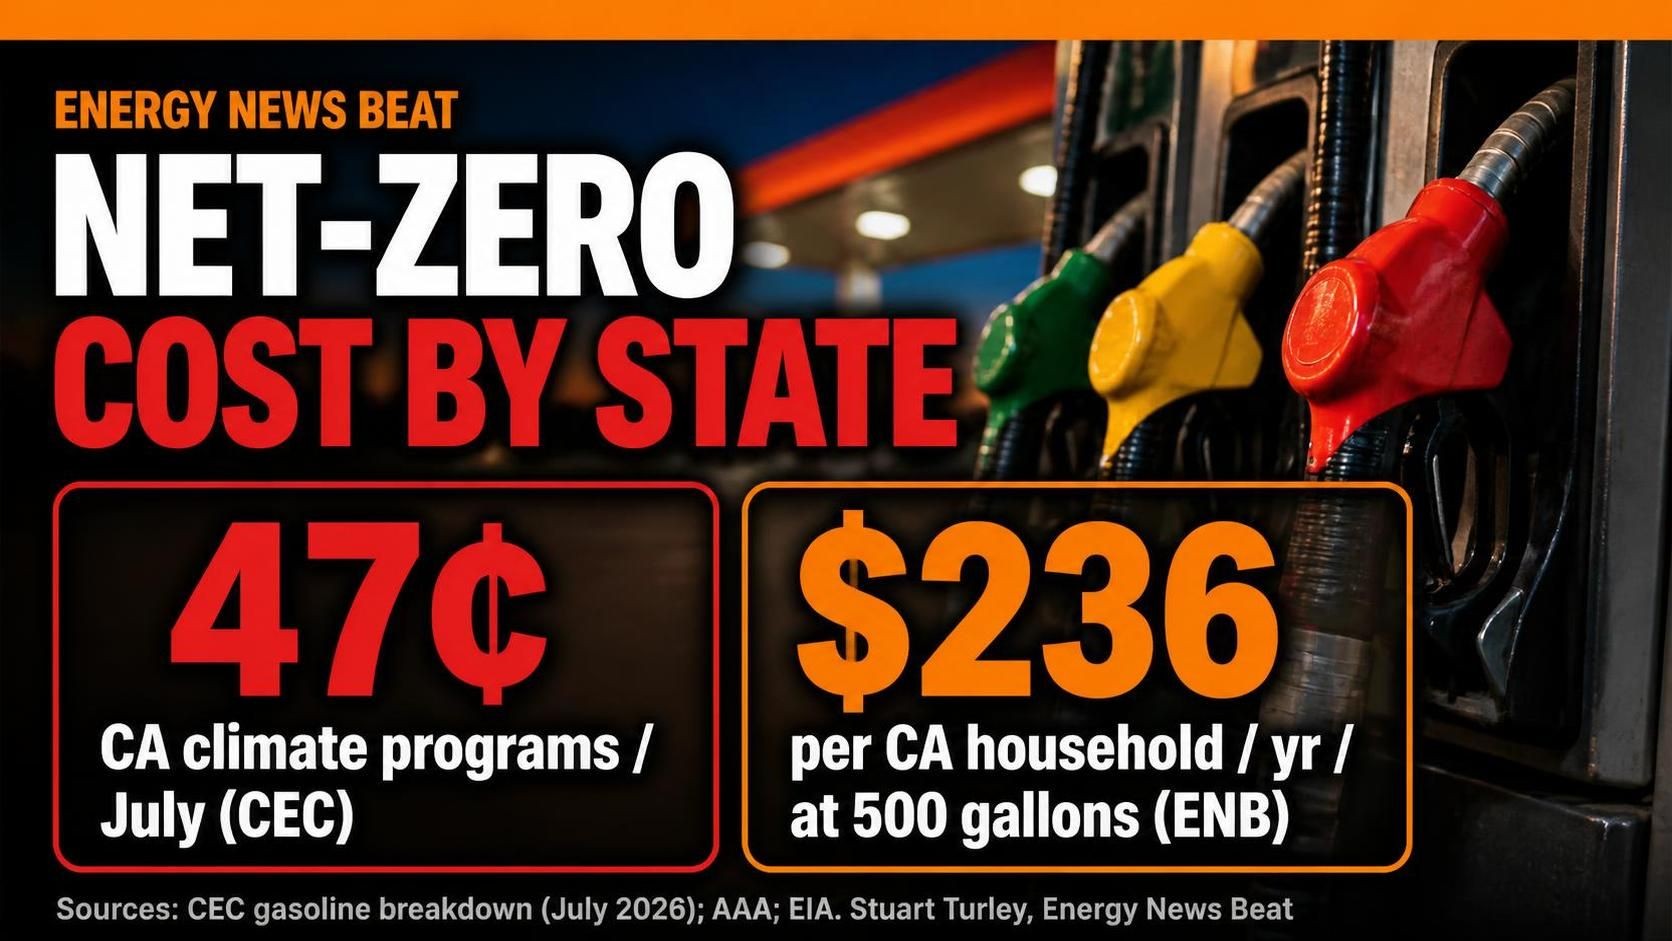
California’s Cap-and-Invest and Low Carbon Fuel Standard added about 47 cents a gallon in July (CEC). Washington’s carbon auction and clean-fuel rules add roughly 36–74 cents. The federal RFS is a separate 1-to-45-cent fight over gross credits versus net pump pass-through. We map the published estimates, keep taxes and refinery closures in their own buckets, and show what that means for a household — without pretending correlation is causation.
By Stuart Turley, host of the Energy News Beat podcast • Published Oct. 14, 2026 • Prices as of Oct. 14, 2026 (AAA); EIA electricity YTD through July 2026; CEC July 2026; auctions as dated • Analysis and opinion: Stu’s views are labeled • Not investment advice
As of AAA Oct. 14; CEC July 2026
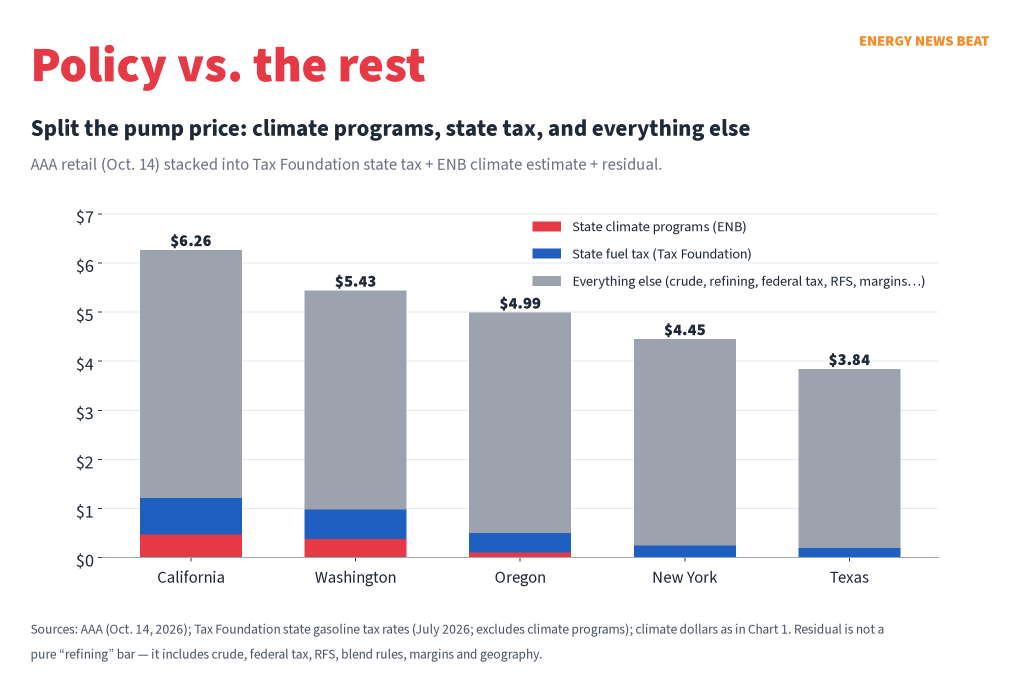
Fill a 15-gallon tank in California this morning and you paid about $94 for regular, at $6.26 a gallon (AAA). In Texas the same fill ran about $58, at $3.84 (AAA). The national average is $4.33. Diesel is even wider: California $8.41, Texas $5.78 (AAA).
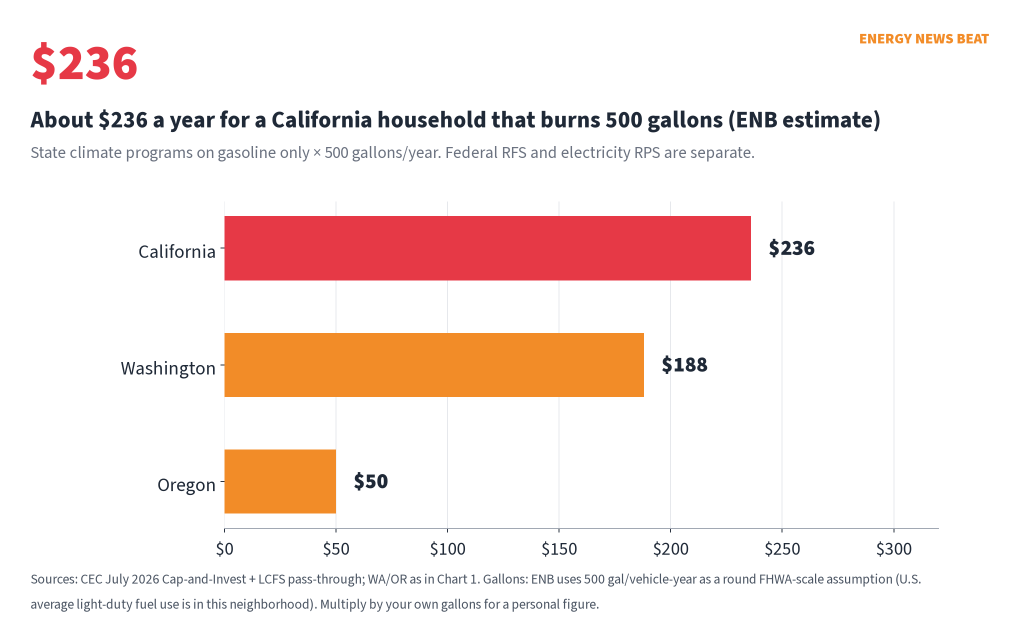
That is not all “climate policy.” California’s state gasoline tax alone is 63.4 cents in the Energy Commission’s July breakdown, and Tax Foundation puts the state’s combined gasoline tax burden at 73.64 cents, the highest in the country (CEC; Tax Foundation). But the climate pieces are real, published and large enough to see. In July, Cap-and-Invest and the Low Carbon Fuel Standard together added about 47 cents a gallon on the CEC’s books — 26.0 cents for Cap-and-Invest and 21.3 cents for LCFS (CEC). At 500 gallons a year, that is about $236 before you touch the electric bill (ENB calculation).
This article does three things. First, it gathers the best published cents-per-gallon and cents-per-kWh estimates for carbon markets, clean-fuel standards, the federal Renewable Fuel Standard, state renewable portfolio standards and early plant retirements. Second, it keeps ordinary fuel taxes, special blends, geography and refinery closures in separate columns so nobody can pretend they are the same thing. Third, it is honest about what we do not know: New York’s economy-wide cap-and-invest has not started, many states have no published pass-through, and high prices in mandate states are correlated with — not proven to be caused only by — those mandates.
| The 60-second version
California (July 2026, CEC): Cap-and-Invest 26.0¢/gal + LCFS 21.3¢ ≈ 47¢. January was about 42¢ (CEC). Washington: CCA at the Sept. auction price of $39.50/ton implies about 31¢/gal on gasoline (ENB calc, House R/LAO method); June’s $64.56 implied ~50¢. Clean Fuel Standard roughly 6–24¢ (EDF; WA House R). Oregon: DEQ puts CFP alone at 9.35¢/gal of E10 in 2025 (DEQ CFP). DEQ’s 2021 macro analysis puts combined CFP+CPP near 10¢ in 2025 and 22¢ by 2030 — ENB uses that as the stack (no double-count) (DEQ macro). New York: economy-wide cap-and-invest has not started; regulation deadline moved to Dec. 31, 2028 (EDF; Columbia Climate Law Blog). RGGI still covers power plants. Federal RFS: EPA’s 2026 total standard is 15.50%. Gross credit math: about 32–37¢/gal at recent RIN prices (IER; ENB). Over the full period of Irwin’s chart, net diesel RIN pass-through averaged about +1¢ (−9 to +6¢); since January 2026 it is up about 9¢, and that net figure excludes biodiesel’s higher underlying cost (Irwin). EPRINC (a petroleum-economics research group) had 45¢ in May (EPRINC). Electricity: LBNL finds RPS compliance costs average ~5% of retail bills, over 10% in a few states (LBNL). EPIC/UChicago estimated RPS raised prices 11% after seven years and 17% after twelve (EPIC). Red vs. blue (simple averages): 31 Trump states vs. 19 Harris states plus D.C. (2024 statewide winner, FEC): gas $4.22 vs $4.59; residential power 15.6¢ vs 23.9¢/kWh (AAA; EIA). Unweighted; correlation ≠ causation. |
California: the clearest price tag
As of CEC July 2026; CARB auction Aug. 19, 2026; AAA Oct. 14
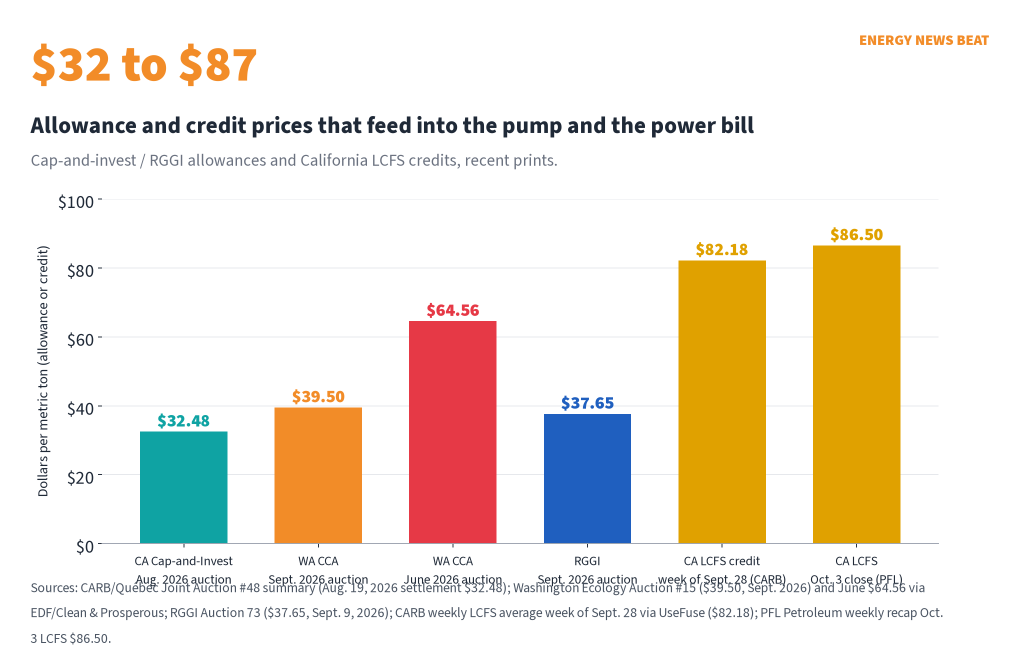
The California Energy Commission now publishes a monthly breakdown that isolates Cap-and-Invest and LCFS pass-throughs on the same sales channels used for wholesale gasoline. In July 2026, with retail at $5.31, Cap-and-Invest was 26.0 cents and LCFS 21.3 cents (CEC; workbook). In January those pieces were about 25 cents and 17 cents (CEC). The August joint auction with Québec settled current-vintage allowances at $32.48 a metric ton (CARB).
The July LCFS print lines up with CARB credit trading: the volume-weighted weekly average was $82.18 a ton in the week of Sept. 28 (UseFuse citing CARB), and a trade desk had California LCFS around $86.50 on Oct. 3 (PFL).
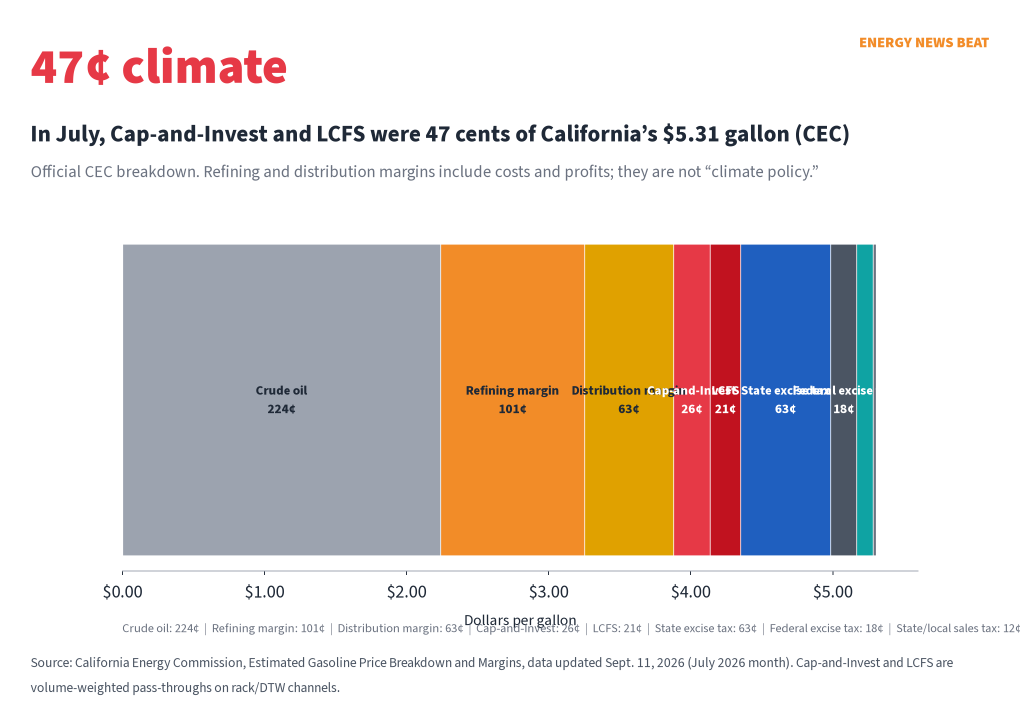
Two cautions. First, Tax Foundation’s 73.64-cent California gasoline tax ranking excludes climate programs on purpose (Tax Foundation). Second, CEC’s refining and distribution “margins” are costs plus profits — they are not a climate fee. The CDTFA–CEC review discusses DPMO’s work on a persistent unexplained “mystery gasoline surcharge” in California prices (CDTFA–CEC; EIA).
Special blend: California’s CARBOB formulation needs extra processing. EIA says it is “more expensive to produce” but does not publish a current cents-per-gallon figure (EIA). CEC’s current public stack does not isolate a separate “blend premium” line. ENB treats blend cost as real but not part of the 47-cent climate total.
Washington and Oregon
As of WA Ecology Sept. 2026 auction; OR DEQ materials 2026
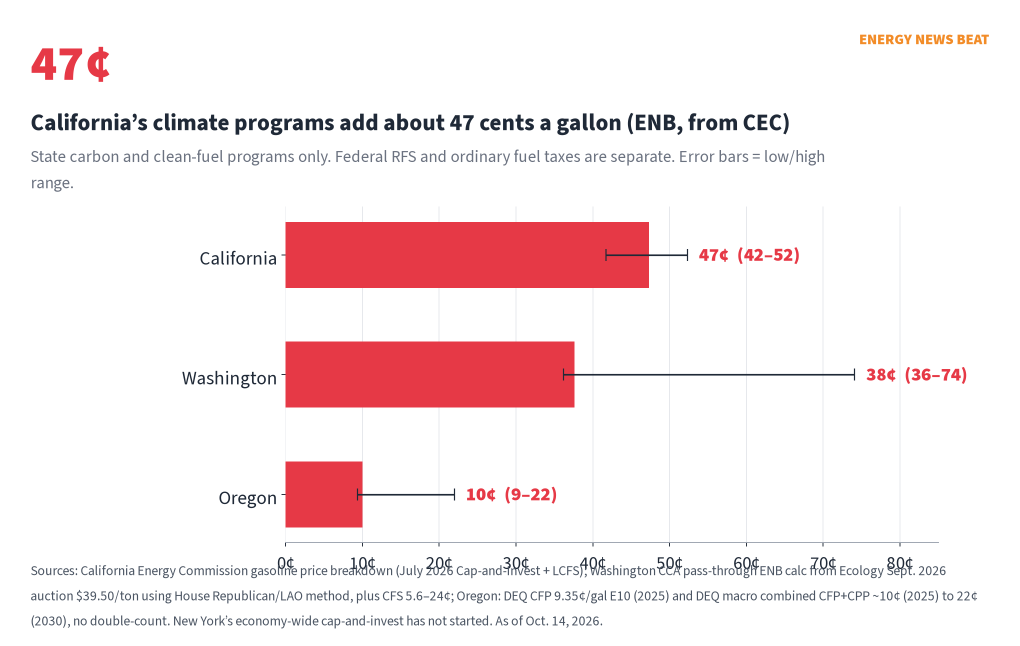
Washington’s Climate Commitment Act sold allowances at $39.50 in September, down from $64.56 in June after a linkage agreement with California and Québec (EDF; Clean & Prosperous). Using the same full-pass-through formula Washington House Republicans published (0.00862 tons CO₂e/gal × 90% petroleum share × allowance price), ENB gets about 31 cents a gallon at $39.50 and about 50 cents at the June price (WA House R; ENB calculation). Diesel is higher: about 40–66 cents on the carbon piece alone. The Clean Fuel Standard adds more; Ecology’s regulatory analysis once put gasoline near 5.6 cents and diesel near 3.4 cents, while House Republican materials cite a 7–24 cent range (WA Ecology; WA House R). Washington Policy Center (free-market) put the CCA near 52 cents when allowances were $64.56 (WPC). Tax Foundation notes Ecology’s own figures are lower than full pass-through: about 5.16–15.5 cents for the CCA and 7.2 cents for the CFS (Tax Foundation).
Oregon layers a Clean Fuels Program and a Climate Protection Program. DEQ’s own 2025 CFP calculation is 9.35 cents per gallon of E10 (DEQ CFP). DEQ’s 2021 macroeconomic analysis — which models combined CFP and CPP compliance — put motor gasoline near 10 cents a gallon in 2025 and 22 cents by 2030 (DEQ macro). ENB’s Oregon stack uses that combined path as the central estimate (10 cents, range 9.35–22 cents) so the CFP is not added again on top. The CPP remains politically and legally contested; uncertainty is wider than California’s CEC line items.
New York: the program that is not there yet
New York’s Climate Leadership and Community Protection Act still points toward an economy-wide program, but cap-and-invest has not begun. The 2026 budget amendments pushed the Department of Environmental Conservation’s deadline to issue emissions-reduction regulations to December 31, 2028 (EDF; Columbia Climate Law Blog). Governor Hochul had already declined to release drafted cap-and-invest rules, citing affordability (Columbia). So ENB’s New York gasoline climate-policy cell is $0.00 for an economy-wide carbon price that does not yet exist. What New Yorkers do pay on electricity includes RGGI (Auction 73 cleared at $37.65 a ton on Sept. 9, up from $35.00 in June (RGGI)) and CLCPA-driven clean-energy procurement. LBNL’s latest New York RPS/CES compliance-cost share was about 2.4% of the retail bill in 2024 (LBNL).
The federal RFS: big gross, smaller net
As of PFL week ending Oct. 2; EPA Set 2 rule
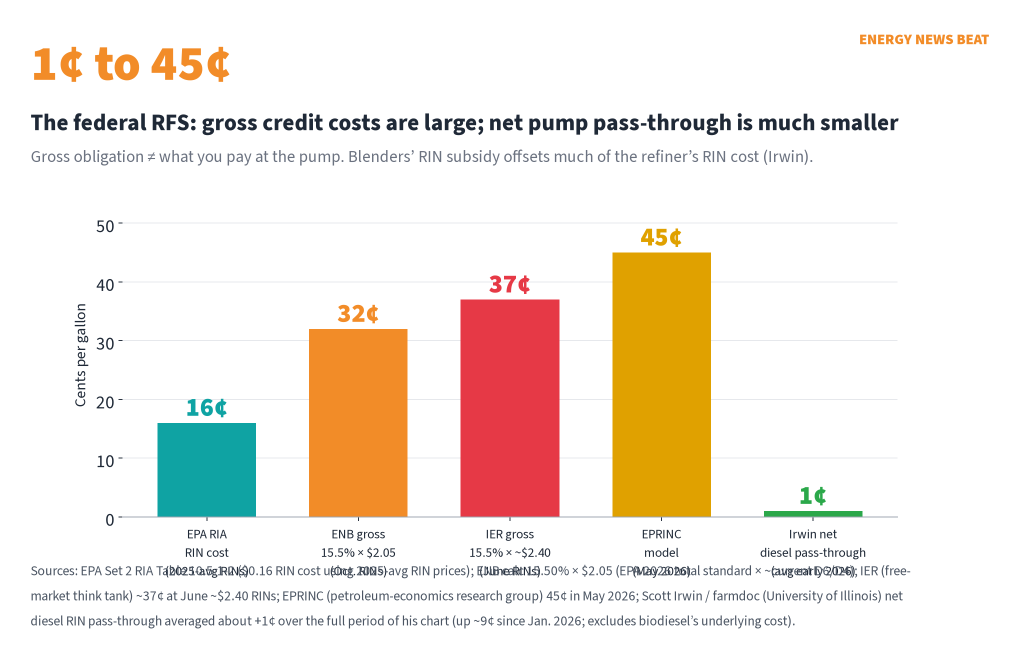
Every state sits under the Renewable Fuel Standard. EPA’s 2026 total renewable fuel percentage standard is 15.50% of obligated gasoline and diesel (EPA; IER). D6 ethanol RINs closed the week of Oct. 2 near $2.03 and D4 biomass-based diesel RINs near $2.09½ (PFL). Multiply 15.50% by about $2.05 and you get a gross obligation near 32 cents a gallon (ENB). IER (a free-market think tank) did the same with June prices near $2.40 and got about 37 cents (IER). EPRINC, a petroleum-economics research group, modeled about 45 cents in May (EPRINC). EPA’s own RIA, using 2025-average RIN prices, put the RIN cost on petroleum fuel at $0.16 a gallon for 2026 (EPA RIA).
Scott Irwin at the University of Illinois stresses the other half of the ledger: when blenders detach RINs, that value is supposed to discount the biofuel in the blend. Over the full period of his chart, net diesel RIN pass-through bounced between about −9 and +6 cents and averaged roughly +1 cent, even while the gross “tax” and “subsidy” legs each swung 20–25 cents. Since January 2026 the net has risen about 9 cents, and Irwin notes the net figure still leaves out biomass-based diesel’s higher underlying cost, which “certainly is substantial” (Irwin). ENB shows the full range and does not add 37 cents of RFS on top of California’s 47 cents of state climate policy as if they were the same kind of number.
Electricity: RPS, RGGI and early retirements
As of LBNL June 2026; EIA YTD July 2026; RGGI Sept. 9
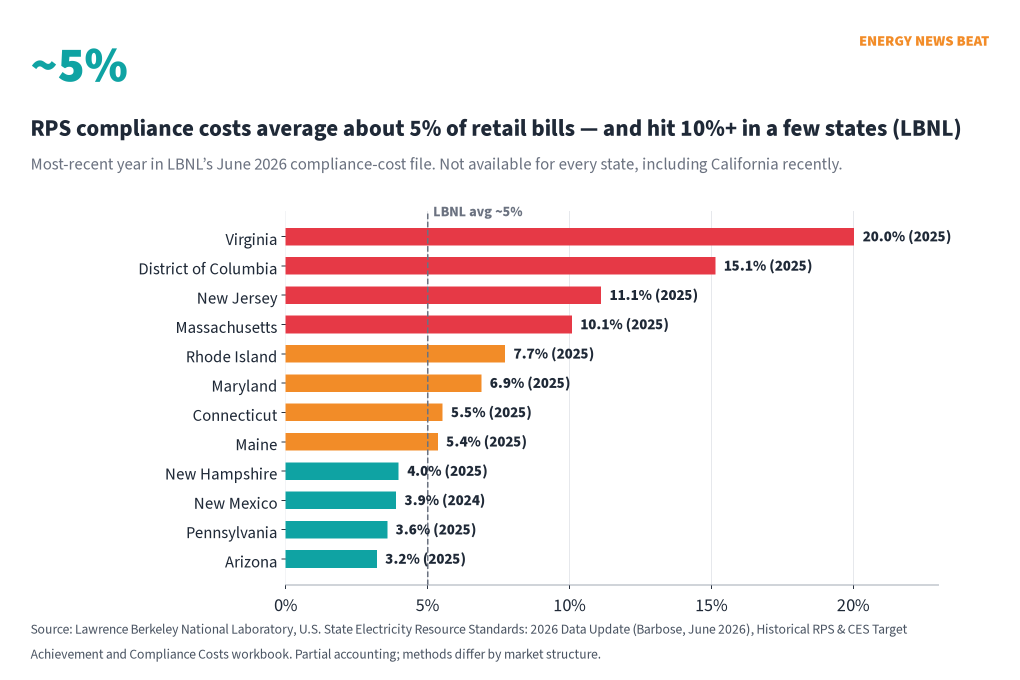
Lawrence Berkeley National Laboratory’s 2026 update finds RPS and clean-energy standard compliance costs averaged about 5% of retail electricity bills in states with data, under 1% in seven states and over 10% in four (LBNL). In the workbook: Virginia ~20% (2025), D.C. ~15%, New Jersey ~11%, Massachusetts ~10% (LBNL xlsx). California’s recent compliance-cost cells are blank in that file — a real gap. Converted at each state’s residential price, those percentages become tenths of a cent to a few cents per kWh (ENB calculation in the data file).
A separate EPIC/University of Chicago study by Michael Greenstone and Ishan Nath estimated that RPS policies raised average retail prices by 11% (1.3¢/kWh) seven years after passage and 17% (2.0¢/kWh) after twelve, in a 1990–2015 panel (EPIC). That is an academic causal design, not a 2026 bill line-item.
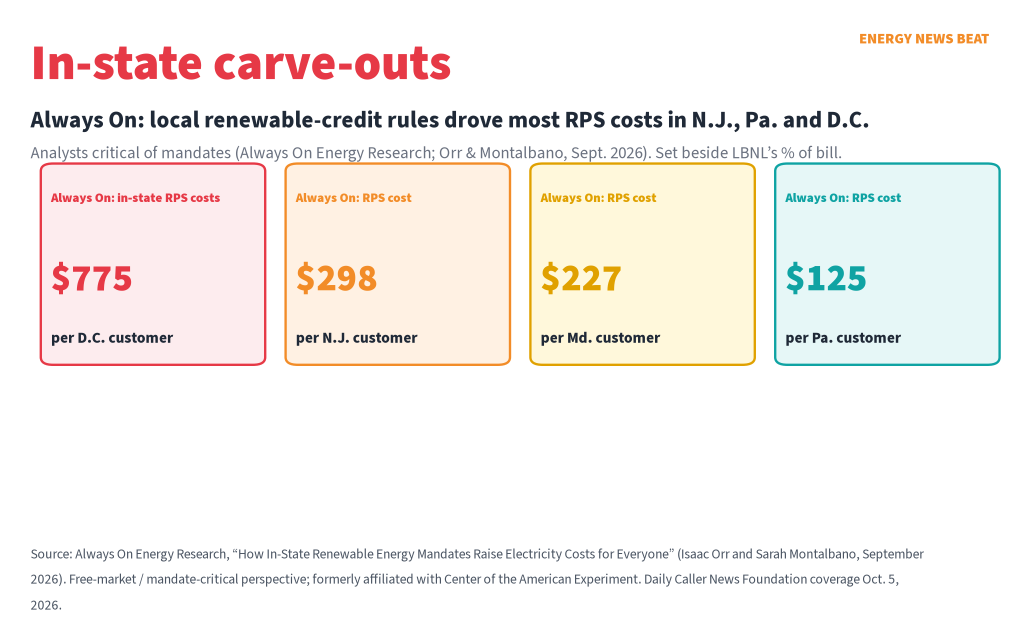
Always On Energy Research — the shop Isaac Orr and Mitch Rolling founded after leaving Minnesota’s Center of the American Experiment; they write as Energy Bad Boys and are openly critical of mandates — finds that in-state renewable-credit carve-outs drove 51% of New Jersey’s RPS costs, 52% of Pennsylvania’s and about 57% of D.C.’s, with modeled customer costs of about $298, $125 and $775 in the latest years they analyzed (Always On; DCNF). ENB puts those figures beside LBNL rather than instead of LBNL.
RGGI: the September auction cleared at $37.65 a ton (RGGI). How many cents that is per kWh depends on each state’s fossil intensity and how regulators credit auction proceeds back to bills. ENB does not invent a single nationwide ¢/kWh; the allowance price is the hard number.
Early retirements: Davis and Hausman’s study of California’s San Onofre nuclear outage found generation costs up about $350 million (13%) in the first year (Davis & Hausman). Always On (mandate-critical) reports that existing U.S. coal plants in its sample average $45.57/MWh and that 77% operate below $60/MWh, arguing forced retirements without firm replacement raise reliability risk (Always On). Those are Always On’s cost and risk estimates, not a universal ¢/kWh adder for every state.
Mandate states, red states and the causation problem
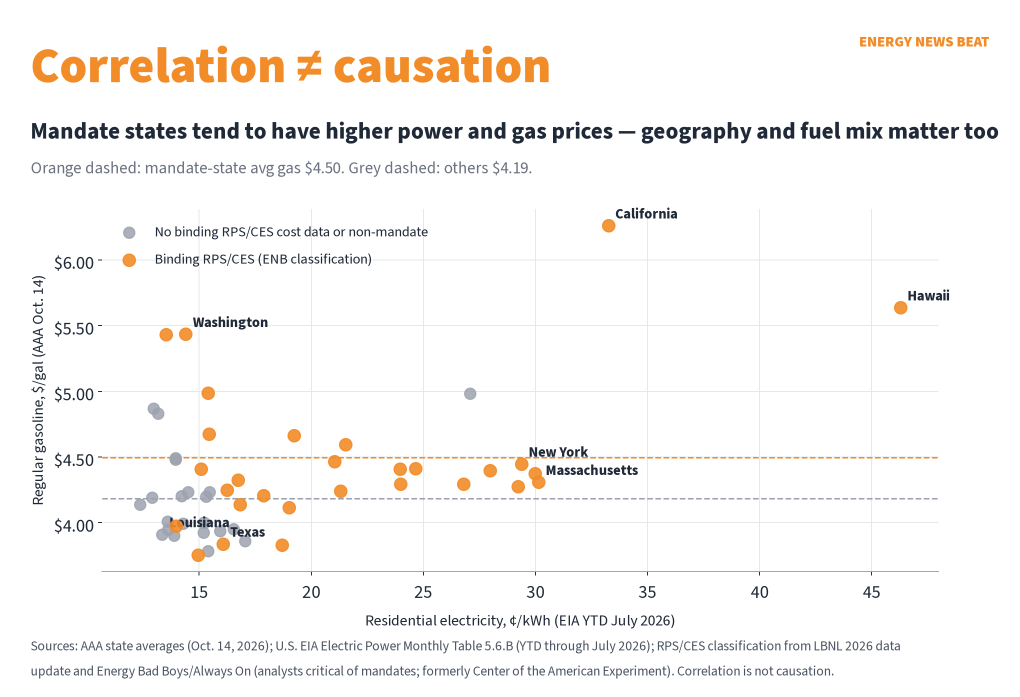
On today’s AAA tape, states ENB classifies as having binding RPS/CES average $4.50 regular gasoline versus $4.19 elsewhere; residential power (EIA YTD) averages 21.8¢ versus 15.0¢/kWh (ENB averages from AAA and EIA). Energy Bad Boys reported that mandate states sought 32% higher utility rate increases than non-mandate states from 2020 through 2025 (Energy Bad Boys). Their “Blue States, High Rates” report with IER shows the same partisan price gap (Energy Bad Boys / IER).
Be careful. California imports no gasoline by pipeline, runs a unique fuel spec, has lost refining capacity, and has wildfire-driven transmission spending (CEC; EIA; ENB DPA/refineries). Hawaii is an island. Gulf Coast states sit on refining and gas. High prices and blue politics travel together for many reasons. ENB reports the gap, shows the policy line items we can source, and refuses to pretend the residual is all “net zero.”
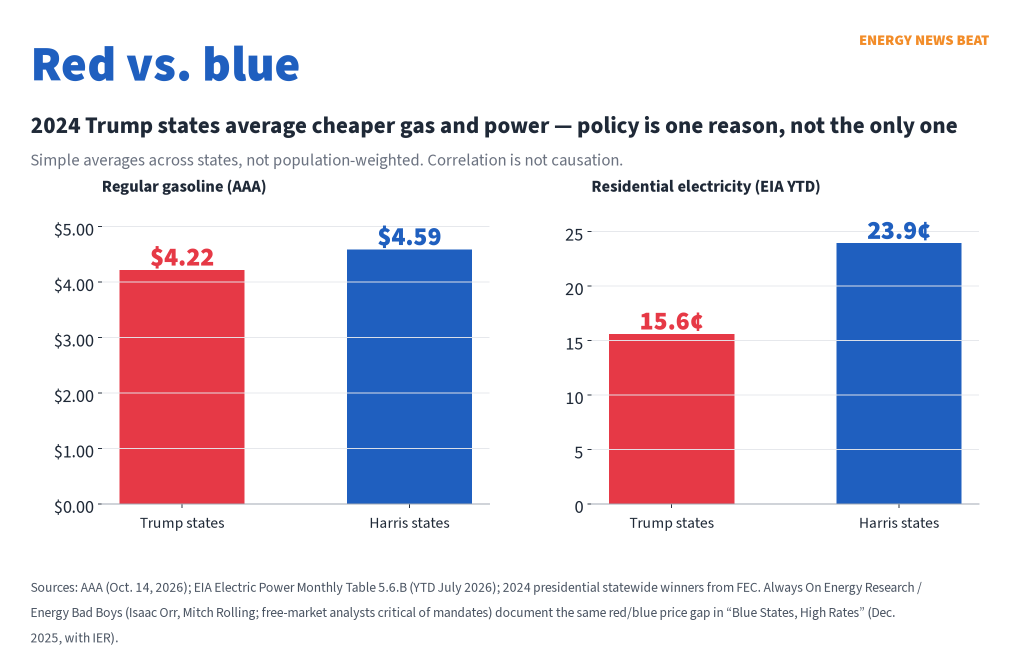
Simple unweighted averages across the 31 states Trump won and the 19 states plus D.C. Harris won (2024 statewide winner, FEC): gas $4.22 vs. $4.59; residential power 15.6¢ vs. 23.9¢/kWh (AAA; EIA).
Refinery closures are not a carbon tax — and they still hurt
Valero idled refining at Benicia in April 2026 under the plan Governor Newsom’s office described on Jan. 6, 2026, and says it will keep all required operating permits while it weighs options for the site (Governor’s office; Valero). Phillips 66’s Los Angeles refinery wound down crude processing; Rodeo and Martinez converted toward renewables (CEC; ENB’s DPA/refineries file). UC Davis / Giannini researchers’ 2026 scenarios put the two closures at about $1.23 a gallon if imports fall back, $0.63 if imports hold at 2025 levels and cover one closure, and no lasting increase if imports cover both; an earlier 2025 paper had a path peaking near $1.21 by August 2026 (Giannini 2026; Giannini 2025). SIEPR’s Neale Mahoney and Ryan Cummings put Benicia alone at negligible to 15 cents if the site becomes a marine terminal (Mahoney). Those dollars are supply-shock dollars. They belong in the stacked bar next to policy — not inside the Cap-and-Invest line.
What a household pays
Using 500 gallons of gasoline a year as a round, FHWA-scale household/vehicle assumption (your miles will differ), ENB’s central state-climate gasoline costs are about $236 in California, $188 in Washington and $50 in Oregon. Texas’s cell is $0 for state carbon/CFS programs — not $0 for fuel. On electricity, EIA’s 2024 residential use was about 503 kWh a month in California and 1,096 in Texas (EIA); apply your state’s LBNL RPS share where it exists. A D.C. customer facing Always On’s $775 RPS estimate is in a different world from a Texan at LBNL’s fraction of a percent (Always On; LBNL).
How consumers and investors see it
Consumers: The 2026 AP-NORC/EPIC energy survey again found support for a household climate fee collapsing as the monthly amount rises — about 38% backed a $1 monthly fee and far fewer backed $20–$100 fees (AP-NORC/EPIC). That is willingness-to-pay evidence, not a pump reading. Drivers in California and Washington are already paying climate-program cents the CEC and auction math can show.
Analysts and advocates: Always On and IER — free-market / mandate-critical think tanks, not investors — argue mandate states have chosen higher rates (Always On; IER; Energy Bad Boys). LBNL and EPIC supply the mainstream compliance-cost and econometric estimates (LBNL; EPIC). EPA’s RFS rule touts rural income and oil-security benefits alongside fuel-cost tables (EPA). ENB’s job is to put those numbers on one page with labels, not to launder anyone’s press release.
| Stu’s Take
Folks, energy security starts at home. California regular is $6.26. Texas is $3.84. The CEC itself says Cap-and-Invest and LCFS were about 47 cents of a July gallon. Washington’s auction math is still tens of cents. That is before state taxes and before the refining problem we covered in the DPA piece. In my opinion, Cap-and-Invest is a wealth transfer program with no positive impact on the environment. Historically, it has been a slush fund for corruption. There are still only two ways fuel prices come down in a tight market: demand destruction, or more barrels of product — which means more refineries and fewer forced shutdowns. Giannini’s 2026 work says the two California closures are worth about 63 cents if imports only hold at 2025 levels — and $1.23 if imports fall back. That is not a carbon allowance. It is a missing still. Red and blue policy differences show up in the averages — about $4.22 vs. $4.59 for gas and 15.6¢ vs. 23.9¢ for power — and Always On’s @AlwaysOnEnergy crew has been pounding that table. Correlation is not causation; islands, pipelines and wildfire spend are real. So are 47-cent line items. On the federal RFS, listen to Scott Irwin: gross RIN math near 32–37 cents is not the same as net diesel pass-through that averaged about a penny over his full chart — though it is up about 9 cents since January, before counting biodiesel’s own higher cost. Use all of those numbers. And New York’s big carbon market? Not started. Say so. |
| ENB’s Messaging Recommendations for the Trump Administration
Opinion section — Stu’s voice. Every point sits on a sourced number in this article. 1. Put the CEC’s 47 cents on a poster. California’s own Energy Commission shows Cap-and-Invest + LCFS at about 47¢/gal in July (26.0¢ + 21.3¢). Message: “This is not a think-tank guess.” Counterargument: CEC margins and crude dwarf the climate slices, and DPMO has examined an unexplained “mystery surcharge” in California prices. Answer: Agree — show the full stack (Chart 1). Lead with the climate line-items and admit refining/distribution are larger. Honesty beats a 47-cent-only meme. 2. Contrast California $6.26 with Texas $3.84 without overclaiming. (AAA). Counterargument: Texas sits on Gulf refining; California is an energy island with CARBOB. Answer: Concede geography and blend rules (EIA). Then note Texas also has no state carbon/CFS ¢/gal in our table, and California’s climate line is published. 3. Use Washington’s auction print, both of them. $39.50 in September and $64.56 in June map to about 31¢ and 50¢ on gasoline (ENB/House R method). Prices fell after the linkage agreement (EDF says the drop may reflect linkage expectations). Those cents assume full pass-through; Ecology’s own estimates are lower — about 5.16–15.5¢ for the CCA and 7.2¢ for the CFS. Message: “Even a lower allowance price is not zero at the pump.” Counterargument: proceeds fund rebates and transit. Answer: Publish the cents at the pump — both the full-pass-through and Ecology numbers — and the rebate; let households do the net math. 4. Say out loud that New York’s cap-and-invest is not live. Deadline Dec. 31, 2028. Message: “Affordability concerns already shelved New York’s drafted cap-and-invest regulations, and lawmakers pushed the deadline to Dec. 31, 2028” (Columbia; EDF). Counterargument: delay increases climate risk. Answer: That is a values debate; the factual claim is only that the program has not started and therefore is not in today’s NY gasoline price. 5. On the RFS, carry Irwin and IER in the same sentence. Gross ~32–37¢ vs. net diesel ~+1¢ over Irwin’s full chart, up ~9¢ since January and excluding biodiesel’s underlying cost. Message: “We can defend motorists without mangling the RIN algebra.” Counterargument: EPRINC’s 45¢ shows huge consumer harm. Answer: Label EPRINC by its own description (petroleum-economics research); show EPA’s own $0.16 RIN-cost table; do not pick only the biggest number. 6. Tie closures to the DPA/refinery argument. Giannini’s 2026 scenarios — $1.23 / $0.63 / $0 depending on imports — and Mahoney’s ≤15¢ Benicia upper bound are supply, not LCFS. Valero itself called California’s regulatory and enforcement environment “the most stringent and difficult in North America” (Argus). Message: “Whatever drove the closures, lost stills cost drivers on top of the climate line items.” Counterargument: demand is falling with EVs (CEC). Answer: CEC also says unplanned outages still spike prices (e.g., ~42¢ after a Feb. 2025 fire). Falling demand does not make a sudden capacity loss free. 7. On power bills, quote LBNL’s ~5% average and Always On’s carve-out dollars. (LBNL; Always On). Message: “In-state credit protectionism is optional.” Counterargument: local build brings jobs and Clean Air Act co-benefits. Answer: Concede co-benefits are outside this cost article; cost transparency still requires showing that, by Always On’s (mandate-critical) estimate, 51–57% of RPS compliance costs in NJ, PA and D.C. came from in-state carve-outs — RPS itself is about 5% of bills on average. 8. Household math: ~$236 / $188 / $50 a year on gasoline climate programs at 500 gallons (ENB). Message: “In California, that is about $20 a month — roughly $4.50 every week at the pump.” Counterargument: 500 gallons is arbitrary. Answer: Publish the ¢/gal and let reporters multiply by local VMT — methodology is in the appendix. 9: Cap-and-Invest and other Net Zero policies are nothing more than a wealth transfer, and a way to get additional money to funnel to pet projects. |
What to watch
- Next CARB and Ecology auctions — allowance prices feed the ¢/gal math within weeks.
- CEC monthly breakdown — the cleanest official climate pass-through series in the country.
- New York DEC — any draft cap-and-invest or substitute rule before the 2028 deadline.
- EPA RFS implementation — D4/D6 RIN prices into year-end compliance (farmdoc; PFL).
- California import volumes — Giannini’s hinge for whether the two closures look like $1.23, 63 cents, or $0 (Giannini 2026).
The bottom line
Where agencies publish pass-throughs, net-zero and clean-fuel policies are not abstractions. California’s own books say about 47 cents a gallon in July. Washington’s auction price still pencils out to tens of cents. Oregon is about a dime at DEQ’s combined 2025 path (range to 22 cents by 2030). New York’s big carbon market is, for now, a headline without a pump price. The federal RFS is a nationwide layer whose gross credit cost and net pump effect must not be confused. Electricity mandates show up in LBNL’s percentages and in Always On’s carve-out dollars. Taxes, islands, pipelines and shuttered refineries belong in the next column over. For the refining fix, see ENB’s DPA analysis.
Check out the World’s Greatest Podcast Show Notes at EnergyNewsBeat.co or EnergyNewsBeat.com. And subscribe to: The Energy News Beat Substack.
At Energy News Beat we Make Appendices Great Again. Times are U.S. Central (CDT, UTC−5) unless noted. Labels: [ENB CALC] = our arithmetic from cited figures; [ENB ESTIMATE] = our assembled range from published sources; [ENB READING] = interpretation. Advocacy and industry sources are labeled in Appendix A.
Download the data: every figure in the charts and the 50-state table is in “What Net-Zero Policies Add to Your Fuel and Power Bill, State by State – Data.xlsx.”
Appendix A. Sources
Appendix B. Key figures
| Figure | Value | Source |
| AAA CA / TX / US regular | $6.2607 / $3.8394 / $4.3333 | AAA |
| AAA CA / TX diesel | $8.4130 / $5.7756 | AAA |
| CEC Jul Cap-and-Invest + LCFS | 26.0¢ + 21.3¢ = 47.3¢ | CEC |
| CEC Jan Cap-and-Invest + LCFS | 24.5¢ + 17.1¢ | CEC |
| CARB auction Aug 2026 | $32.48/ton current vintage | CARB |
| WA CCA auctions | Sept $39.50; June $64.56 | EDF |
| WA CCA ¢/gal ENB | 30.6¢ gas @ $39.50; 50.1¢ @ $64.56; diesel 40.3–65.9¢ | WA House R; ENB |
| RGGI Auction 73 | $37.65/ton (Auction 72: $35.00) | RGGI |
| D6 / D4 RINs (week ending Oct 2) | $2.03 / $2.095 | PFL |
| RFS 2026 total standard | 15.50% | EPA; IER |
| RFS gross / net / EPRINC / EPA RIA | ~32¢ ENB; ~37¢ IER; ~45¢ EPRINC; $0.16 EPA RIA; ~+1¢ Irwin net diesel (full chart; +9¢ since Jan.) | see Chart 3 sources |
| LBNL RPS avg | ~5% of retail bills | LBNL |
| EPIC RPS price effect | +11% (7 yr); +17% (12 yr) | EPIC |
| Always On per-customer | DC $775; NJ $298; MD $227; PA $125 | Always On |
| Giannini closure scenarios (2026 paper) | S1 imports fall back $1.23; S2 imports at 2025 levels $0.63; S3 imports cover both $0; (2025 paper: $1.21 peak by Aug. 2026) | Giannini 2026; Giannini 2025 |
| OR DEQ CFP / combined CFP+CPP | CFP 9.35¢ (2025, E10); combined 10¢ (2025) → 22¢ (2030) | DEQ CFP; DEQ macro |
| WA Ecology estimates (via Tax Foundation) | CCA 5.16–15.5¢; CFS 7.2¢ | Tax Foundation |
| Mahoney Benicia upper bound | ≤15¢/gal if terminal conversion | Mahoney |
| HH 500 gal CA / WA / OR climate | $236 / $188 / $50 | ENB |
| Red (31 states) vs blue (19 + D.C.) gas / power, simple unweighted | $4.22 vs $4.59; 15.6¢ vs 23.9¢ | AAA; EIA; FEC |
| Tax Foundation CA gas tax | 73.64¢ (excludes climate programs) | Tax Foundation |
| NY cap-and-invest status | Not started; regs due by Dec. 31, 2028 | EDF |
Appendix C. Fifty-state (plus DC) table
Climate ¢/gal is ENB’s assembled state carbon/CFS estimate (0 where no program or not started). RPS % from LBNL latest available year. Taxes from Tax Foundation (July 2026). Prices: AAA Oct. 14; EIA YTD July 2026 residential ¢/kWh. Household climate $ = climate_gas_c × 500.
| State | ’24 | Gas $ | Diesel $ | Tax ¢ | Climate ¢ | Clim. range | Res ¢/kWh | RPS % bill | HH clim $ |
| Alabama | T | 3.95 | 5.93 | 31.0 | 0 | — | 16.5 | n/a | $0 |
| Alaska | T | 4.98 | 6.57 | 8.9 | 0 | — | 27.1 | n/a | $0 |
| Arizona | T | 4.67 | 6.27 | 19.0 | 0 | — | 15.4 | 3.2% | $0 |
| Arkansas | T | 3.95 | 5.92 | 25.0 | 0 | — | 13.6 | n/a | $0 |
| California | H | 6.26 | 8.41 | 73.6 | 47 | 42–52 | 33.2 | n/a | $236 |
| Colorado | H | 4.32 | 6.52 | 30.2 | 0 | — | 16.7 | 0.6% | $0 |
| Connecticut | H | 4.40 | 6.45 | 25.0 | 0 | — | 28.0 | 5.5% | $0 |
| Delaware | H | 4.21 | 6.30 | 23.0 | 0 | — | 17.9 | n/a | $0 |
| District of Columbia | H | 4.41 | 6.52 | 35.7 | 0 | — | 24.7 | 15.1% | $0 |
| Florida | T | 4.20 | 6.07 | 40.1 | 0 | — | 15.3 | n/a | $0 |
| Georgia | T | 3.79 | 5.75 | 34.1 | 0 | — | 15.4 | n/a | $0 |
| Hawaii | H | 5.64 | 7.28 | 18.5 | 0 | — | 46.3 | n/a | $0 |
| Idaho | T | 4.87 | 6.35 | 33.0 | 0 | — | 13.0 | n/a | $0 |
| Illinois | H | 4.66 | 6.57 | 70.4 | 0 | — | 19.2 | 1.1% | $0 |
| Indiana | T | 3.86 | 6.62 | 63.1 | 0 | — | 17.0 | n/a | $0 |
| Iowa | T | 4.20 | 6.07 | 30.0 | 0 | — | 14.2 | n/a | $0 |
| Kansas | T | 4.00 | 6.01 | 25.0 | 0 | — | 15.2 | n/a | $0 |
| Kentucky | T | 3.99 | 6.12 | 26.4 | 0 | — | 14.3 | n/a | $0 |
| Louisiana | T | 3.91 | 5.82 | 20.9 | 0 | — | 13.3 | n/a | $0 |
| Maine | H | 4.38 | 6.43 | 31.4 | 0 | — | 30.0 | 5.4% | $0 |
| Maryland | H | 4.24 | 6.36 | 46.8 | 0 | — | 21.3 | 6.9% | $0 |
| Massachusetts | H | 4.31 | 6.33 | 27.6 | 0 | — | 30.1 | 10.1% | $0 |
| Michigan | T | 4.59 | 6.48 | 53.4 | 0 | — | 21.5 | -0.8% | $0 |
| Minnesota | H | 4.25 | 6.14 | 32.7 | 0 | — | 16.2 | n/a | $0 |
| Mississippi | T | 3.92 | 5.89 | 24.4 | 0 | — | 15.2 | n/a | $0 |
| Missouri | T | 3.97 | 5.99 | 30.0 | 0 | — | 14.0 | 0.2% | $0 |
| Montana | T | 4.49 | 6.11 | 33.8 | 0 | — | 13.9 | n/a | $0 |
| Nebraska | T | 4.19 | 6.04 | 32.7 | 0 | — | 12.9 | n/a | $0 |
| Nevada | T | 5.43 | 6.77 | 24.8 | 0 | — | 13.5 | n/a | $0 |
| New Hampshire | H | 4.29 | 6.35 | 23.8 | 0 | — | 26.8 | 4.0% | $0 |
| New Jersey | H | 4.29 | 6.32 | 49.1 | 0 | — | 24.0 | 11.1% | $0 |
| New Mexico | H | 4.41 | 6.05 | 18.9 | 0 | — | 15.1 | 3.9% | $0 |
| New York | H | 4.45 | 6.51 | 24.2 | 0 | — | 29.4 | 2.4% | $0 |
| North Carolina | T | 3.75 | 5.72 | 41.2 | 0 | — | 14.9 | 0.7% | $0 |
| North Dakota | T | 4.14 | 6.00 | 23.0 | 0 | — | 12.4 | n/a | $0 |
| Ohio | T | 3.83 | 6.07 | 38.5 | 0 | — | 18.7 | 0.4% | $0 |
| Oklahoma | T | 4.01 | 5.88 | 20.0 | 0 | — | 13.6 | n/a | $0 |
| Oregon | H | 4.99 | 6.74 | 40.0 | 10 | 9–22 | 15.4 | 0.5% | $50 |
| Pennsylvania | T | 4.46 | 6.55 | 58.7 | 0 | — | 21.0 | 3.6% | $0 |
| Rhode Island | H | 4.27 | 6.33 | 41.1 | 0 | — | 29.2 | 7.7% | $0 |
| South Carolina | T | 3.94 | 5.84 | 28.7 | 0 | — | 15.9 | n/a | $0 |
| South Dakota | T | 4.23 | 6.01 | 30.0 | 0 | — | 14.5 | n/a | $0 |
| Tennessee | T | 3.90 | 6.00 | 27.4 | 0 | — | 13.9 | n/a | $0 |
| Texas | T | 3.84 | 5.78 | 20.0 | 0 | — | 16.1 | 0.1% | $0 |
| Utah | T | 4.83 | 6.28 | 32.6 | 0 | — | 13.2 | n/a | $0 |
| Vermont | H | 4.41 | 6.38 | 34.9 | 0 | — | 23.9 | 1.7% | $0 |
| Virginia | H | 4.14 | 6.21 | 42.4 | 0 | — | 16.8 | 20.0% | $0 |
| Washington | H | 5.43 | 7.29 | 60.2 | 38 | 36–74 | 14.4 | 1.4% | $188 |
| West Virginia | T | 4.23 | 6.36 | 35.7 | 0 | — | 15.5 | n/a | $0 |
| Wisconsin | T | 4.12 | 6.19 | 32.9 | 0 | — | 19.0 | n/a | $0 |
| Wyoming | T | 4.48 | 6.21 | 24.0 | 0 | — | 13.9 | n/a | $0 |
Appendix D. Methodology and formulas
CA climate ¢/gal: CEC workbook Cap and Trade + Low Carbon Fuel Standard for the stated month. Central = July 2026; low = January 2026 sum; high = July + 5¢ sensitivity for credit-price risk.
WA CCA ¢/gal [ENB CALC]: 0.00862 tCO₂e/gal × 0.90 × allowance $/t (gasoline); 0.01021 × allowance (diesel). Factors from Washington House Republican issue brief mirroring California LAO. Allowance prices: Ecology auctions.
WA CFS: low 5.6¢ (Ecology regulatory analysis gasoline); central 7¢; high 24¢ (House Republican range).
OR [ENB ESTIMATE]: central 10¢ = DEQ 2021 macro analysis combined CFP+CPP gasoline cost for 2025 (not added to CFP again); low 9.35¢ = DEQ 2025 CFP cost alone (E10); high 22¢ = DEQ macro 2030 combined path. Household = 10¢ × 500 = $50.
NY economy-wide carbon: $0; program not implemented. RGGI is power-sector only and not converted here to a gasoline ¢/gal.
RFS gross [ENB CALC]: 0.1550 × representative RIN $. Oct. proxy $2.05 → ~31.8¢; IER June ~$2.40 → ~37¢. Nested D-code mix is simplified — same approach as IER’s public note.
RFS net: Irwin (July 2, 2026) diesel net RIN pass-through averaged ~+1¢ over the full period of his chart (range about −9 to +6¢); up about 9¢ since January 2026; excludes biodiesel’s higher underlying cost. Not added into state climate columns.
RPS ¢/kWh [ENB CALC]: LBNL compliance cost share × EIA residential ¢/kWh (YTD July 2026).
Household gasoline climate $: climate_gas_c × 500 gallons. 500 is a round ENB assumption near typical U.S. light-duty use; replace with local gallons.
Stacked “everything else”: AAA regular − Tax Foundation state tax − ENB climate ¢. Residual includes crude, federal tax, RFS, blend rules, margins, geography — not a pure refining bar.
Mandate flag: states with LBNL compliance-cost rows or commonly binding RPS/CES; used only for averages/scatter, not as a causal claim.
Red/blue: 2024 statewide presidential winner (FEC): 31 Trump states vs. 19 Harris states plus D.C. (Maine and Nebraska by statewide winner). Simple unweighted averages, not population-weighted.
Jet fuel: No separate statewide jet carbon pass-through series was found comparable to CEC’s gasoline stack. Sustainable aviation fuel and federal RFS/RFS-adjacent credits affect jet differentially by airport fueler; ENB does not invent a 50-state jet table. California LCFS covers some aviation pathways; cents-per-gallon vary by fuel and are not in the CEC gasoline workbook.
Diesel state climate: CA rack disclosure July showed LCFS $0.21 and Cap-and-Trade $0.26 on rack/DTW channels (CEC disclosure) — used as CA diesel climate central. WA diesel uses the diesel emission factor above. OR diesel CPP/CFS ranges are wider; see notes.
Appendix E. Glossary
Cap-and-Invest / Cap-and-Trade: Declining emissions cap with tradable allowances; California and Washington run economy-wide versions affecting transport fuel.
LCFS / CFS / CFP: Low/Clean Carbon/Fuels standards requiring declining fuel carbon intensity; compliance via credits.
RPS / CES: Renewable Portfolio Standard / Clean Energy Standard — share of electricity sales from qualifying resources.
RGGI: Regional Greenhouse Gas Initiative — CO₂ cap for power plants in participating states.
RIN / RVO / RFS: Renewable Identification Number / Renewable Volume Obligation / Renewable Fuel Standard.
CARBOB: California Reformulated Gasoline Blendstock for Oxygenate Blending.
Pass-through: Share of a compliance cost reflected in the retail price.
Gross vs. net RFS cost: Gross = obligation × RIN price; net = gross minus blender RIN subsidy embedded in biofuel blend.
Appendix F. What ENB could not confirm
- A complete official ¢/gal series for Washington CCA comparable to CEC’s monthly California stack (ENB uses auction × emission-factor method).
- Oregon CPP retail pass-through after litigation and program tweaks — ENB relies on DEQ’s 2021 combined CFP+CPP modeling.
- LBNL RPS compliance costs for California in 2024–2025 (cells blank / “no data”).
- A current, sourced cents-per-gallon figure for the CARBOB blend premium alone (EIA says only that it is “more expensive to produce”).
- Whether RGGI Auction 73 was an all-time record (it is above every 2025–26 auction; full history not checked).
- Statewide jet-fuel climate ¢/gal for all 50 states.
- Population-weighted national averages (ENB reports simple state averages where noted).
- How much of RGGI allowance cost hits each household bill after state-specific rebates.
- Center for Jobs OPIS-based California estimates that include sales tax on carbon costs — useful context but OPIS redistribution limits prevented reproducing their full table.