Introduction
Houston, Texas-based Phillips 66 (NYSE: NYSE:PSX) released its third quarter of 2022 on November 1, 2022.
Also, on November 9, 2022, the company held its “investor day 2022,” unveiling PSX’s strategy.
Phillips 66 expects to return an additional $10 billion to $12 billion to shareholders by the end of 2024 through a combination of dividends and share repurchases. Moreover, PSX authorized another $5 billion in shares repurchase.
Finally, over the next three years, the company plans to increase adjusted EBITDA by $3 billion from its acquisition of 87% interest in DCP Midstream, the execution of Rodeo Renewed and other projects, as well as sustainable cost reductions of $1 billion from its Business Transformation.
The main focus is on cost reduction and enhancing the profit margin lagging behind its peers.
On November 9, 2022, PSX cut 1,100 jobs to reduce costs by $500 million. The company said:
Note: This article is an update to my article published on September 21, 2022. I have followed PSX on Seeking Alpha since December 2018.
1 – 3Q22 snapshot and new developments
The company reported third-quarter 2022 adjusted earnings per share of $6.46 from $3.18 a year ago, beating analysts’ expectations. Quarterly solid earnings were due to robust refining margins worldwide.
Quarterly revenues totaled $48,764 million, up from the year-ago quarter’s $31,472 million.
PSX 3Q22 Highlights (PSX Presentation) Note: Mark Lashier is now the new CEO since July.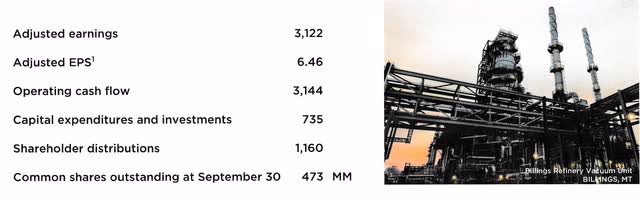
2 – Business description
Phillips 66 operates in four segments (Midstream, Chemical, Refining, and Marketing).
Below are the quarterly earnings per segment:
PSX Quarterly earnings per segment 3Q22 (Fun Trading)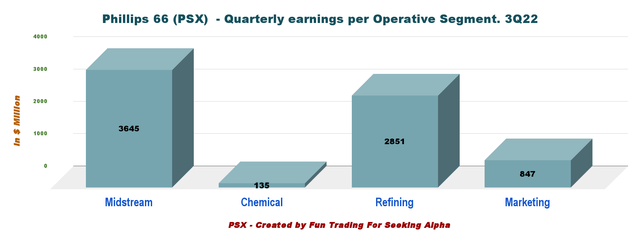
I regularly cover three refiners on Seeking Alpha. Phillips 66, Marathon Petroleum (NYSE: MPC), and Valero Energy (NYSE: VLO).
- You can read my recent article on MPC by clicking here.
- You can read my recent article on VLO by clicking here.
3 – Stock performance
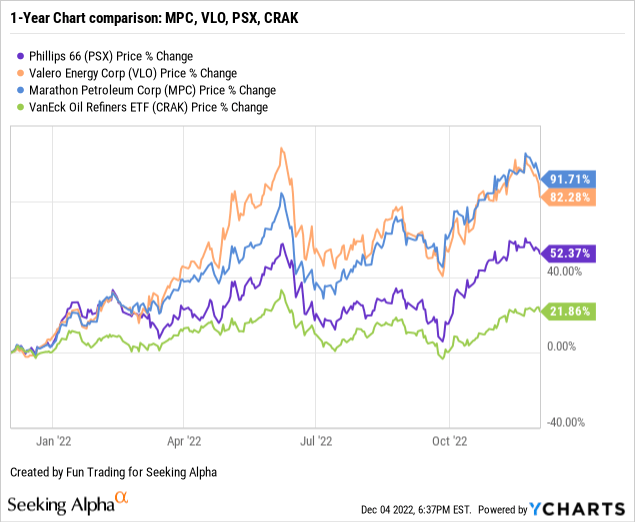
Let’s see how these three refiner stocks are doing compared to the VanEck Vectors Oil Refiners ETF (NYSEARCA: CRAK). Below is the year-to-date chart comparison using my three selected refiners and the VanEck Oil Refiner ETF.
As we can see, PSX has underperformed its peers. PSX is up 52% on a one-year basis, well below MPC and VLO. However, all of them are retracing from recent highs.
4 – Investment Thesis
The investment thesis remains stable. Investors should view PSX as a long-term investment, and continuous accumulation is still the best alternative.
I was not incredibly impressed with the last presentation, but I recognize that the company seems serious about tackling the main challenge of enhancing margins. As I always say, the future is promised to no man, especially in this cyclical and volatile business.
The bottom line is that I wouldn’t say I like seeing a company splurge on share buybacks while reducing CapEx, cutting the workforce, and forgetting about reducing debt. It is counterproductive and shortsighted.
The crucial issue here is the extreme volatility, which requires a particular trading/investing strategy that I promote in my marketplace, “The gold and oil corner.”
Thus, it is essential to trade short-term LIFO and profit from the wild fluctuations attached to this cyclical industry. I recommend using about 40% of your short-term position, keeping a core long-term for a much higher target, or enjoying a steady stream of dividends. PSX pays a dividend yield of 3.64%, which is excellent.
PSX: Dividend comparison MPC, VLO, PSX (Fun Trading)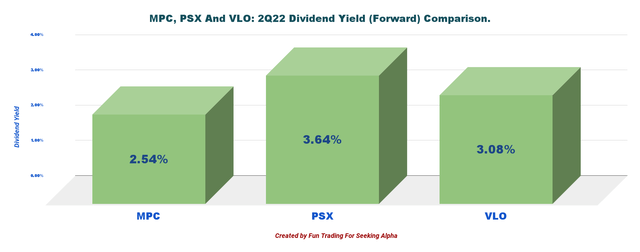
Financials History: The Raw Numbers – Third-Quarter 2022
| Phillips 66 | 3Q21 | 4Q21 | 1Q22 | 2Q22 | 3Q22 |
| Total revenues and other | 30.24 | 32.60 | 36.18 | 48.58 | 44.96 |
| Revenues in $ Billion | 31.47 | 33.57 | 36.72 | 49.31 | 48.76 |
| Net income in $ Million | 402 | 1,271 | 582 | 3,167 | 5,391 |
| EBITDA $ Million | 966 | 2,298 | 1,307 | 4,604 | 7,751 |
| EPS diluted in $/share | 0.91 | 2.88 | 1.29 | 6.53 | 11.16 |
| Operating cash flow in $ Million | 2,203 | 1,800 | 1,136 | 1,783 | 3,144 |
| CapEx in $ Million | 552 | 597 | 370 | 376 | 735 |
| Free Cash Flow in $ Million | 1,651 | 1,203 | 766 | 1,407 | 2,409 |
| Total cash $ million | 2,897 | 3,147 | 3,335 | 2,809 | 3,744 |
| Total LT Debt in $ million | 14,910 | 14,448 | 14,434 | 12,969 | 17,657 |
| Dividend per share in $ | 0.90 | 0.92 | 0.97 | 0.97 | 0.97 |
| Shares Outstanding (Diluted) in Million | 440.4 | 440.7 | 450.01 | 485.04 | 483.04 |
Source: Company filing
Analysis: Revenues, Earnings Details, Free Cash Flow, Net Debt, And Outlook
1 – Revenues were $48.76 billion in 3Q22
PSX Quarterly Revenues history (Fun Trading)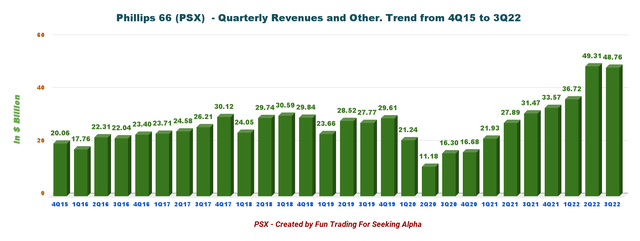
Phillips 66 posted a third-quarter 2022 income of $5,391 million or $11.16 per share. The third quarter’s total costs and expenses rose to $41,203 million from $31,024 million in the same quarter a year ago.
1.1 – Midstream: The company generated adjusted quarterly pre-tax earnings of $645 million, up from $642 million in 3Q21. Higher contributions from NGL boosted the segment.
1.2 – Chemicals: The segment generated adjusted pre-tax earnings of $135 million, down from $634 million in 3Q21. PSX experienced lower contributions from the olefins and polyolefins businesses.
1.3 – Refining: PSX reported an adjusted pre-tax income of $2,827 million compared with $184 million in 3Q21. The segment experienced increased volumes and realized margins.
The segment’s realized refining margins worldwide improved to $26.58 per barrel from the year-ago quarter’s $8.57. However, it was down from $28.31 sequentially.
PSX Quarterly margin per region in 3Q22 (Fun Trading)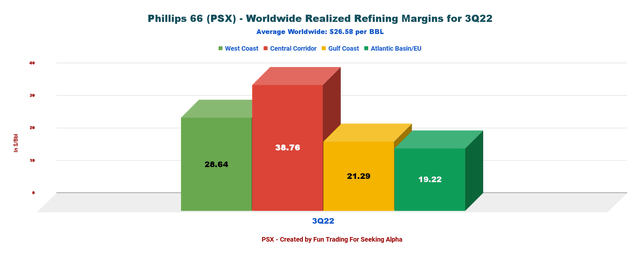
| $/bbl | 3Q21 | 4Q21 | 1Q22 | 2Q22 | 3Q22 |
| West Coast | 7.46 | 15.41 | 17.68 | 33.13 | 28.64 |
| Central Corridor | 12.47 | 12.60 | 7.89 | 26.72 | 38.76 |
| Gulf Coast | 5.75 | 9.19 | 7.71 | 24.80 | 21.29 |
| Atlantic Basin/EU | 9.27 | 11.00 | 11.71 | 30.39 | 19.22 |
| Worldwide | 8.57 | 11.60 | 10.55 | 28.31 | 26.58 |
Source: Fun Trading file.
1.4 – Marketing and Specialties: Pre-tax earnings also dropped to $847 million from $547 million in 3Q21. Realized marketing fuel margins in the USA rose to $2.49/barrel, up from the year-ago quarter of $2.29. The company posted $12.40/barrel in the international markets, up significantly from the year-ago level of $6.75.
1.5 – Outlook 4Q22
PSX 4Q22 Outlook (PSX Presentation)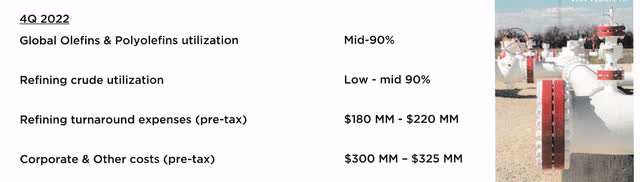
2 – Free cash flow was $2,409 million in 3Q22
PSX Quarterly Free cash flow history (Fun Trading)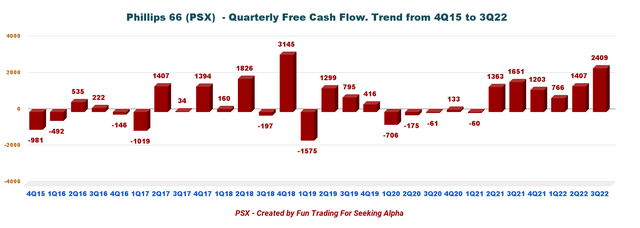
Note: Generic free cash flow is cash from operating activities minus CapEx.
FCF trailing 12-month (“ttm”) was $5,785 million. The third quarter was $2,409 million.
Capital expenditures and investments for the quarter were $735 million, including the company’s $306 million investment in DCP Midstream, LLC, in connection with the merger, net of cash acquired.
The quarterly dividend is now $0.97 per share or a yield of 3.64%.
Also, PSX is repurchasing shares and bought $694 million worth of PSX shares in 3Q22. However, the shares outstanding diluted have decreased only slightly this quarter, with 483.04 million from 485.04 million in 2Q22.
3 – Net debt (consolidated)
PSX Quarterly Cash versus Debt history (Fun Trading)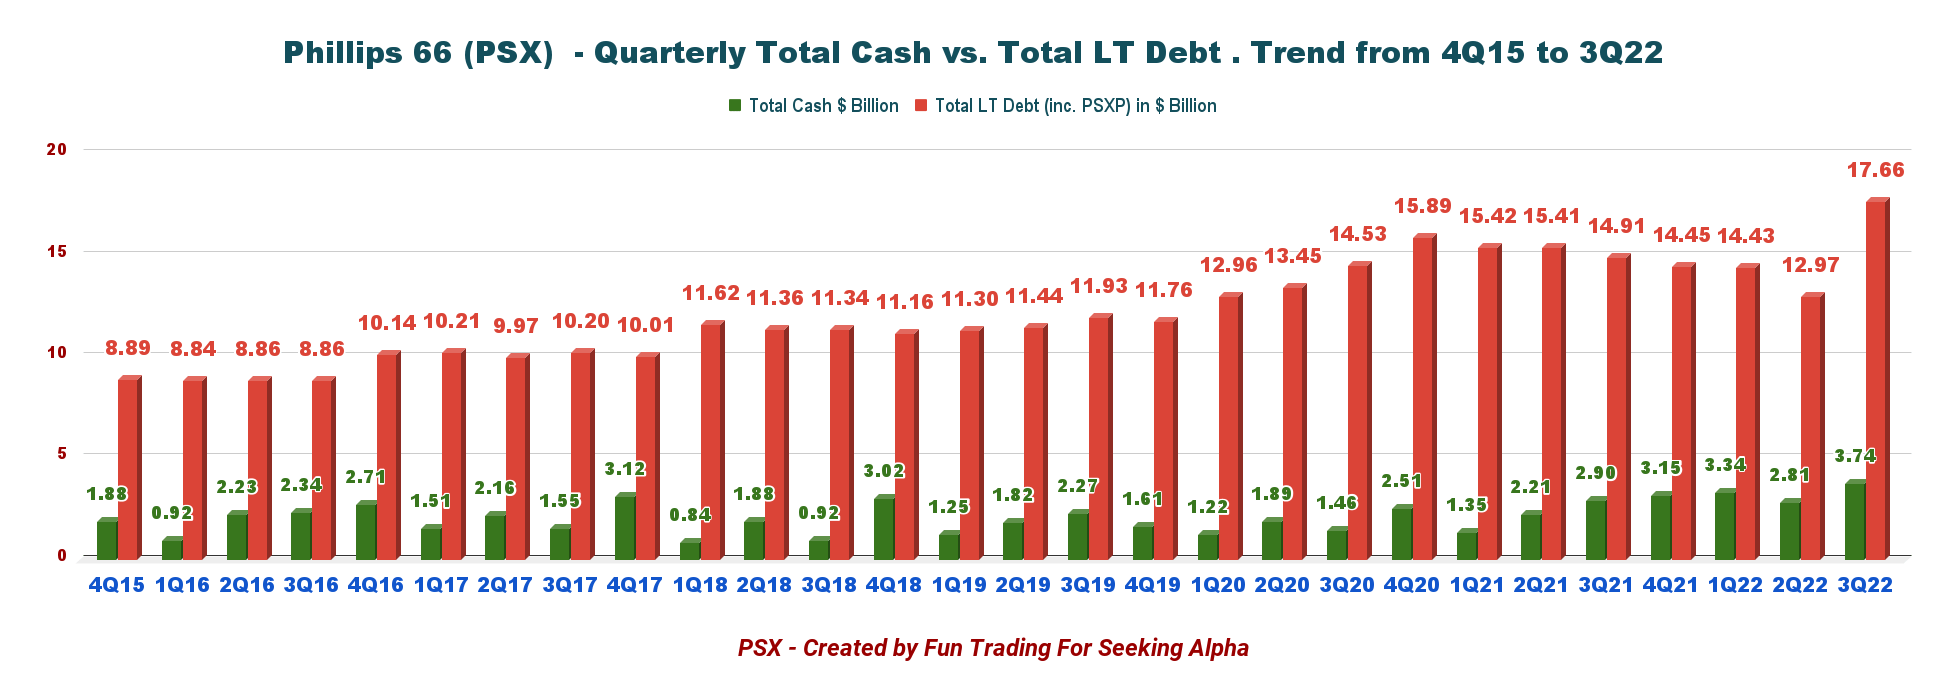
Consolidated debt was $17.66 billion, with a debt-to-capitalization of 35%. As of September 30, 2022, cash and cash equivalents were $3,744 million.
The total liquidity of the company was $10.5 billion.
PSX Balance sheet 3Q22 (PSX Presentation)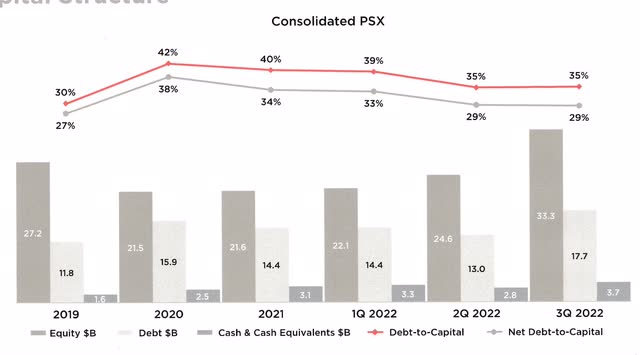
Technical Analysis (short-term) and commentary
PSX TA analysis short-term (Fun Trading StockCharts)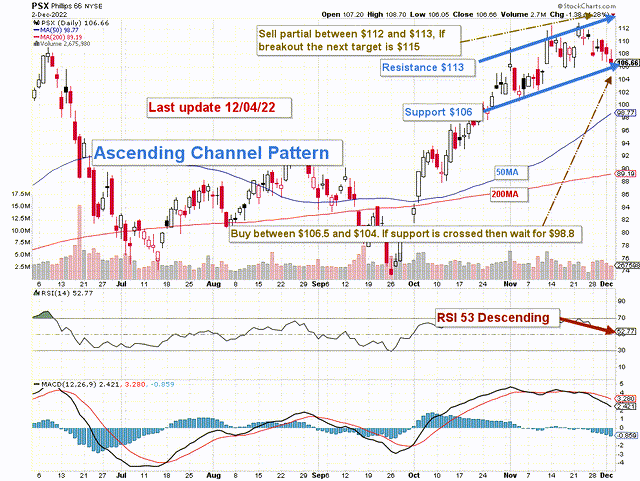
Note: The chart is adjusted from the dividend.
PSX forms an ascending channel pattern with resistance at $113 and support at $106. Ascending channel patterns are short-term bullish moving higher within an ascending channel, but these patterns often form within longer-term downtrends as continuation patterns.
I recommend trading short-term LIFO for about 40% of your total position and keeping your core position for a much higher target while enjoying a substantial dividend of 3.64%.
I recommend selling between $112 and $113 and accumulating again between $106.5 and $104 with potential lower support at $98.8.
Warning: The TA chart must be updated frequently to be relevant. It is what I am doing in my stock tracker. The chart above has a possible validity of about a week. Remember, the TA chart is a tool only to help you adopt the right strategy. It is not a way to foresee the future. No one and nothing can.
Author’s note: If you find value in this article and would like to encourage such continued efforts, please click the “Like” button below to vote for support. Thanks.

Join my “Gold and Oil Corner” today, and discuss ideas and strategies freely in my private chat room. Click here to subscribe now.
You will have access to 57+ stocks at your fingertips with my exclusive Fun Trading’s stock tracker. Do not be alone and enjoy an honest exchange with a veteran trader with more than thirty years of experience.
“It’s not only moving that creates new starting points. Sometimes all it takes is a subtle shift in perspective,” Kristin Armstrong.
Fun Trading has been writing since 2014, and you will have total access to his 1,988 articles and counting.