While the “M” is the last part of the CAN SLIM trading methodology, it is by far the most important rule of timing when to buy stocks. IBD’s studies show that three out of four stocks follow the market direction, so you always want to trade in sync with the market.
If you buy stocks during a market uptrend, you greatly improve your chances of being right. But if you buy as the market indexes are in a downtrend, the odds turn against you, increasing your risk and the likelihood of being wrong.
Market Bottoms: When To Buy Stocks
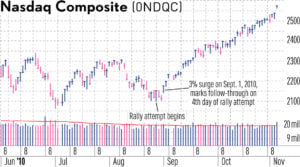
First, let’s illustrate how we get to a confirmed uptrend, which is the time to start buying stocks.
Look for at least one major index to attempt a bottom, ideally the Nasdaq composite or the S&P 500. The first day the index closes higher counts as Day 1 of an attempted rally. On Day 4 and later, you start looking for the index to rise sharply in higher volume than the previous session.
That’s a follow-through day.
The follow-through gives investors the green light to start buying leading stocks breaking out past correct buy points. Sync your trading to the stock market direction by gradually committing capital to leading stocks.
But remember that while no market uptrend has ever begun without one, not every follow-through succeeds.
Market Tops: When To Sell Stocks
Market tops occur over a number of weeks, as institutional investors shift from buying mode into selling mode. The most effective way to track institutional selling is with distribution days.
A distribution day is when the Nasdaq composite or S&P 500 closes down 0.2% or more in volume heavier than the prior day. (Volume does not have to be above average, just higher than the prior day.)
Of course, one day of selling doesn’t necessarily mean that much. But if you start to see a series of distribution days within several weeks, that is cause for concern. It’s an indication that mutual fund managers and other institutional investors are starting to sell more aggressively.
Moving averages are another tool to help understand market direction. Indexes should remain above the 50-day average in an uptrend. A break of the line should be considered a warning sign.
An index move above the 50-day line is a positive sign. Watch for support and resistance at the 50-day line, too. The 200-day line also can be helpful in the longer term.
When a stock market uptrend starts to struggle, IBD’s market outlook will shift to “uptrend under pressure.” It’s time to play more defense than offense. Investors should be careful about buying stocks. If you do decide to buy stocks, focus only on growth stocks showing exceptional fundamental and technical strength.
If institutional selling persists, IBD will downgrade its outlook to “market in correction.” That means all new buys are off the table and be prepared to lock in gains on your existing positions.
How To Find The Market Direction
You can spot these shifts as they happen by regularly checking The Big Picture and Market Pulse.
IBD subscribers receive a close reading on market behavior each day after the market closes in this column. Before the open and during the trading session, the Stock Market Today provides reporting and analysis of the daily market action.
The current market outlook is located in the Market Pulse, published alongside The Big Picture.
Follow Scott Lehtonen on Twitter at @IBD_SLehtonen for how to buy stocks, top stocks to watch and Dow Jones Industrial Average action.
YOU MAY ALSO LIKE:
Top Growth Stocks To Buy And Watch
Learn How To Time The Market With IBD’s ETF Market Strategy
Find The Best Long-Term Investments With IBD Long-Term Leaders
MarketSmith: Research, Charts, Data And Coaching All In One Place
How To Research Growth Stocks: Why This IBD Tool Simplifies The Search For Top Stocks
The post When To Buy and Sell Stocks By Following Stock Market’s Trend appeared first on Investor’s Business Daily.


