

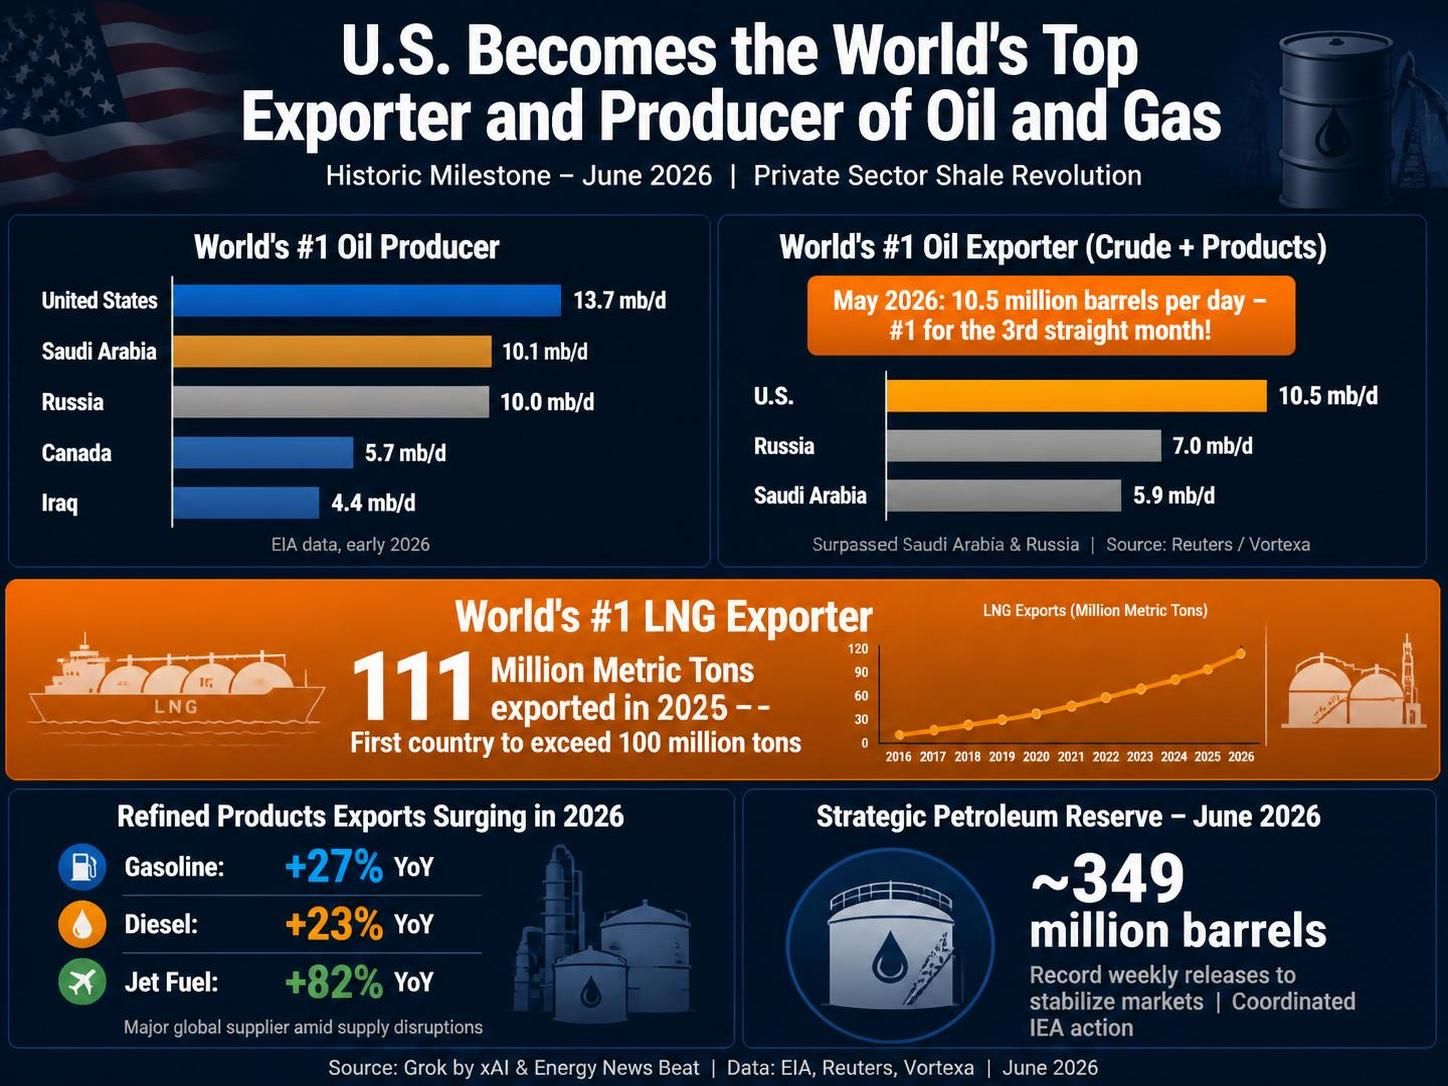
In a landmark development for global energy markets, the United States has officially become the world’s number one exporter of oil (crude + refined products) and maintains its long-standing position as the top producer of both oil and natural gas. This shift, reported in early June 2026, marks a dramatic reversal from decades when the U.S. was a net importer reliant on Middle Eastern supplies.
A recent post on X by @EricLDaugh captured the moment: “ JUST IN: America is OFFICIALLY the NUMBER ONE oil exporter in the entire world thanks to President Trump. The ‘experts’ are STUNNED once again! ‘The U.S. is now the number one exporter and producer of both oil and gas, surpassing Saudi Arabia and Russia.’ ” (with accompanying video).
This achievement stems from the shale revolution, private-sector innovation, record domestic output, and global supply disruptions—including the U.S.-Iran conflict that has hampered Saudi exports through the Strait of Hormuz and sanctions impacting Russian flows.
U.S. Oil Production Leadership
The United States has been the world’s largest crude oil producer for years, thanks to efficient shale plays like the Permian Basin. Latest data (early 2026 / 2025 annualized) confirm this dominance:
|
Rank
|
Country
|
Production (mb/d)
|
Notes/Source
|
|---|---|---|---|
|
1
|
United States
|
13.2 – 13.7
|
EIA Feb 2026; record highs
|
|
2
|
Saudi Arabia
|
9.5 – 10.1
|
OPEC+
|
|
3
|
Russia
|
9.9 – 10.0
|
OPEC+; sanctions impact
|
|
4
|
Canada
|
4.9 – 5.7
|
Oil sands & conventional
|
|
5
|
Iraq / China
|
~4.4
|
Varies by source
|
Sources: EIA, Wikipedia (Jan 2026 data), Visual Capitalist (2025 annualized).
U.S. production has surged from ~5 mb/d in the early 2010s to current records, driven by technology and investment.
U.S. Oil Export Dominance
In May 2026, U.S. exports of crude oil and refined fuels reached approximately 10.5 million barrels per day (mb/d), making the U.S. the world’s top petroleum exporter for the third consecutive month (per Vortexa ship-tracking data reported by Reuters).
Comparisons (May 2026):
United States: 10.5 mb/d
Russia: 7.0 mb/d
Saudi Arabia: 5.9 mb/d
2025 Full-Year Comparison (Vortexa):
Saudi Arabia: ~8.1 mb/d
United States: ~6.6 mb/d
Russia: ~5.8 mb/d
The U.S. has flipped from a net importer to a major swing supplier. Crude oil exports alone have hit record weekly highs (e.g., over 6.4 mb/d in some periods).
Natural Gas & LNG Exports
- 2025 Record: U.S. exported a record 111 million metric tons of LNG — the first country to surpass 100 million tons in a single year.
- Average LNG exports reached ~15 Bcf/d in 2025, with capacity expanding rapidly (new terminals like Plaquemines and Corpus Christi Stage 3).
- Forecast: LNG exports to exceed 16–18 Bcf/d in the coming years.
Top LNG Exporters: United States (leading) > Qatar > Australia.
U.S. LNG provides flexible, market-driven supply to Europe (major recipient amid prior disruptions) and Asia, enhancing global energy security.
Refined Products: Gasoline, Diesel & Jet Fuel
- Total petroleum product exports: ~7.0 mb/d in January 2026.
- Gasoline exports: +27% year-over-year.
- Diesel exports: +23% year-over-year.
- Jet fuel exports: +82% year-over-year (strong international demand).
The U.S. is a reliable supplier of gasoline, diesel, and jet fuel to allies and global markets, helping offset disruptions elsewhere.
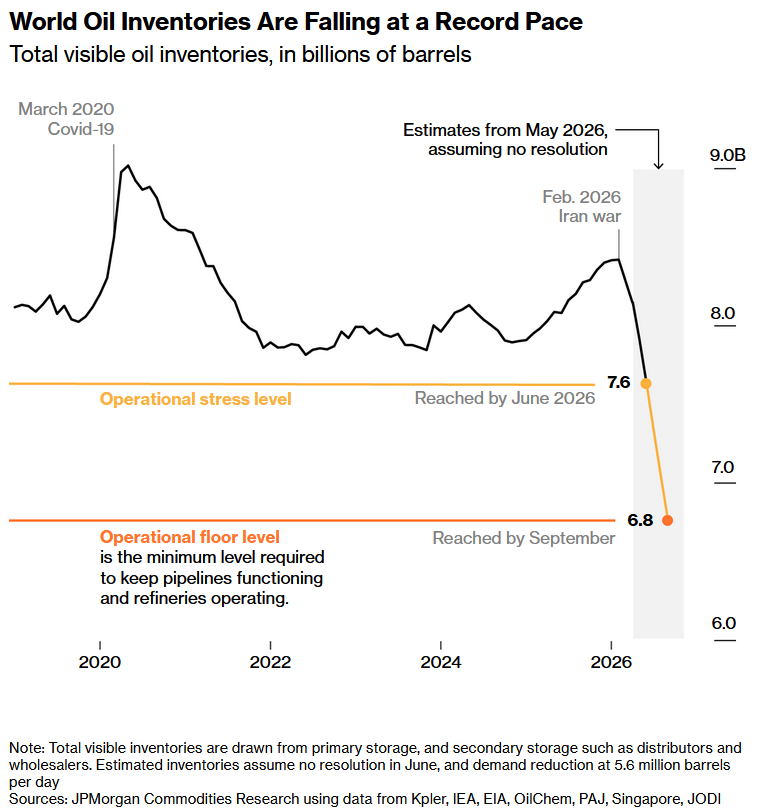
Strategic Petroleum Reserve (SPR) Levels & Drawdowns
Recent Developments:
- Since the U.S.-Iran conflict escalated (around Feb/Mar 2026), the SPR has drawn down by ~50 million barrels (~12%).
- Record weekly drawdowns occurred (e.g., nearly 10 million barrels in one week — the largest on record).
- In March 2026, the U.S. authorized a 172 million barrel release as part of a coordinated IEA effort of 400 million barrels to stabilize markets.
- Historical Context: The SPR peaked near 727 million barrels (near full authorized capacity of 714 million barrels) in the late 2000s–2010s. It was drawn down significantly in 2021–2023 and again in 2026. Current levels are the lowest since the early 1980s in some metrics, raising questions about long-term strategic buffering capacity.
SPR Inventory
Conclusion
The United States has transformed into a global energy superpower — the top producer of oil and natural gas and now the top exporter of petroleum overall. This success is rooted in American innovation, abundant resources, and a market-driven private sector that responds quickly to global needs.
While this boosts U.S. economic leverage, energy security for allies, and export revenues, it also highlights ongoing domestic considerations around fuel prices and reserve management. The shale revolution continues to deliver, positioning America at the center of the world’s energy future.
- Reuters (June 11, 2026): “Once an Arab oil embargo victim, US becomes world’s top oil exporter” — https://www.reuters.com/business/energy/once-an-arab-oil-embargo-victim-us-becomes-worlds-top-oil-exporter-2026-06-11/
- EIA Short-Term Energy Outlook and data: https://www.eia.gov/outlooks/steo/
- Vortexa data (via Reuters)
- Wikipedia: List of countries by oil extraction (Jan 2026 data)
- Visual Capitalist: Top Crude Oil Producers in 2025
- X Post by@EricLDaugh(June 12, 2026): https://x.com/EricLDaugh/status/2065498363189997607
- Energy Department / SPR updates
- Additional reporting from Seeking Alpha, IndexBox, and EIA Today in Energy articles on LNG and exports.
All data is current as of June 2026 reporting. Figures are approximate and sourced from official/government and reputable analytics providers. For the latest weekly updates, check EIA.gov.