
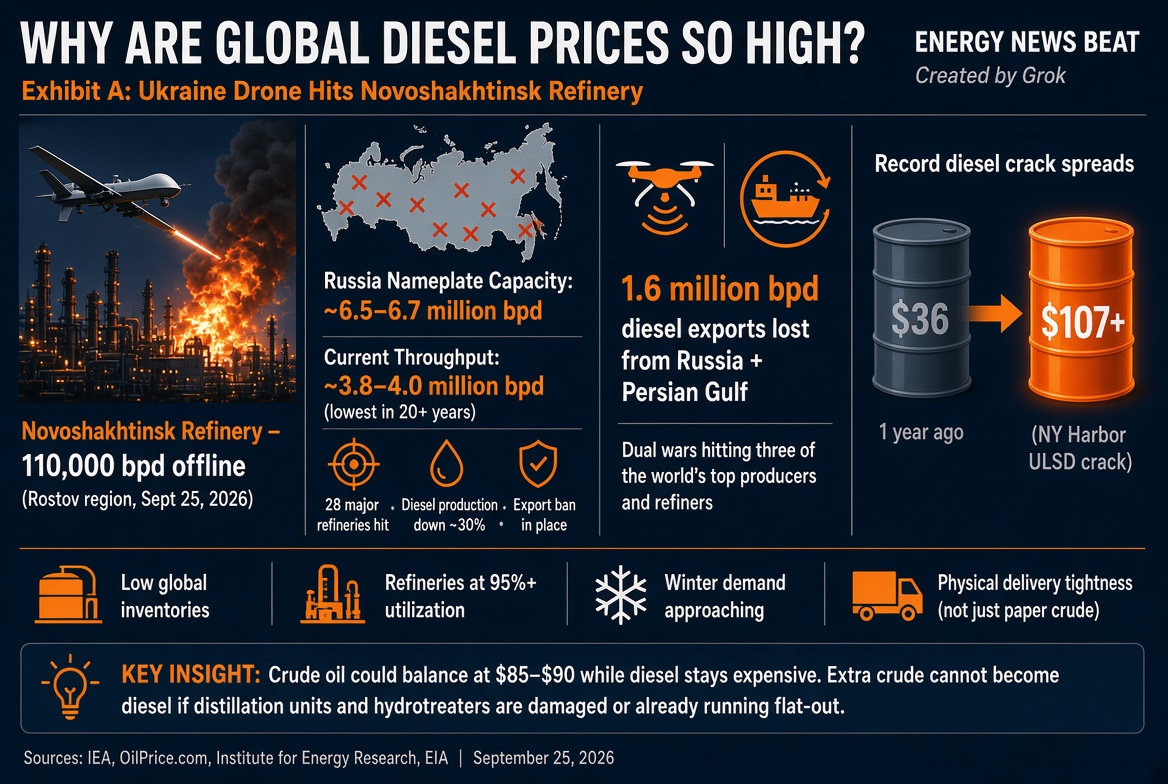
A Ukrainian drone strike on Friday forced Russia’s Novoshakhtinsk refinery in the Rostov region offline, according to regional governor Yury Slyusar. The plant, which processes about 110,000 barrels per day (roughly 5–5.6 million tons per year), is not one of Russia’s giants. It is, however, a clean illustration of why diesel—the workhorse fuel for trucking, agriculture, shipping, rail, and heating—remains structurally tight even when crude prices fluctuate.
This is not an isolated event. It is the latest data point in a campaign that has systematically reduced Russian product output and pulled a major exporter out of the seaborne diesel market.
Russia’s Refining Fleet and the Cumulative Damage
Russia’s installed refining capacity is approximately 6.5–6.7 million barrels per day across more than 30 major plants, making it historically the world’s third-largest refined-products producer after the United States and China.
Throughput has collapsed far below nameplate. In June 2026 it fell to 3.8 million barrels per day—the lowest in more than 20 years and roughly 30 percent below year-earlier levels. The IEA has lowered its outlook for average Russian runs to about 4 million barrels per day for the rest of 2026 and 2027. Diesel production is estimated to have dropped nearly 30 percent versus 2025.
By late August, Ukrainian drones had hit 28 of Russia’s major refineries. Only five large plants, all in eastern Siberia or the Far East and thousands of kilometers from Ukraine, remained untouched. Ukrainian officials have claimed more than 45 percent of projected capacity affected in recent weeks; independent tallies put offline or severely constrained capacity in the 20–33 percent range at various points, with some monitors estimating even higher when earlier damage is included. Repairs to complex units often take six to eight months, and repeated strikes degrade equipment further.
Russia responded by banning diesel exports in July and has moved to extend the ban (initially through September 30, with discussion of October 31) to protect the domestic market and rebuild inventories before winter. Previously, Russia exported roughly half its diesel and gasoil output. Combined Middle East and Russian seaborne diesel exports fell sharply—to 520,000 barrels per day in August in one IEA reading, 75 percent below year-earlier levels.
Novoshakhtinsk itself had been hit before. Its latest shutdown is modest in isolation (~1.6–1.7 percent of nameplate) but adds to a pattern that has already removed millions of barrels per day of product-making capacity from the global system.
The Broader Reasons Diesel Is So Expensive
The Institute for Energy Research and IEA data describe a two-front supply shock. Wars have hit three of the world’s largest oil producers and three of its largest refiners: Russia, Saudi Arabia, and Iran. Net diesel exports from Russia and the Persian Gulf dropped 1.6 million barrels per day from February to August, a large share of seaborne diesel trade.
Gulf refining capacity was also damaged. Estimates of offline Gulf capacity reached 1.9 million barrels per day by early March and as high as 3.5 million barrels per day by May in some assessments. Saudi crude production itself fell to a three-decade low around 6 million barrels per day in August after related disruptions. Heavier, sourer crudes from these regions typically yield more diesel than lighter U.S. shale barrels, so lost barrels from Russia and the Gulf punch above their weight in the middle-distillate market.
Inventories have not been able to absorb the shock. U.S. distillate stocks have been running well below the five-year average and at multi-decade seasonal lows. European middle-distillate stocks hit an 18-year low earlier in the year; the Amsterdam-Rotterdam-Antwerp hub has been tight. Global oil inventories drew hundreds of millions of barrels over several months. The U.S. Strategic Petroleum Reserve sits at levels last seen in the early 1980s. U.S. refiners have been running at 95 percent-plus utilization for extended periods—the longest such stretch in decades—while the United States itself lost roughly 400,000 barrels per day of refining capacity in recent years.
Demand has not disappeared. Trucking, freight, farming, mining, and marine bunker use remain resilient. Winter heating demand is approaching. Shipping-lane risks in the Red Sea and fears around the Strait of Hormuz add a physical-logistics premium.
The result is visible in crack spreads. The New York Harbor ultra-low-sulfur diesel crack versus crude reached $107.90 per barrel in the week of September 11—triple the year-earlier level of about $36. Other readings put diesel cracks above $100 and, in some snapshots, above $117 per barrel. Heating-oil and diesel futures have dramatically outperformed crude.
We will be looking to get Thomas Pyle, President of the Institute for Energy Research, David Blackmon, Forbes, Daily Caller and Substack author, and Stu Turley, Energy News Beat podcast host, on an episode to cover this.
Why Crude Could Ease Toward $85–$90 While Cracks Stay Wide
Crude and refined products are related but not the same market. Crude is more fungible. Diesel is a specification-sensitive physical commodity that must be produced by specific units (crude distillation, hydrotreating, hydrocracking) and delivered to specific locations.
Paper crude can trade lower if:
- Global demand growth slows (both IEA and OPEC have repeatedly trimmed 2026 demand forecasts).
- U.S. and other non-OPEC supply remains robust.
- Geopolitical risk premia on raw barrels fade on diplomatic news.
- High product prices begin to destroy some demand.
That is the $85–$90 balancing argument: an equilibrium crude price that reflects adequate-to-ample raw oil availability once the war-risk premium compresses. Brent recently traded in a wide band, settling near $105 on September 25 after spikes above $107–$109, with WTI often $10 or more cheaper. The market has already shown it can rally hard on tanker or infrastructure headlines and sell off on de-escalation talk.
Products cannot rebalance as quickly. Damaged Russian and Gulf distillation capacity cannot be rebuilt in weeks. Export bans keep barrels inside Russia. High utilization leaves little spare capacity elsewhere. Physical delivery in key hubs (New York Harbor, U.S. Gulf, ARA, Singapore) therefore commands a large premium over the futures strip. That premium is the crack spread.
In short: extra crude sitting in tanks or on the water does not automatically become diesel at the pump or the loading rack if the refineries that convert it are offline or already maxed out. Physical tightness in middle distillates can persist even if the crude balance looks less alarming on paper. High cracks are the market’s way of rationing scarce diesel and paying refiners who can still run.
Until Russian plants are repaired and exporting again, Gulf capacity is restored, and shipping lanes normalize, diesel will remain the tightest part of the barrel. Novoshakhtinsk is only the latest exhibit.
Making Appendices Great Again
Check out the World’s Greatest Podcast Show Notes at EnergyNewsBeat.co or EnergyNewsBeat.com.
Appendix: Sources and links
Primary articles requested
- OilPrice.com: Ukraine Drone Strike Knocks Out Russia’s Novoshakhtinsk Refinery — https://oilprice.com/Latest-Energy-News/World-News/Ukraine-Drone-Strike-Knocks-Out-Russias-Novoshakhtinsk-Refinery.html
- Institute for Energy Research: Why Are Diesel Prices So High? — https://www.instituteforenergyresearch.org/fossil-fuels/gas-and-oil/why-are-diesel-prices-so-high/
Russian refining capacity, throughput, and attacks
- IEA commentary: Russian refining sector struggles amid intensifying Ukrainian attacks — https://www.iea.org/commentaries/russian-refining-sector-struggles-amid-intensifying-ukrainian-attacks
- YCharts / Energy Institute Statistical Review: Russia oil refinery capacities — https://ycharts.com/indicators/russia_oil_refinery_capacities
- Energy Intelligence and related reporting on offline capacity
- Kyiv Post / Ukrainian General Staff claims and independent tallies
- Reuters: Russia’s Novoshakhtinsk oil refinery suspends operations — https://www.reuters.com/world/europe/russias-novoshakhtinsk-oil-refinery-suspends-operations-after-drone-attack-2026-09-25/
- bne IntelliNews missile/war monitor (refinery strike table)
- Energybase.ru plant profile (Novoshakhtinsk ~5.6 mtpa)
Diesel market tightness, inventories, and cracks
- IEA, EIA, Energy Factbook data cited in the IER piece
- FreightWaves, RBN Energy, James Investment on crack-spread inflation
- EIA distillate stock and crack-spread pages
- Bloomberg, Reuters, Euronews reporting on Russia’s diesel export ban
Crude prices and outlook
- TankerMap, Trading Economics, Investing.com, MarketWatch Brent/WTI snapshots around 25 September 2026
- IEA and OPEC monthly reports trimming 2026 demand growth
- Commerzbank and other bank notes on crude versus product forecasts
All figures on capacity, throughput, and cracks are drawn from the sources above and can shift with new strike assessments or official data releases. Russian official statistics on refining have been restricted, so independent satellite, loading, and industry-source estimates are used throughout.