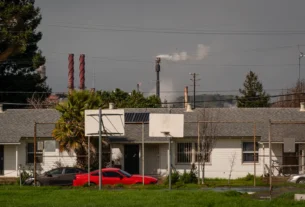
The Iran war that began around February 28, 2026, with U.S.-Israeli strikes and subsequent Iranian responses, has reshaped OPEC+ crude production and, more sharply, refined product exports. Pre-war levels (roughly February 2026) represented a relatively stable baseline after earlier OPEC+ quota management. Current output remains under significant stress from Strait of Hormuz disruptions, infrastructure attacks, shipping risks, and secondary effects such as Russian refinery damage from Ukrainian strikes. Crude has recovered more than products, leaving diesel, jet fuel, and, to a lesser extent, gasoline markets tighter than the headline crude numbers suggest.
Pre-War Production Baseline
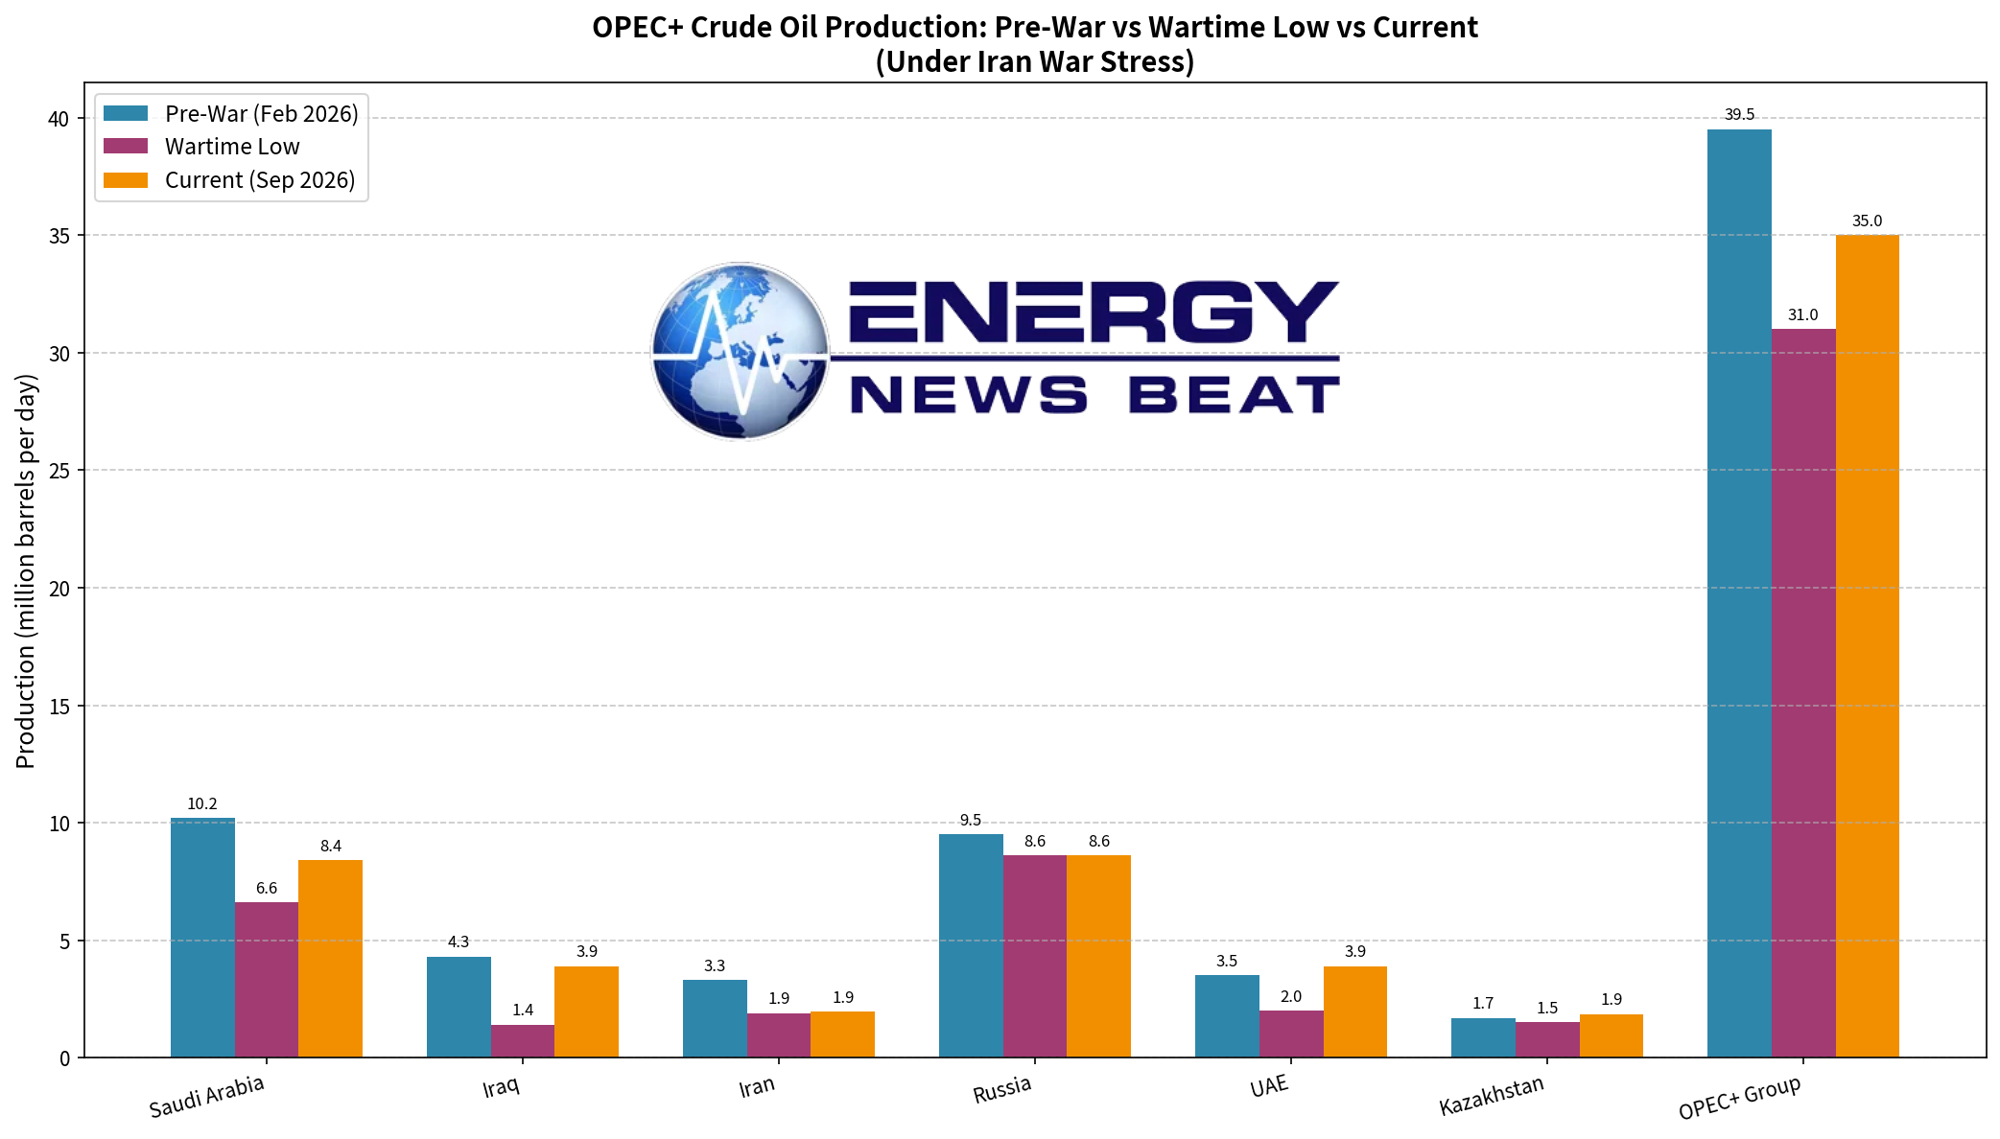
Before the conflict, OPEC+ (including the UAE at the time) crude output hovered in the high 30s to low 40s million barrels per day (mb/d) range depending on the exact measurement and inclusion of all partners. Jack Prandelli’s analysis of monthly data (posted October 14, 2026) put the group near 39.5 mb/d, with Saudi Arabia around 10.2 mb/d, Iraq 4.3 mb/d, the UAE 3.5 mb/d, and Iran near 3.3 mb/d. Secondary sources and OPEC reporting for early 2026 showed Saudi production in the 10+ mb/d area as the kingdom ramped contingency volumes ahead of potential disruptions. Russia was higher than current levels, while producers such as Kazakhstan and Venezuela operated closer to or above quotas in some periods.
OPEC+ had paused planned output increases for early 2026 due to seasonality, with required production levels for the core eight members set in the low-to-mid 30s mb/d range collectively under the then-prevailing quotas. The UAE was still inside the group; it later exited OPEC in May 2026.
Current Output Under Stress (September 2026 Data)
OPEC’s October 2026 Monthly Oil Market Report showed OPEC+ crude production averaging 39.07 mb/d in September, up roughly 900,000 b/d from August and the wartime high. Secondary sources put OPEC members near 25.1 mb/d. This remains well below pre-war February levels for key Gulf producers—estimates of the shortfall for core members have ranged from about 3 to 5 mb/d or more depending on the exact baseline and whether the UAE is included.
Country-level picture from Prandelli’s summary and corroborating reports:
- Saudi Arabia: Dropped sharply (to the mid-6s mb/d range in the early war months) before recovering. It reported 8.372 mb/d in September (up more than 2 mb/d month-on-month after an East-West pipeline attack disrupted Red Sea routes), still short of its ~10 mb/d pre-war pace. Loadings from Gulf terminals and bypass routes supported the rebound.
- Iraq: Fell as low as ~1.4 mb/d early on; recovered to ~3.9 mb/d in September, approaching pre-war levels through aggressive discounting and shuttle arrangements.
- Iran: Production fell from ~3.3 mb/d toward 1.9–2.0 mb/d. U.S. naval blockade drove exports to near zero in September.
- UAE: Exited OPEC in May 2026 and has produced near or above its prior levels (~3.9 mb/d recently), free of the quota system.
- Russia: Output around 8.6 mb/d and sliding, pressured by Ukrainian drone strikes on refineries and infrastructure; a diesel export ban was extended.
- Kazakhstan: Continued pumping above quota (~1.85 mb/d).
- Venezuela: Climbed toward 1.15 mb/d, its highest in years under the prevailing conditions.
OPEC+ has kept November targets steady, reflecting that many prior “hikes” stayed largely on paper because Gulf members could not reliably export. Capacity reviews needed for 2027 quotas have been delayed by uncertainty over war damage and future potential. Gulf exports have fluctuated at 60–80% of normal in recent months.
Refined Product Exports: Gasoline, Diesel, and Jet Fuel
Crude and condensate flows from the Gulf (excluding Iran) recovered more strongly than products. Vortexa data showed total crude + condensate + refined fuels + LPG averaging 19.2 mb/d in September from Saudi Arabia, Kuwait, Qatar, Oman, Bahrain, Iraq, and the UAE—about 81% of the pre-war ~23.6 mb/d average. Crude and condensate alone reached ~91% of their ~16.3 mb/d pre-war level, aided by pipelines (Saudi East-West to Yanbu, UAE to Fujairah), ship-to-ship transfers, and Hormuz shuttle arrangements. Kpler and other trackers confirmed substantial crude rebounds, with Saudi loadings rising sharply (e.g., toward 6+ mb/d).
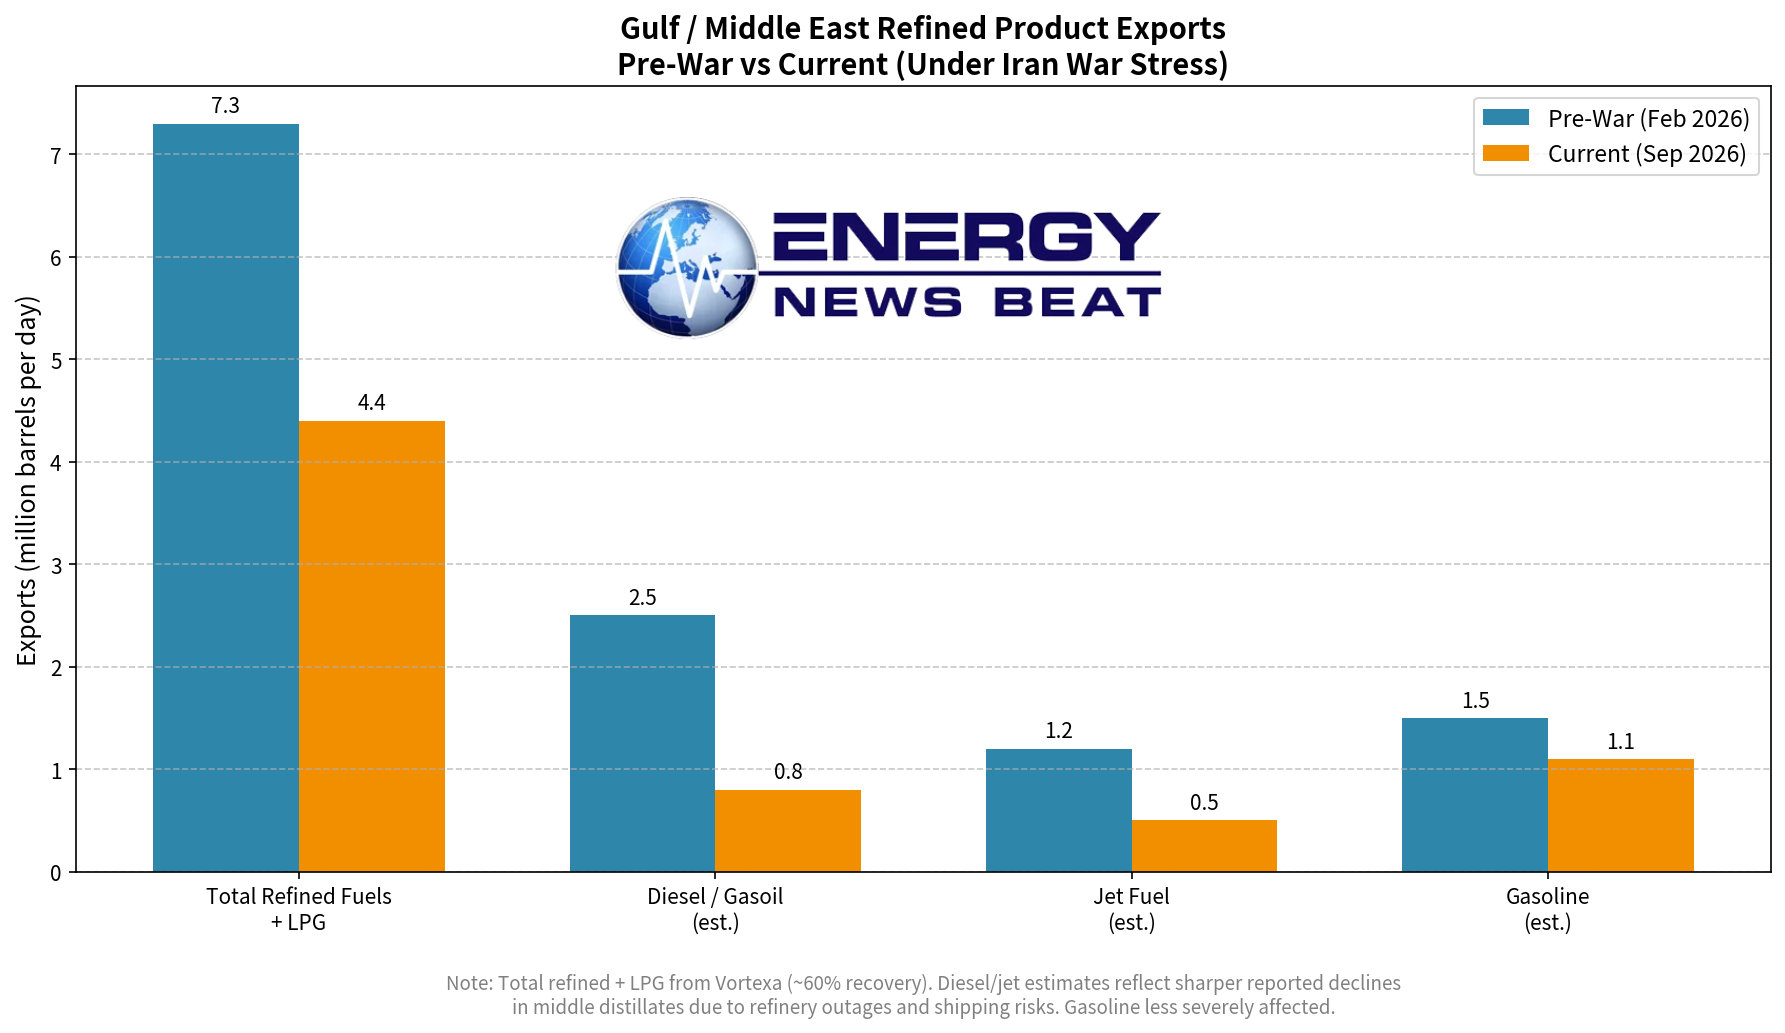
Refined fuels (including LPG) lagged at only ~60% of the pre-war ~7.3 mb/d level. IEA and market analyses put Middle East refined product exports at roughly half or less of pre-war volumes in recent months (one estimate ~1.9 mb/d versus a higher pre-war baseline near 4.7 mb/d for products). Diesel and jet fuel have been hit hardest:
- Net Gulf diesel/gasoil exports fell to levels such as ~390,000 b/d in August (roughly a quarter of pre-war in some measures).
- Combined Middle East + Russian losses have removed on the order of 1.3 mb/d or more from global diesel/gasoil supply in recent periods, with global diesel exports down ~700 kb/d year-on-year.
- Jet fuel and other middle distillates face similar constraints from offline refining capacity (attacks on facilities including Saudi Jazan ~400 kb/d, Bahrain Sitra, and others; estimates of ~2+ mb/d of regional refining capacity unavailable at points) and higher shipping risks for flammable products.
- Gasoline has also tightened but generally less severely than diesel and jet in the available tracking.
The result has been record or near-record diesel and jet prices in several markets, elevated refining margins, and a shift in the market bottleneck from crude availability toward refining and product logistics. U.S. and other Atlantic Basin refiners have partially filled the gap, but global product trade remains disrupted. Asian refiners have gained relative advantage from available crude and strong product cracks.
Outlook and Market Implications
September’s rebound shows resilience through bypass routes and operational adaptations, but it is fragile. October saw elevated ship attacks, and sustained high flows through Hormuz remain uncertain. OPEC+ targets are increasingly theoretical while physical exports and refining stay constrained. Cumulative supply losses from the region have been large (hundreds of millions of barrels), and demand forecasts have been revised (OPEC cut 2026 growth expectations while raising the 2027 view on the need to rebuild inventories).
Crude can move more readily via workarounds; diesel, jet fuel, and gasoline cannot. As long as refining capacity and product logistics lag, product markets—and the inflation they feed into transportation, industry, and aviation—will remain under stress even if crude production numbers improve further.
Check out the World’s Greatest Podcast Show Notes at EnergyNewsBeat.co or EnergyNewsBeat.com. And subscribe to: The Energy News Beat Substack.
Appendices
At Energy News Beat we Make Appendices Great Again.
- Jack Prandelli X post (country-by-country OPEC+ output analysis and chart): https://x.com/jackprandelli/status/2110422729488773424
- OPEC Monthly Oil Market Report context (September production 39.07 mb/d, Saudi 8.372 mb/d): Reuters summaries such as https://www.reuters.com/business/energy/opec-raises-2027-oil-demand-view-citing-need-rebuild-stocks-2026-10-13/ and related coverage
- Gulf flows recovery (Vortexa/Kpler 81% total, 91% crude, 60% products): Reuters https://www.reuters.com/business/energy/gulf-oil-flows-rise-average-81-pre-war-rate-september-data-shows-2026-10-06/ and related reports
- IEA Oil Market Report insights on product exports, diesel tightness, and Hormuz: IEA October 2026 report references in market coverage
- Additional tracking and analysis: World Ports Organization summaries of Vortexa/Kpler data; Energy Intelligence and other secondary source assessments of wartime production highs
- Broader product market context (diesel/jet lags, refining outages): Coverage from OilPrice.com, SCMP, TD Economics, and related market reports citing IEA/Kpler/Vortexa
- OPEC+ quota and meeting decisions: Reuters and OPEC statements on November targets remaining steady and capacity review delays
- Historical pre-war baselines: OPEC reporting on February 2026 Saudi production/supply and secondary source surveys
All figures are approximate and subject to revision as secondary sources, official communications, and tracker methodologies differ slightly. Data current as of mid-October 2026.