
Brent closed Friday at $109.86 and the futures market prices $100 oil into spring. Gas costs about nine times more in Europe and Asia than at Henry Hub, the U.S. benchmark, coal demand is headed for a record, and five of the world’s eight oil chokepoints have trouble. Here is what it means for your wallet, and why energy security starts at home.
By Stuart Turley, host of the Energy News Beat podcast • Published Oct. 18, 2026 • Data Oct. 16 settlements; AAA as of 8:25 a.m. CT Sat., Oct. 17, 2026 • Analysis and opinion: Stu’s views are labeled • Not investment advice
As of 8:25 a.m. CT Saturday, Oct. 17 (AAA national averages)
Fill a 30-gallon pickup with diesel this weekend and you will hand over about $190. A year ago the same tank cost about $109. A 15-gallon fill of regular is about $65, up from $46 (AAA; ENB calculations). The national diesel average is $6.33 a gallon, up $2.69, or 74%, in a year and 20 cents under the Sept. 22 record. Regular is $4.31, up $1.26 (AAA).
If you heat with oil, EIA expects your winter bill to run about 21% higher than last year. If you heat with natural gas, as about half of American homes do with gas or propane, EIA expects you to spend a little less. Homes on electric heat, about 40% of the country, are expected to spend about 4% more (EIA). Same country, same crisis, opposite results. That gap is the story of this whole deep dive. The fuels we have to import through a war zone are expensive. The fuel we produce at home is not.
So here are the four questions readers keep sending us. How long does $100 oil last? How do gas and LNG markets rebalance? Is coal really back? And which shipping chokepoints should you watch? We pulled the latest numbers from the EIA, IEA, OPEC, the big banks, ship trackers and market data, and we flag where they disagree.
| The 60-second version
Oil: Brent settled at $109.86 Friday, up 3.7%. The futures curve holds above $100 through the March 2027 contract. EIA sees Brent under $100 from December and $84 for 2027. Morgan Stanley says $105 this quarter; Goldman says $90 by December; Citi’s September call was $70. Hormuz: transits are still about 70% below pre-war levels, with 12 attacks last week. Oil flows through the strait recovered to 10.9 mb/d in September, about half of the pre-war 20.9 mb/d (ENB comparison). Gas and LNG: Asian LNG hit $29.30 per million Btu, the highest since December 2022. Europe’s TTF is about $28.77 (ENB conversion). That is about nine times more than at Henry Hub, the U.S. benchmark, at $3.12. Qatar’s October LNG exports are on track for just 0.6 Mt. Coal: world demand is headed for a record 8.94 billion tonnes this year. Newcastle coal is $150.40 a tonne, near its 52-week high. Made in USA: crude exports are averaging 4.26 mb/d this year, up about 10%. LNG exports are forecast at 17.6 Bcf/d, up 16%. About 21.5 Bcf/d of new U.S. LNG capacity is online, building or sanctioned (ENB tally). Bottom line (ENB read): plan on roughly $100 oil through the winter. Getting below $90 for long takes an open Strait of Hormuz, and nobody can promise that date. |
Part 1. How long will $100 oil last?
Where Brent has been
As of Oct. 16 settlement (futures); Oct. 14 (EIA Dated Brent spot)
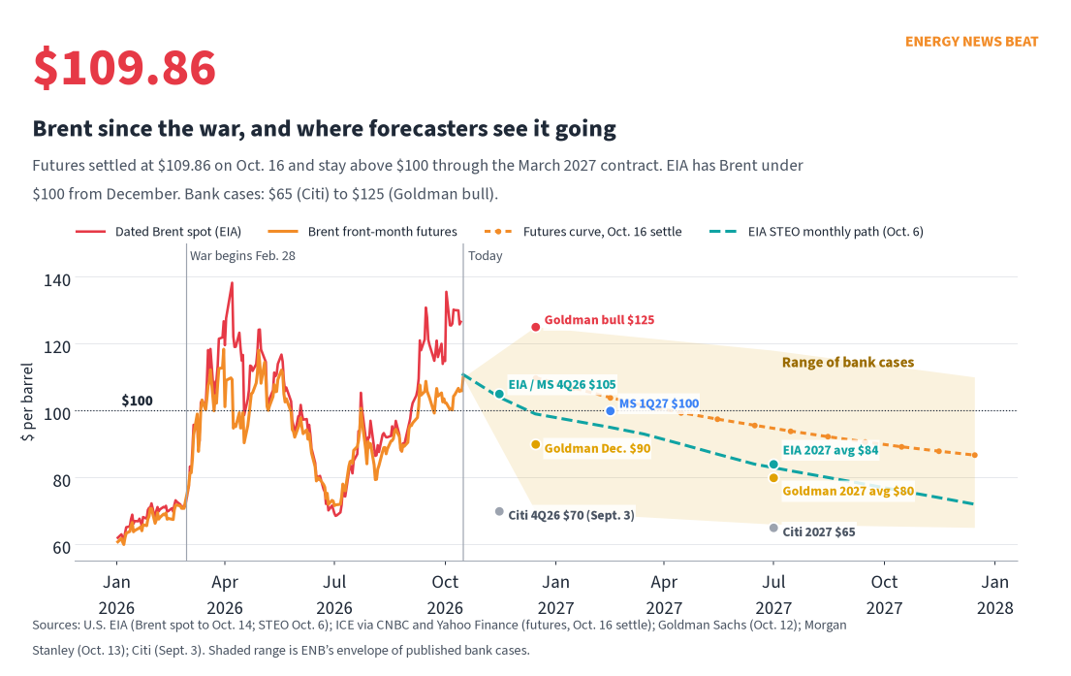
On Feb. 27, the last trading day before the war, Dated Brent closed at $71.32 (EIA). The next day U.S. and Israeli strikes on Iran began the war, and on March 2 Iran’s Revolutionary Guard announced it was closing the Strait of Hormuz (Anadolu; WorkBoat). Spot Brent passed $100 on March 12 and peaked at $138.21 on April 7. An April ceasefire and a June framework deal pulled it all the way down to $68.53 on July 2 (EIA).
Then it came back. September attacks on Saudi Arabia’s East-West pipeline and a jump in tanker attacks sent prices up again (IEA; Kpler). Physical Dated Brent was $126.55 on Oct. 14, and the IEA said it was trading around $134 when it wrote its October report (EIA; IEA). Spot Brent has closed at $100 or more on 82 of 158 trading days since March 1 (ENB count from EIA data).
Futures, the price most headlines quote, are lower than physical oil because they are for later delivery. December Brent settled Friday at $109.86, up $3.94, the first $110 touch since May (CNBC; The National). WTI for November settled at $101.41, up $3.44 (CNBC). The Wall Street Journal tied Friday’s jump to Ukraine’s renewed strikes on Russian refineries as well as Hormuz risk (WSJ). Brent futures are up about 81% this year (Yahoo Finance; ENB calculation).
What the futures curve is telling you
As of Oct. 16 settlements, checked 8:24 a.m. CT Oct. 17
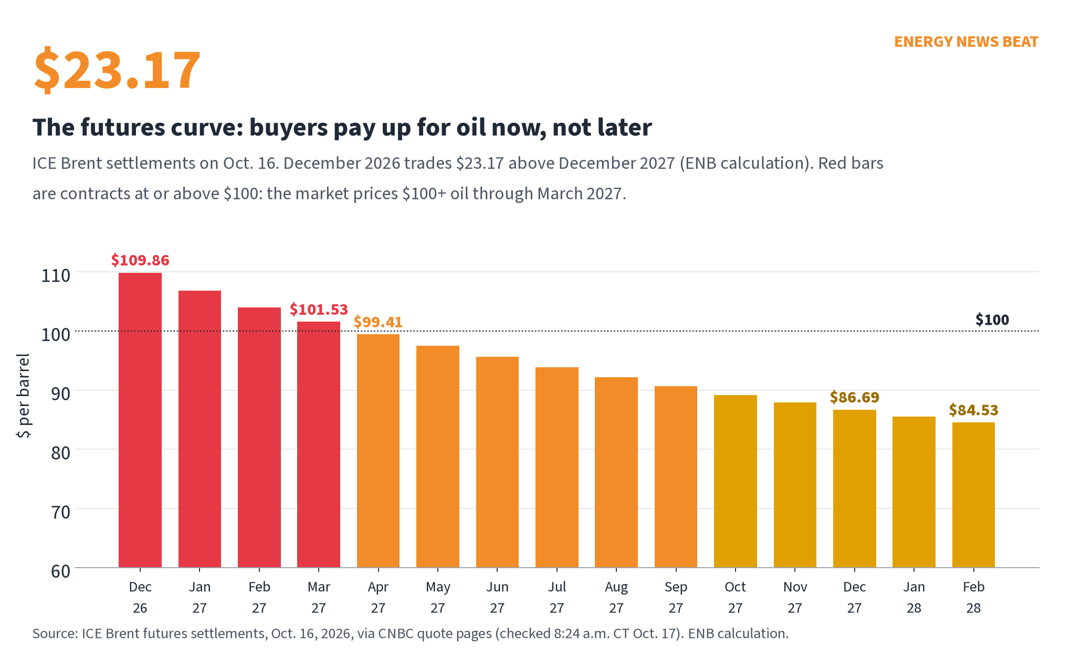
The cleanest answer to “how long” is the futures curve. Traders will pay $109.86 for December 2026 oil but only $86.69 for December 2027. That $23.17 gap is called backwardation: the market pays a big premium for barrels now because there are not enough of them now (CNBC; ENB calculation). Every contract through March 2027 ($101.53) is above $100. April 2027 is the first one under, at $99.41.
OPEC’s own monthly report shows how tight the front of the curve got. In September the gap between the first and third Brent contracts averaged a $8.24 backwardation, and first-to-sixth averaged $15.08 (OPEC).
Two cautions. Futures are prices, not forecasts, and they have been wrong in both directions this year. And the curve already assumes things get better. If Hormuz stays as it is, a falling curve can be pulled back up.
What the forecasters say, with dates
Forecasts age fast in a war, so here is each one with the date it was made.
| Forecaster (date) | 4Q26 Brent | 1Q27 | 2027 avg | What drives it |
| U.S. EIA STEO (Oct. 6; forecast done Oct. 1) | $105 | $95 | $84 | Under $100 from December; assumes 4.5 mb/d of Middle East output still shut in during 4Q; 2027 raised from $74 |
| Morgan Stanley (Oct. 13) | $105 | $100 | — | Raised from $100/$95; costly freight favors short-haul Brent; Gulf exports within 10% of pre-war |
| Goldman Sachs (Oct. 12) | $90 (Dec.) | — | $80 | Raised from $85; bull case $125, bear case low $70s; sees “significant upside risk” from the Iran war |
| Citi (Sept. 3) | $70 | — | $65 | Reopening turns the market to surplus; the latest Citi call ENB could find |
The agencies agree on the direction and disagree on the size. The IEA says 2026 world oil demand falls 2.6 mb/d to 102.4 mb/d, and the market stays “in deficit through the end of the year” before “any eventual surplus emerges in 2027” (IEA). OPEC still has demand growing 0.2 mb/d this year, to 105.7 mb/d (OPEC; Enerdata). That is a gap of more than 3 million barrels a day between the two (ENB comparison; the two count demand on different bases). OPEC speaks for producers; the IEA speaks for importing countries. Read both with that in mind.
Three roads from here
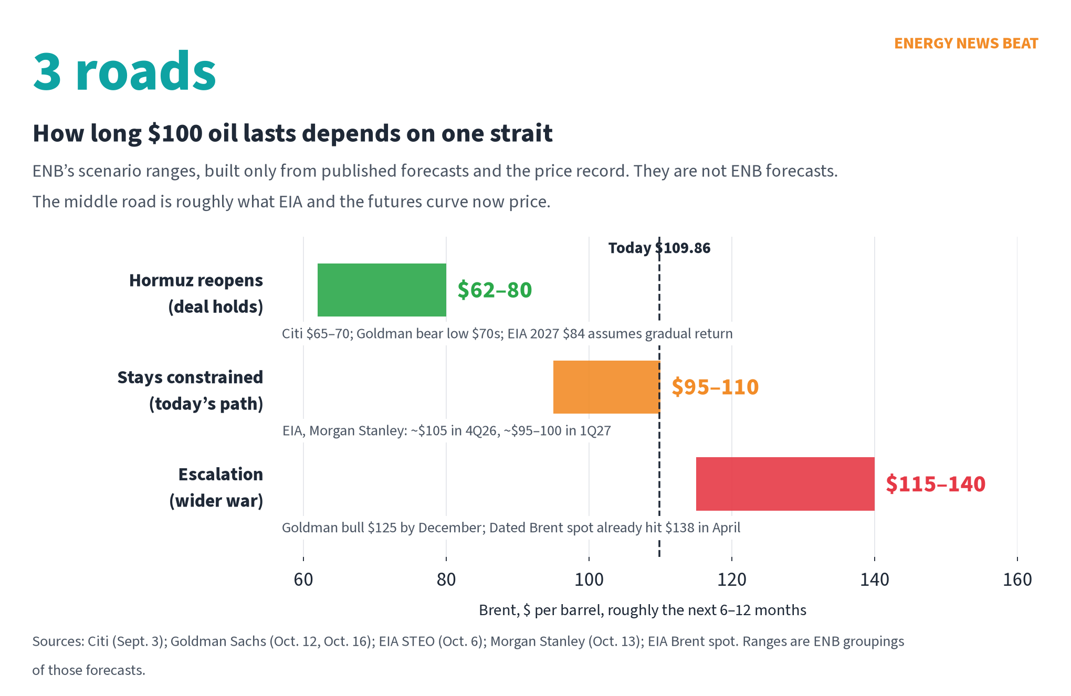
We grouped the published forecasts into three scenarios. These are ENB groupings, not ENB forecasts.
- Road 1: Hormuz reopens and the deal holds ($62–80). Citi sees $70 this quarter and $65 next year if flows normalize, because the world swings to surplus (Citi). Goldman’s bear case is in the low $70s (Yahoo Finance). QatarEnergy’s CEO says LNG could return to normal “within weeks” of a reopening, though damaged trains take years (Baird Maritime). Julius Baer’s Norbert Rucker already argues that “we are not running out of oil, as flows out of the Middle East have largely recovered” (The National).
- Road 2: Stays constrained ($95–110). This is today’s path and roughly where EIA, Morgan Stanley and the futures curve sit: about $105 this quarter and $95–100 early next year (EIA; Morgan Stanley). Kpler’s ship tracking shows why. In preliminary figures (Kpler says early counts are usually revised up 1.5 to 2 times), oil cleared through Hormuz at about 68% of its pre-war baseline in the week to Oct. 13, and tanker crossings averaged 13 a day versus 50 before the war (Kpler).
- Road 3: Escalation ($115–140). Goldman’s bull case is $125 by December (Yahoo Finance). Spot Brent has already been to $138 (EIA). On Saturday, Al Jazeera reported that the U.S. and Iran are both claiming control of the strait amid new attacks on ships (Al Jazeera), and Kpler reported a strike on Aramco’s Dhahran headquarters on Oct. 13 (Kpler).
The shock absorbers: spare capacity, stock releases and demand
As of IEA Oil Market Report, Oct. 14; EIA weekly data for the week ending Oct. 9; IEA statement Oct. 15
Spare capacity is stuck behind the strait. On paper Saudi Arabia can pump 12.11 mb/d; it produced 8.3 mb/d in September. But the IEA puts *effective* spare capacity for all of OPEC+ at just 0.27 mb/d (IEA). Our reading: the idle Gulf barrels are not much use while they have to sail through a war zone. Gulf crude exports did recover to 13.9 mb/d in September, more than 75% of pre-war, helped by 5.6 mb/d of pipeline bypass exports (IEA). That is more than EIA’s 4.7 mb/d estimate of normal bypass pipeline capacity (EIA), so those routes look maxed out. (The two agencies measure different things: the IEA figure counts all bypass exports, which can include other ports and trucking.)
Emergency stocks are a bridge, and the bridge is getting short. IEA members have released about 330 million barrels since March, with about 100 million to go, including 20 million-plus barrels of diesel “as soon as possible” (IEA; ENB). The U.S. Strategic Petroleum Reserve is down to 283.0 million barrels, from 407.7 million a year ago (EIA). EIA expects it to fall to about 243 million by December before refilling starts in mid-2027 (EIA). Even with the releases, world inventories were 509 million barrels below pre-war levels at the end of September, and on-land stocks are the lowest since at least 2016 (IEA).
Demand destruction is doing the rest. The IEA counts year-on-year demand drops of 5 mb/d in the second quarter and 3.7 mb/d in the third, and expects 2.5 mb/d in the fourth (IEA). Goldman puts the third-quarter drop at 3.3 mb/d (Goldman Sachs). That is the polite name for families, truckers and factories using less because they cannot afford more. The IEA says diesel topped $200 a barrel in September and warns that, without Middle East supply, “further demand reductions and the heavy economic costs these will entail may be needed” (IEA). See ENB’s diesel outlook into 2027.
ENB answer to question one: the market says $100-plus Brent lasts about five more months, through the March contract. EIA says about two. The banks with the most recent calls say about $100 into the first quarter. Anything below $90 for long needs Hormuz open, and for that no one can give you a date.
Part 2. How do natural gas and LNG rebalance?
The Qatar hole
As of Kpler data via Reuters, Oct. 12; IEA Gas Market Report Q3-2026
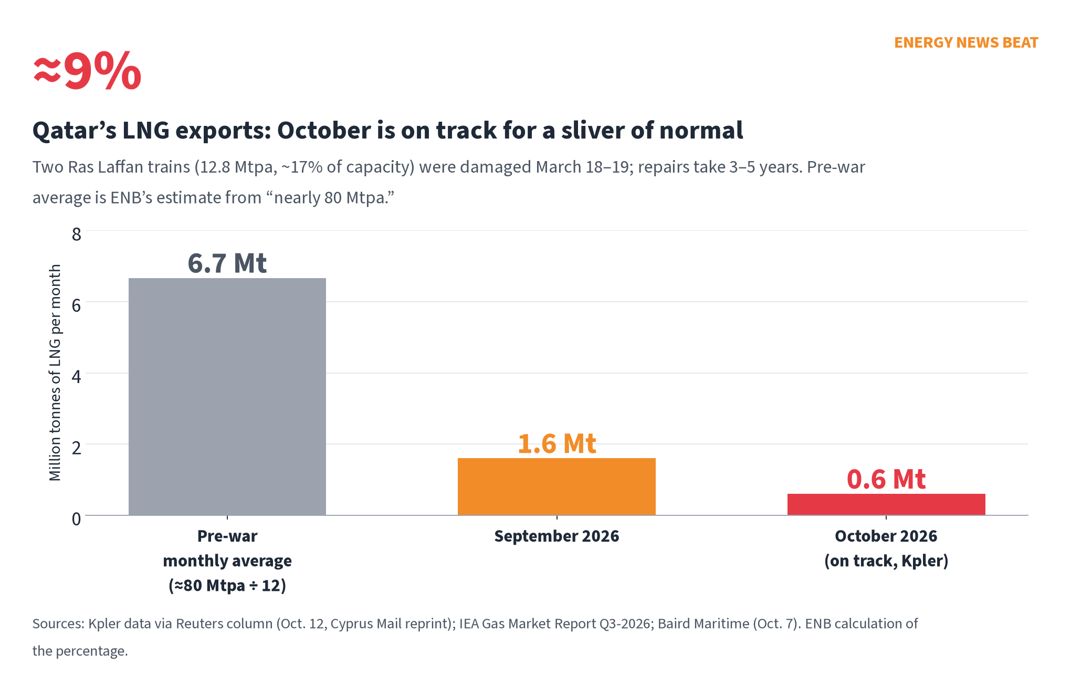
Before the war, Hormuz carried about 11.4 Bcf/d of LNG, more than a fifth of world LNG trade, almost all of it from Qatar and the UAE (EIA). Qatar alone has nearly 80 million tonnes a year of capacity, about a fifth of world supply (Reuters via Cyprus Mail). Missile attacks on March 18–19 damaged two Ras Laffan trains with 12.8 Mtpa, about 17% of Qatar’s capacity, and QatarEnergy says repairs take three to five years (IEA full report; Baird Maritime).
Exports have collapsed. Kpler data show Qatar shipped 1.6 million tonnes in September, less than a quarter of its pre-war pace, and about a third of that went to Kuwait. October is on track for about 0.6 million tonnes (Reuters via Cyprus Mail). That is roughly 9% of a normal month (ENB calculation). The IEA puts cumulative LNG losses from the war at about 140 bcm over 2026–2030 (IEA).
Prices: one world, three very different gas bills
As of Oct. 16 settlements and assessments
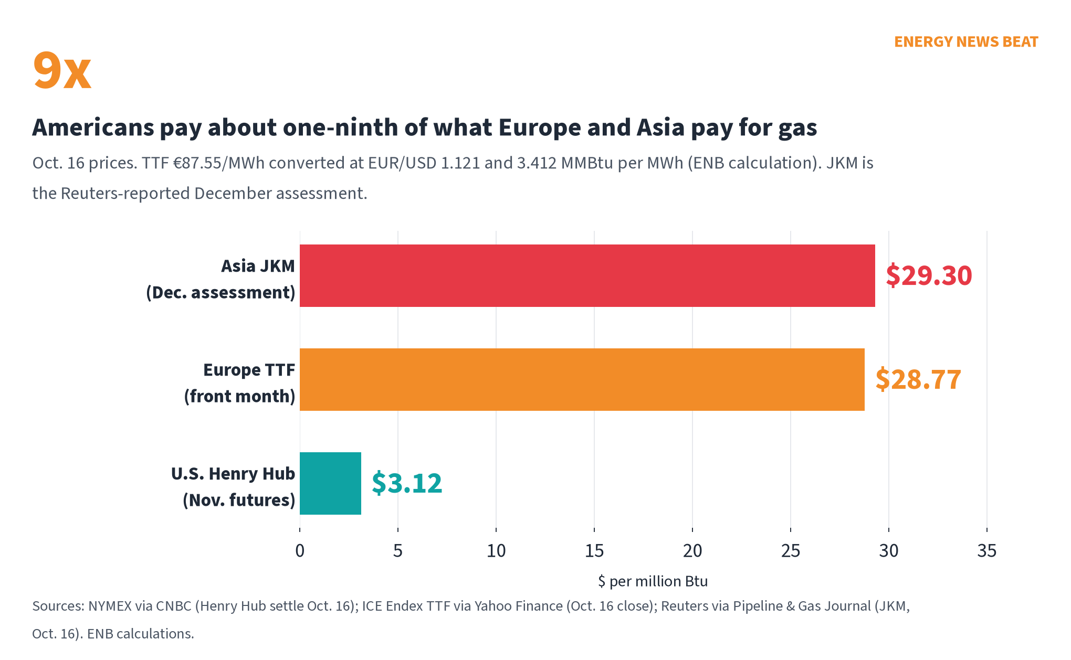
Asian spot LNG for December hit $29.30 per million Btu on Friday, the highest since Dec. 23, 2022, up from $26.50 a week earlier (Reuters via P&GJ). Europe’s TTF benchmark closed at €87.55 per megawatt-hour, about $28.77 per million Btu (ENB conversion at the Oct. 16 EUR/USD close of 1.1213; Yahoo Finance; Yahoo Finance). TTF is up about 211% this year. U.S. Henry Hub for November settled at $3.116, with December at $3.386 and January at $3.759 (CNBC). Henry Hub futures are down about 15% this year (Yahoo Finance; ENB calculation).
Put simply, a European or Japanese utility pays about nine times what an American utility pays for the same gas (ENB calculation). EIA expects Henry Hub to average $3.48 this year and $3.16 next year (EIA). That is why gas-heated American homes are getting a break this winter while the rest of the world is not (EIA).
Europe’s winter math
As of GasRadar briefing Oct. 16 (GIE AGSI+ data)
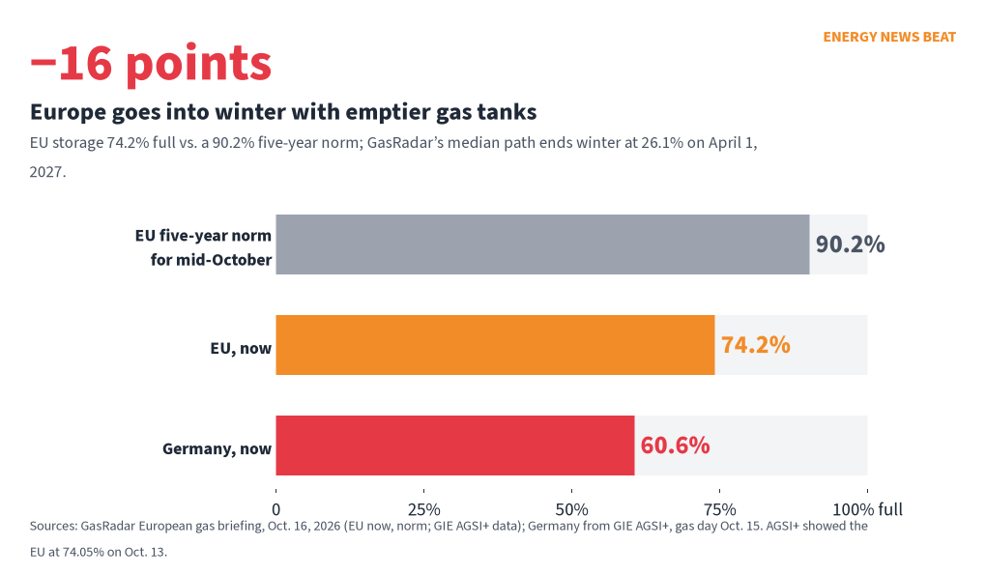
EU gas storage is 74.2% full, against a five-year norm of about 90.2% for mid-October. On GasRadar’s median path, EU storage ends winter around 26.1% on April 1 (GasRadar). Germany is at 60.6% (gas day Oct. 15) (GIE AGSI+). Our Oct. 15 piece, Europe’s Gas Prices Close to 2022 High as LNG Market Shifting, walks through why: Europe and Asia are now bidding against each other for every flexible cargo. Morgan Stanley sees TTF around €90 this winter, with a €135 risk case (Reuters via P&GJ). Citi, in September, had TTF in the mid-€50s for the fourth quarter (Citi). That is a wide range, and the cold will decide it.
Asia: buying less, burning coal
Asia rebalanced the hard way. The IEA estimates China’s gas demand fell about 4% year-on-year from March to June, and its LNG imports fell 12%. Across Asia, high prices brought demand-side measures and switching from gas to coal (IEA). The fertilizer shock is real too: Gulf fertilizer exports have “largely been halted,” and high gas prices cut fertilizer output in Bangladesh, India and Pakistan (IEA). Columbia University’s Center on Global Energy Policy called Asia’s response a playbook of “coal, curtailment, and competing for LNG” (CGEP).
The American LNG wave
As of EIA STEO Oct. 6; WorkBoat Sept. 13; IEA Gas Market Report Q3-2026
This is where the rebalancing really happens. U.S. LNG exports averaged 17.4 Bcf/d in the first half of 2026, up 23% (Rig & Refinery). EIA expects 17.6 Bcf/d for 2026 and 18.6 for 2027, reaching about 21.1 Bcf/d of exports by December 2027 (EIA). The IEA says new projects in North America, Africa and Australia add close to 50 bcm of supply this year, which mostly offsets the Gulf loss (IEA).
- Online: Venture Global’s Plaquemines is exporting at full capacity, and Cheniere’s Corpus Christi Stage 3 reached substantial completion Aug. 28. Together they add about 4 Bcf/d, and both were already exporting part of that in 2025 (WorkBoat). Golden Pass, owned by QatarEnergy and ExxonMobil, shipped its first cargo April 22. Its Trains 2 and 3 come “in turn,” for about 18 Mtpa in all (Golden Pass).
- 2027–2029: Rio Grande LNG (first LNG in the first half of 2027), Port Arthur (2027, second train 2028), CP2 (guided second half 2027, “slippage risk into 2028”), Corpus Christi Midscale 8–9 (second half 2028) and Woodside Louisiana (2029) (WorkBoat; EIA).
- New FIDs: 2025 brought a record six U.S. final investment decisions (Poten), including Rio Grande Trains 4 and 5 (NextDecade Train 4; NextDecade Train 5). Since March, CP2 Phase 2, Delfin’s first floating LNG vessel and Commonwealth LNG have also reached FID, all for around 2030 (IEA).
Add it up and about 21.5 Bcf/d of new U.S. LNG capacity is online, building or sanctioned (ENB tally; Mtpa and bcm converted to Bcf/d by ENB). For scale, U.S. exports averaged 15.1 Bcf/d in 2025, though some of the new capacity, Plaquemines and Corpus Christi Stage 3, was already exporting in 2025, so the two numbers overlap. The IEA expects North American export capacity to approach about 340 bcm a year by 2030 (IEA). Qatar is building too: the first train of its North Field East expansion should be ready to start in November, two people familiar with the plans told Reuters (Baird Maritime). The IEA says the full 44 bcm/yr project could be delayed by more than a year (IEA full report).
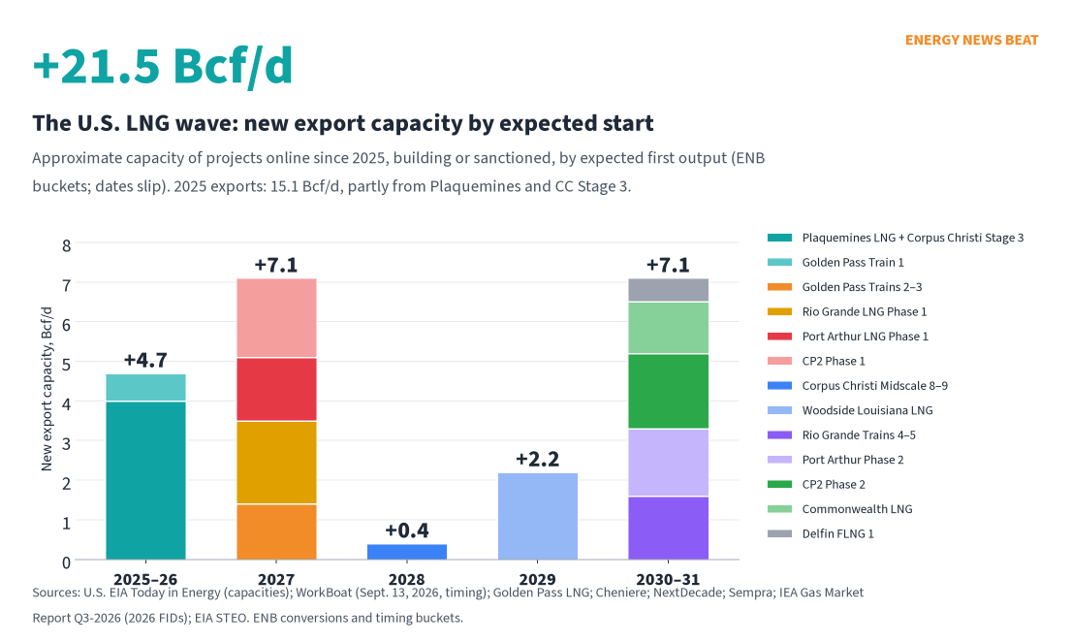
ENB answer to question two: gas rebalances in three steps. This winter it rebalances through price: Asian demand cuts, coal switching and European storage drawdowns. In 2027 new supply arrives, with about 7 Bcf/d of U.S. capacity due that year by our tally plus North Field East. By 2028, if Hormuz is open, the wave the IEA was already expecting before the war returns, minus the damaged Qatari trains. Our June deep dive, The New Energy Boom: Data Centers, LNG and America’s Gas Advantage (June 24), covers the tug-of-war at home between LNG exports, data centers and your utility bill.
The fair counterpoint: more exports tie U.S. prices more closely to the world. The Industrial Energy Consumers of America, a manufacturers’ group that buys gas, asked DOE in January to suspend spot LNG exports to bring down gas and power prices, while saying it is not against LNG exports (IECA). For now the numbers favor the exporters: Henry Hub is down this year while LNG exports hit records, including record first-half volumes (CNBC; WorkBoat).
Part 3. Is coal making a comeback?
As of IEA Coal Mid-Year Update (published Sept. 2026); Newcastle futures Oct. 16
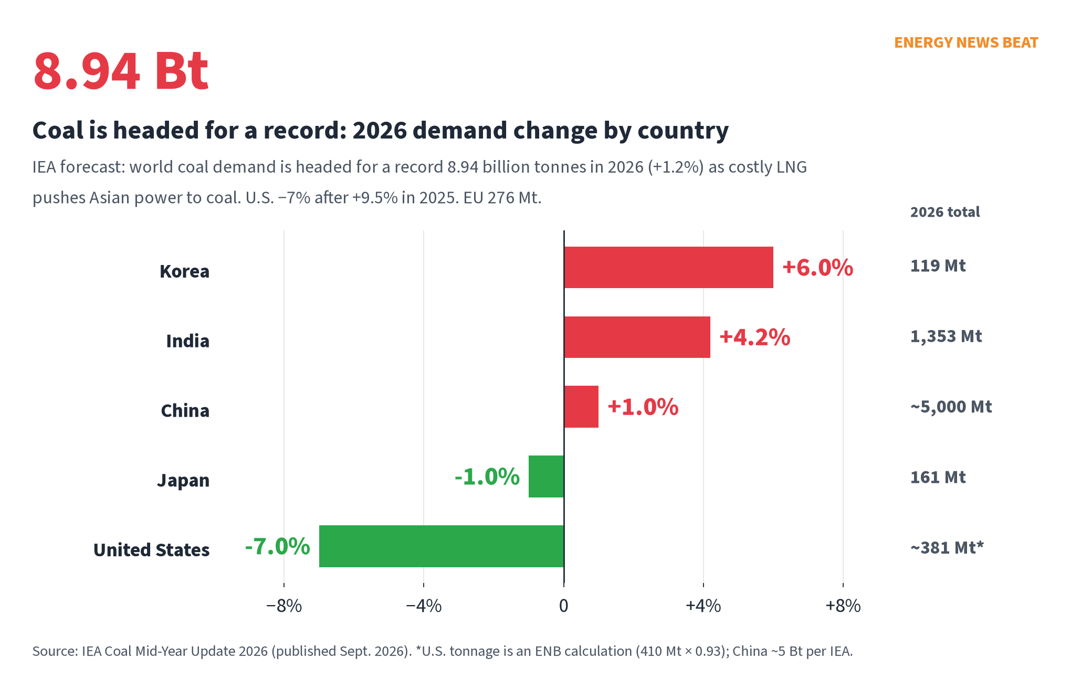
Yes, at least this year. The IEA now expects world coal demand to rise 1.2% to a record 8.94 billion tonnes in 2026, reversing its earlier call for a decline. It blames the Middle East war and an unusually strong El Niño: expensive gas pushed power plants to switch to coal, and some countries temporarily allowed more coal burning (IEA). If tensions ease, the IEA sees a slight dip to 8.91 billion tonnes in 2027 (IEA).
- China: demand up about 1% to roughly 5 billion tonnes, more than half the world’s coal, helped by strong power demand, weak wind and expensive LNG (IEA). September imports were 43.37 million tonnes, down 5.7% from a year earlier but up 3% from August, as domestic prices hit a near three-year high (OilPrice; SXCoal).
- India: up 4.2% to 1,353 Mt, back on its long growth trend (IEA).
- Japan: down 1% to 161 Mt, but coal power runs higher than expected because of gas prices, and the government removed limits on which coal plants can earn capacity payments (IEA). Rystad says Japan’s coal imports ran more than 20% above a year earlier in May (Rystad).
- Korea: up 6% to 119 Mt, reversing an expected decline; coal generation jumped 30% year-on-year in the first quarter (IEA). Rystad says Korea’s coal imports ran more than 50% above a year earlier in May (Rystad).
- Germany and Europe: a counterpoint, not a surge. Destatis data show German coal generation was down 0.5% in the first half to 49.4 TWh while gas generation rose 6.4% (Clean Energy Wire). Hard coal did jump 23.5% in the second quarter, to 5.7 TWh (SMARD). Reuters reported in September that European coal generation could rise about 25% over six months as gas stays expensive (Reuters via Euronext). The IEA puts EU coal use at 276 Mt this year, a slower decline than it expected (IEA). See ENB’s European coal coverage.
- United States: coal use rose more than 9.5% to 410 Mt in 2025, and the IEA expects a 7% drop in 2026 because U.S. gas is cheap. Emergency orders and postponed retirements are slowing the decline (IEA).
Prices: Newcastle thermal coal futures settled at $150.40 a tonne on Oct. 16, close to the 52-week high of $152.25 and up from a low of $103.70 (Investing.com). The IEA says Newcastle averaged $139 a tonne in June and $131 in August, and was assessed at $136 by late August (IEA). Kpler argues that “three shocks are resetting coal’s winter ceiling” (Kpler).
America’s coal fleet and DOE 202(c)
As of DOE 202(c) orders page, checked Oct. 17
Here at home, the Department of Energy is using Section 202(c) of the Federal Power Act to keep retiring plants running. Current coal orders include J.H. Campbell in Michigan (through Nov. 14; it was supposed to close May 31, 2025), Centralia Unit 2 in Washington (through Dec. 11), Schahfer 17 and 18 and Culley 2 in Indiana (through Dec. 18), Craig 1 in Colorado (through Dec. 25) and Stanton 1 in Florida (through Nov. 30). DOE’s latest order, 202-26-50, went to PJM on Oct. 12 (DOE).
Energy Bad Boys, the Always On Energy Research team of Isaac Orr and Mitch Rolling, is a think tank that is openly critical of wind and solar mandates. Its June analysis of FERC data for 82 plants found existing coal plants produce power for an average of $45.57/MWh, and nearly eight in ten for under $60 (Energy Bad Boys; see ENB’s repost). To its credit, the same report names the outliers at both ends, and three are under DOE orders: Schahfer, second-most expensive at $110.03/MWh; Culley, at $86.86; and Campbell, among the cheapest at $30.36 (Energy Bad Boys). It argues cost is not the only test, because Schahfer ran near full output when supply was tight (Energy Bad Boys). Its work on NERC’s blackout warnings and on near-misses in grid regions like SPP makes the same reliability case (Energy Bad Boys; Energy Bad Boys).
The other side: on Sept. 11 the D.C. Circuit vacated DOE’s first Campbell order, finding the agency had not shown an imminent emergency (D.C. Circuit). Consumers Energy reported a $259 million net cost of compliance, after $239 million in MISO market revenues (Utility Dive). Rystad Energy says Asia’s shift is “not a coal comeback but a reality check” for the energy transition (Rystad).
ENB answer to question three: coal is back as the world’s shock absorber. It is a comeback in Asia this year and a slower decline in Europe. In the U.S. it is mostly a fight over keeping existing plants open. How long it lasts depends on LNG prices, and those depend on Hormuz and the 2027 supply wave. See Coal Making a Comeback: How Fast and How Long?.
Part 4. The chokepoints to watch
As of UKMTO weekly data to Oct. 14 (via Anadolu, Oct. 17); other sources as dated in the table
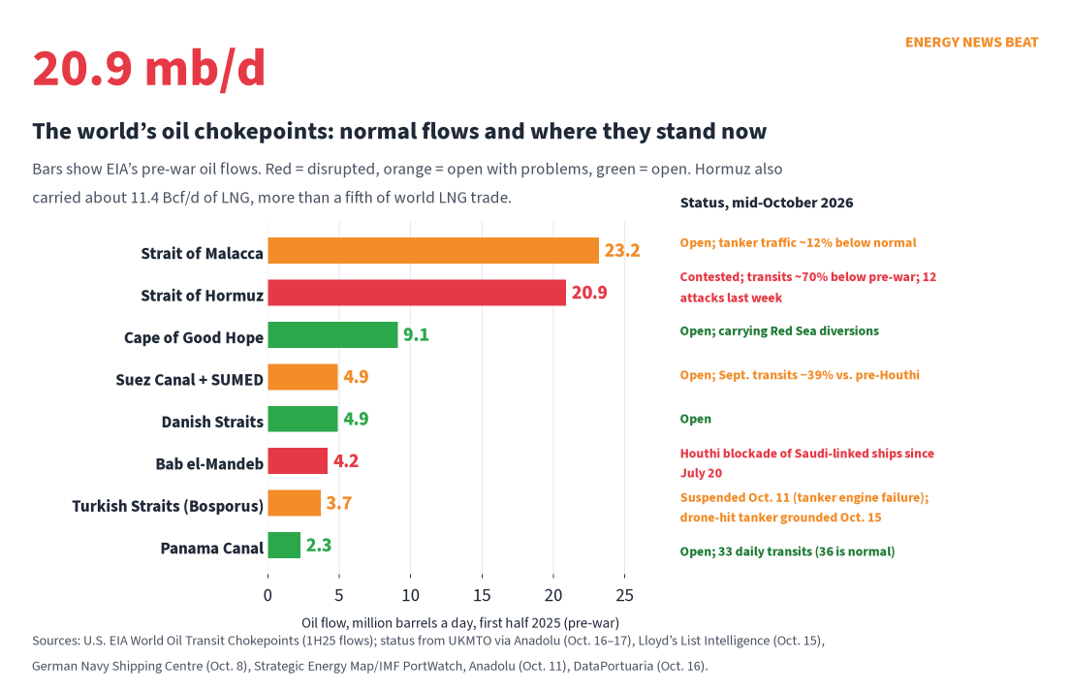
About 80 million barrels a day of oil moves by sea, and much of it squeezes through a handful of narrow straits (EIA). Here is EIA’s pre-war map of flows with where each stands this week.
| Chokepoint | Oil flow, 1H25 (EIA) | Status now | Source |
| Strait of Malacca | 23.2 mb/d | Open. Tanker traffic averaged 74.9 a day in the week to Oct. 11, about 12% under an 84.8 baseline (IMF PortWatch data) | Strategic Energy Map |
| Strait of Hormuz | 20.9 mb/d (+11.4 Bcf/d LNG) | Contested. 125 outbound and 129 inbound transits in the week to Oct. 14, about 70% below pre-conflict; 12 attacks, 10 in Hormuz; one vessel lost; 84 Hormuz incidents since late February. Both the U.S. and Iran claim control | Anadolu/UKMTO; UKMTO; Al Jazeera |
| Cape of Good Hope | 9.1 mb/d | Open; carries ships avoiding the Red Sea | EIA |
| Suez Canal + SUMED | 4.9 mb/d | Open but light: 1,228 Suez transits in September, 39% below pre-Houthi levels | Lloyd’s List Intelligence |
| Bab el-Mandeb | 4.2 mb/d | Houthi blockade of Saudi-linked ships since July 20; six merchant ships attacked. September transits 1,215, down 47% | German Navy brief; Lloyd’s List Intelligence |
| Danish Straits | 4.9 mb/d | Open | EIA |
| Turkish Straits (Bosporus) | 3.7 mb/d | Traffic suspended Oct. 11 after a tanker engine failure (Anadolu); drone-damaged tanker Banda grounded off Istanbul Oct. 15 | Anadolu; World Ports |
| Panama Canal | 2.3 mb/d (FY25) | Open; 33 daily transits (36 is normal), draft 14.94 m; LNG transits recovering | DataPortuaria; Infobae |
Saudi Arabia’s escape route is the Red Sea. Kpler shows Red Sea exports averaging about 3.25 mb/d over seven days, above a 2.80 mb/d baseline, after Yanbu loadings resumed Sept. 17 following the East-West pipeline attack (Kpler). But that route runs past the Houthis at Bab el-Mandeb, which is why two chokepoints now matter for the same barrel. ENB’s Hormuz escape-routes piece and tanker-attack coverage have more. The U.S. imported only about 0.4 mb/d through Hormuz before the war (EIA). We feel it through world prices, not empty terminals.
Energy security starts at home
As of EIA weekly data, week ending Oct. 9; EIA STEO Oct. 6
If there is one lesson from 2026, it is that energy security beats energy policy goals when supply is on the line. Look at what America did this year. Crude exports have averaged 4.26 mb/d, up from 3.87 in 2025, and petroleum product exports 7.55 mb/d, up from 6.84 (EIA; EIA; ENB averages). U.S. crude output was 13.68 mb/d last week (EIA), and EIA expects 14.3 mb/d in 2027 (EIA). LNG exports are set to rise 16% this year, and coal exports about 11% to 102 million short tons (EIA).
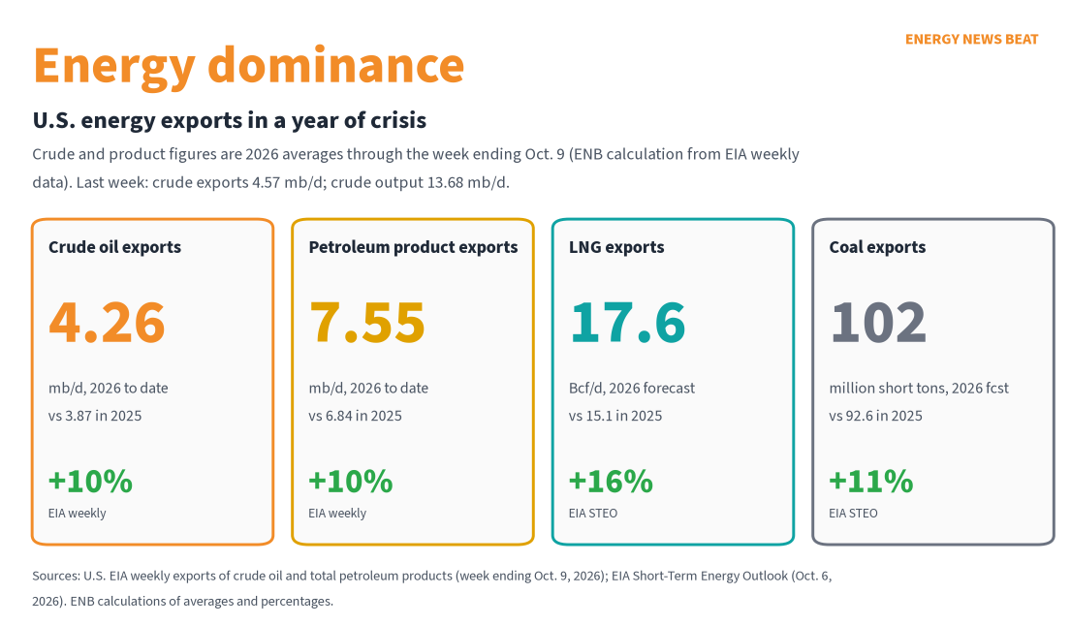
Those exports are what “energy dominance” looks like in practice: allies in Europe and Asia buying American molecules instead of waiting on a strait. It also explains the gas-bill gap at home. The fuels America produces in surplus, natural gas and coal, are cheap here. The ones we trade at world prices, crude and especially diesel, are not. ENB has covered this on the podcast in Energy Security Starts at Home and in The New Energy Boom.
Counterarguments, fairly stated. Supporters of wind and solar say this crisis shows why homegrown renewables matter, since they need no tankers. The IEA noted that stronger renewable output helped cut Europe’s gas use in the first half (IEA). ENB’s view is that weather-dependent power still needs firm backup in a crisis, and that subsidies hide its true cost to ratepayers (see The Subsidy Cliff and Your Power Bill). Energy Bad Boys’ reliability work points the same way, but it comes from a mandate-critical think tank (Energy Bad Boys). Others warn that exports and refineries cannot be built fast enough to help this winter, and they are right: new refining, like the planned Brownsville plant, is years away (ENB).
Consumers vs. investors
As of AAA, 8:25 a.m. CT Oct. 17; Yahoo Finance closes Oct. 16
Consumers: Pew Research Center found 74% of Americans are very concerned about “the price of gas and energy” (Pew). Diesel is up $2.69 a gallon in a year, and regular is up $1.26 (AAA). EIA’s retail forecast has diesel averaging $5.19 this year and $4.49 next, and gasoline $3.91 and $3.56 (EIA). So EIA expects relief, slowly. Gas-heated homes do better this winter, oil-heated homes worse, and electric-heated homes (40%-plus) about 4% worse (EIA).
Investors: the Energy Select Sector fund (XLE) closed Friday at $68.24, up about 52.6% this year on price alone (about 55.7% with dividends), against about 11.9% for the S&P 500 fund (Yahoo Finance; Yahoo Finance; ENB calculations). Wall Street is split on what comes next. Morgan Stanley just raised its oil call Morgan Stanley). Goldman calls the risk from the Iran war “significant” but still sees oil easing (Yahoo Finance). Citi and Julius Baer lean bearish (Citi; The National). U.S. gas investors have the opposite problem from consumers abroad: Henry Hub futures are down about 15% this year. None of this is investment advice.
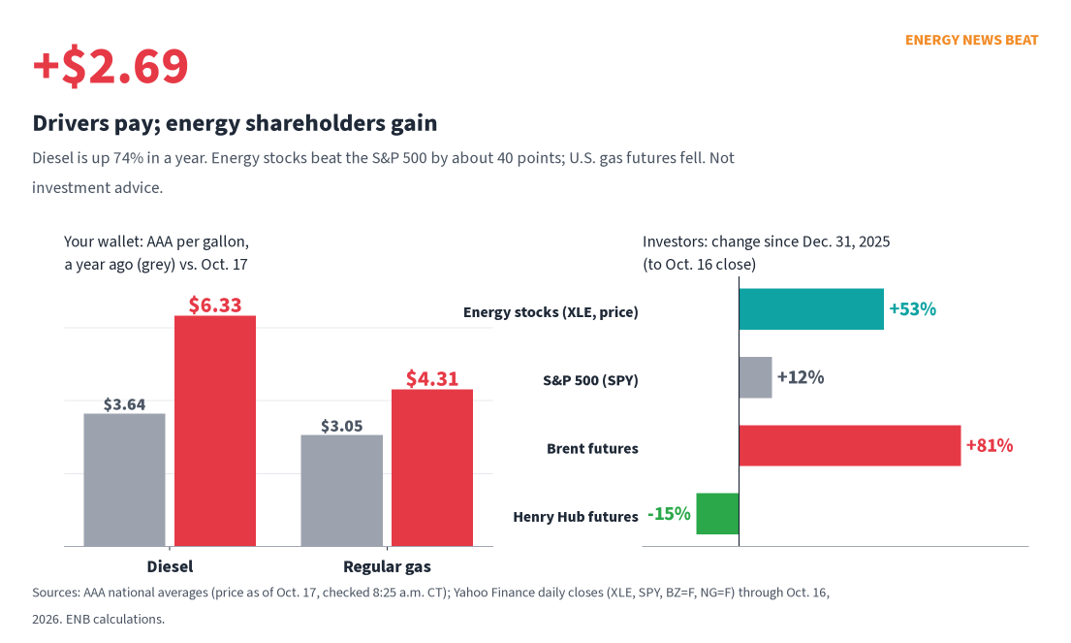
Drivers pay; energy shareholders gain. Sources: AAA; Yahoo Finance. ENB calculations. Not investment advice.
| Stu’s Take
Folks, I want to start where you start: at the pump. Diesel is $6.33 and regular is $4.31. Brent settled at $109.86 Friday, and the futures market is pricing $100-plus oil through next March. EIA says it slips under $100 by December. I hope EIA is right. I would not bet my heating bill on it. Here is my opinion, and it is mine. The world just ran a live test of energy policy, and energy security won. When Hormuz transits fell about 70%, nobody in Tokyo or Berlin asked for a pledge. They asked for molecules. Asian LNG hit $29.30. American gas is $3.12. That is not luck. That is pipelines, drilling rigs, export terminals and coal plants that stayed open. America is exporting about 4.26 million barrels a day of crude and 7.55 million of products. LNG exports are headed to 17.6 Bcf/d, and about 21.5 Bcf/d of new capacity is online, building or sanctioned. World coal demand is headed for a record 8.94 billion tonnes this year. Those are not slogans. That is energy dominance, and it starts at home. But I will be straight with you about the weak spots. Our SPR is 283 million barrels, down from 408 million a year ago. World stocks are 509 million barrels below pre-war. And we still cannot build refineries fast enough to fix $6 diesel this winter. I have said there are only two ways prices come down: demand destruction or more refineries. Right now we are getting the first one, and I would rather have the second. So watch the strait, watch Qatar’s 0.6 million tonnes, and watch the Nov. 10 EIA outlook. And thanks to Isaac Orr and Mitch Rolling for keeping the coal-cost receipts on the table, even when they cut both ways. Buckle up. This winter is going to be about who has energy at home. |
What to watch
- Weekly: UKMTO’s Hormuz transit counts and attack tally (UKMTO); EIA’s Wednesday stocks and exports data (EIA); AAA prices every morning (AAA).
- 10: EIA’s next Short-Term Energy Outlook, the first to include October’s price spike (EIA). Mid-November: the next IEA and OPEC monthly oil reports.
- November: Qatar’s first North Field East train is due to be ready (Baird Maritime); Qatar’s November export count from Kpler.
- This winter: EU storage against the 26% end-of-winter median path (GasRadar); JKM versus TTF as Europe and Asia compete for cargoes (Reuters via P&GJ).
- 14–Dec. 25: expiry dates for the current DOE 202(c) coal orders, starting with Campbell (Nov. 14) and Stanton (Nov. 30), and whether DOE renews them (DOE).
- 2027: the U.S. LNG wave: Golden Pass Trains 2–3, Rio Grande, Port Arthur and CP2 (WorkBoat).
The bottom line
How long will $100 oil last? The honest answer is as long as the Strait of Hormuz stays half open, and the market is betting on at least through the winter. Gas and LNG will rebalance the slow way: high prices this winter, then a wave of American and Qatari supply in 2027 and 2028. Coal is the world’s emergency fuel again, and the chokepoints, from Hormuz to the Red Sea to the Bosporus, are where the next surprise will come from. Through all of it, the country with its own oil, gas and coal has the cheapest bills and the most options. Energy security starts at home. Keep following the numbers with us at Energy News Beat.
Appendices
At Energy News Beat we Make Appendices Great Again. Everything below backs up the article: every source with a link and a label for its point of view, the key numbers, the timeline, the exact words behind our quotes, how we did the math, and what we could not confirm. Every figure in the charts is in the companion workbook, “How Long Will $100 Oil Last – Hormuz, LNG and Coal Are Writing Your Winter Fuel Bill – Data.xlsx,” with a source and URL on each sheet.
Appendix A. Sources, with perspective labels
“Perspective” tells you who is speaking. Official agencies, market data, news outlets, banks, think tanks, advocacy groups and companies all have points of view; we label them so you can weigh them.
| # | Source | Publisher | Perspective | Date |
| 1 | ICE Brent crude, Dec. 2026 contract (Oct. 16 settlement) and forward months Jan. 2027–Feb. 2028 | CNBC (ICE data) | Market data | Oct. 16, 2026 settle; checked 8:24 a.m. CT Oct. 17 |
| 2 | NYMEX WTI crude, Nov. 2026 contract (Oct. 16 settlement) | CNBC (NYMEX data) | Market data | Oct. 16, 2026 settle |
| 3 | NYMEX Henry Hub natural gas, Nov. 2026–Jan. 2027 contracts (Oct. 16 settlements) | CNBC (NYMEX data) | Market data | Oct. 16, 2026 settle |
| 4 | Oil touches $110 on continued uncertainty over Middle East supplies (Reuters copy; Julius Baer’s Norbert Rucker quoted) | The National | News report | Oct. 16, 2026 |
| 5 | Oil Prices Rise as Ukraine Renews Attacks on Russian Refineries (headline was updated; the URL still reads “oil-prices-fall”) | The Wall Street Journal | News report | Oct. 16, 2026 |
| 6 | Europe Brent Spot Price FOB, daily | U.S. EIA | Official statistics / government | through Oct. 14, 2026 |
| 7 | Brent crude futures (BZ=F), daily history | Yahoo Finance | Market data | through Oct. 16, 2026 |
| 8 | Short-Term Energy Outlook, October 2026 (forecast completed Oct. 1; next edition Nov. 10) | U.S. EIA | Official statistics / government | Oct. 6, 2026 |
| 9 | Winter Fuels Outlook 2026–27 | U.S. EIA | Official statistics / government | Oct. 6, 2026 |
| 10 | Oil Market Report, October 2026 | International Energy Agency | Intergovernmental (oil-importing countries) | Oct. 14, 2026 |
| 11 | Monthly Oil Market Report, October 2026 | OPEC Secretariat | Producer group (OPEC) | Oct. 13, 2026 |
| 12 | OPEC sees global oil demand growth at 0.2 mb/d in 2026 before rebounding in 2027 | Enerdata | News report (summarizing OPEC) | Oct. 13, 2026 |
| 13 | Will Oil Prices Decline as Middle East Supply Recovers? | Goldman Sachs Research | Investment bank (investor-side) | Oct. 16, 2026 |
| 14 | Goldman Sachs raises December oil price target to $90, citing ‘significant’ risk from Iran war | Yahoo Finance | News report (on Goldman) | Oct. 12, 2026 |
| 15 | Morgan Stanley lifts Brent forecast to $105 as costly freight favours short-haul crude | investingLive | News report (on Morgan Stanley) | Oct. 13, 2026 |
| 16 | Morgan Stanley raises Q4 Brent forecast to $105/b (headline; paywalled) | Quantum Commodity Intelligence | News report (paywalled) | Oct. 14, 2026 |
| 17 | Citi lifts 3Q26 Brent forecast to $86 but sees prices sliding to $65 by 2027 | investingLive | News report (on Citi) | Sept. 3, 2026 |
| 18 | Citigroup maintains its Brent oil price forecast at $70 per barrel for Q4 2026 | Bitget News | News report (on Citi) | Sept. 3, 2026 |
| 19 | World Oil Transit Chokepoints | U.S. EIA | Official statistics / government | updated March 3, 2026 |
| 20 | Strait of Hormuz transits remain 70% below pre-conflict levels: UK maritime agency | Anadolu Agency | News report (Turkish state agency, citing UK government) | Oct. 17, 2026 |
| 21 | UKMTO weekly overview (Strait of Hormuz), 16 October 2026 | UK Maritime Trade Operations | Government (UK Royal Navy) | Oct. 16, 2026 |
| 22 | Kpler Media Briefing, 15 October 2026 (flow data to Oct. 13) | Kpler | Market analyst / research firm (ship tracking) | Oct. 15, 2026 |
| 23 | US and Iran both claim control of Strait of Hormuz amid attacks on vessels | Al Jazeera | News report (Qatari state-funded) | Oct. 17, 2026 |
| 24 | Red Sea Brief: 15 October 2026 | Lloyd’s List Intelligence | Market analyst / research firm (shipping data) | Oct. 15, 2026 |
| 25 | Security Update Brief, Persian Gulf (German Navy Shipping Centre), Oct. 1–8 | German Navy Shipping Centre via VDA | Government (German Navy), via Turkish shipping body | Oct. 8, 2026 |
| 26 | Strait of Malacca: is it open? Status, ship traffic and oil flows (IMF PortWatch data) | Strategic Energy Map | Market analyst / research firm (citing IMF PortWatch) | checked Oct. 17, 2026 |
| 27 | Ship traffic suspended in Istanbul Strait after tanker suffers engine failure | Anadolu Agency | News report (Turkish state agency) | Oct. 11, 2026 |
| 28 | Drone-hit Liberian crude tanker Banda grounds off Istanbul in heavy weather | World Ports Organization | Trade press | Oct. 15, 2026 |
| 29 | Panama Canal increases daily transits to 33 after improved water levels | DataPortuaria | Trade press | Oct. 16, 2026 |
| 30 | El GNL recupera terreno en el Canal de Panamá tras años de desvíos por África | Infobae | News report | Oct. 3, 2026 |
| 31 | Gas Market Report, Q3-2026: executive summary | International Energy Agency | Intergovernmental (gas-importing countries) | July 2026 |
| 32 | Gas Market Report, Q3-2026 (full report PDF; Qatar damage, repair time and North Field East details) | International Energy Agency | Intergovernmental (gas-importing countries) | July 2026 |
| 33 | Qatar LNG exports remain severely disrupted despite recovery in Gulf oil shipments (Reuters column, Kpler data) | Cyprus Mail (Reuters) | News report (Reuters column, Kpler data) | Oct. 12, 2026 |
| 34 | Launch of new Qatar LNG train moves to counter Iranian attack losses | Baird Maritime | Trade press (Reuters copy) | Oct. 7, 2026 |
| 35 | Qatar Rewrites Its Gas Playbook With Old Tankers and New Tactics (Bloomberg) | EnergyConnects | Trade press (Bloomberg copy) | Oct. 14, 2026 |
| 36 | The Iran war is choking Middle East LNG with no end in sight | World Ports Organization | Trade press | Oct. 2026 |
| 37 | Asian spot LNG prices hit highest level in nearly 4 years (Reuters) | Pipeline & Gas Journal | Trade press (Reuters copy) | Oct. 16, 2026 |
| 38 | Dutch TTF natural gas futures (TTF=F), daily history; EUR/USD | Yahoo Finance (ICE Endex data) | Market data | Oct. 16, 2026 close |
| 39 | AGSI+ aggregated gas storage inventory: EU and Germany | Gas Infrastructure Europe (GIE) | Industry association (EU gas storage operators; official data) | Gas days Oct. 13–15, 2026 |
| 40 | European gas briefing, 16 Oct 2026: TTF 86.43 EUR/MWh, EU storage 74.2% | GasRadar | Market analyst / research firm (gas data) | Oct. 16, 2026 |
| 41 | Natural gas prices weekly update – JKM, TTF and Henry Hub (13 October 2026) | Global LNG Hub | Trade press | Oct. 14, 2026 |
| 42 | Europe’s Gas Prices Close to 2022 High as Hormuz LNG Flows Remain Limited | OilPrice.com | News report | Oct. 15, 2026 |
| 43 | Henry Hub natural gas futures (NG=F), daily history | Yahoo Finance (NYMEX data) | Market data | Oct. 16, 2026 close |
| 44 | EUR/USD (EURUSD=X), daily history | Yahoo Finance | Market data | Oct. 16, 2026 close |
| 45 | Henry Hub Natural Gas Spot Price, daily | U.S. EIA | Official statistics / government | through Oct. 14, 2026 |
| 46 | US LNG exports jump as new Gulf terminals ramp up | WorkBoat | Trade press | Sept. 13, 2026 |
| 47 | US LNG Exports Up 23% in 1H26 as Gulf Capacity Ramps | Rig & Refinery | Trade press | Oct. 10, 2026 |
| 48 | First LNG Export Cargo Departs Golden Pass LNG | Golden Pass LNG | Company (QatarEnergy/ExxonMobil JV) | April 2026 |
| 49 | North America’s LNG export capacity could more than double by 2029 | U.S. EIA (Today in Energy) | Official statistics / government | 2025 |
| 50 | US Project Finance Bonanza Continues | Poten & Partners | Market analyst / research firm (LNG broker) | June 25, 2026 |
| 51 | Cheniere Announces Positive FID on the Corpus Christi Midscale Trains 8 & 9 Project | Cheniere Energy | Company | June 2025 |
| 52 | NextDecade Announces Positive FID and Financial Close on Train 4 at Rio Grande LNG | NextDecade | Company | Sept. 9, 2025 |
| 53 | NextDecade Announces Positive FID and Financial Close on Train 5 at Rio Grande LNG | NextDecade | Company | Oct. 16, 2025 |
| 54 | Sempra Infrastructure Advances Port Arthur LNG Phase 2 | Sempra Infrastructure | Company | Sept. 2025 |
| 55 | Coal Mid-Year Update 2026: Demand | International Energy Agency | Intergovernmental | Sept. 2026 |
| 56 | Global coal demand set to increase this year amid Middle East conflict | International Energy Agency | Intergovernmental | Sept. 10, 2026 |
| 57 | Newcastle Coal Futures Historical Prices | Investing.com | Market data | Oct. 16, 2026 |
| 58 | China’s Coal Imports Fall 6% as Prices Hit Nearly 3-Year High | OilPrice.com | News report (citing China customs) | Oct. 2026 |
| 59 | September national coal imports down 5.73% y/y, up 3.03% m/m (customs data) | SXCoal (China Coal Resource) | Trade press (China, customs data) | Oct. 14, 2026 |
| 60 | Germany nearly halves fossil fuel use for electricity between 2018 and 2026 (Destatis data) | Clean Energy Wire | News report (energy-transition focused, Destatis data) | Sept. 9, 2026 |
| 61 | The electricity market in the second quarter of 2026 | SMARD (Bundesnetzagentur) | Government (German regulator) | 2026 |
| 62 | High European gas prices push power producers back to coal (Reuters) | Euronext / Reuters | News report (Reuters) | Sept. 24, 2026 |
| 63 | Asia’s coal demand to rise by 100 million tonnes in wake of Middle East conflict | Rystad Energy | Market analyst / research firm | June 8, 2026 |
| 64 | Three shocks are resetting coal’s winter ceiling | Kpler | Market analyst / research firm | Sept. 22, 2026 |
| 65 | Asia’s Gas Shock Playbook: Coal, Curtailment, and Competing for LNG | Columbia University Center on Global Energy Policy | University think tank | April 9, 2026 |
| 66 | 2026 DOE 202(c) Orders | U.S. Department of Energy | Government (U.S. DOE, issuer of the orders) | checked Oct. 17, 2026 |
| 67 | Debunking The Myth of Expensive Coal Plants (Isaac Orr and Mitch Rolling) | Energy Bad Boys (Always On Energy Research) | Mandate-critical think tank (Always On Energy Research) | June 27, 2026 |
| 68 | NERC: Half of America At A High Risk of Blackouts | Energy Bad Boys (Always On Energy Research) | Mandate-critical think tank (Always On Energy Research) | Feb. 7, 2026 |
| 69 | A Near-Blackout in Southwest Power Pool West | Energy Bad Boys (Always On Energy Research) | Mandate-critical think tank (Always On Energy Research) | Aug. 1, 2026 |
| 70 | Weekly U.S. Exports of Crude Oil | U.S. EIA | Official statistics / government | week ending Oct. 9, 2026 |
| 71 | Weekly U.S. Exports of Total Petroleum Products | U.S. EIA | Official statistics / government | week ending Oct. 9, 2026 |
| 72 | Weekly U.S. Field Production of Crude Oil | U.S. EIA | Official statistics / government | week ending Oct. 9, 2026 |
| 73 | Weekly U.S. Ending Stocks of Crude Oil in SPR | U.S. EIA | Official statistics / government | week ending Oct. 9, 2026 |
| 74 | AAA Gas Prices: national averages, “Price as of 10/17/26” (checked 8:25 a.m. CT) | AAA | Motorist organization (price data) | Oct. 17, 2026 |
| 75 | IEA Governing Board statement on energy markets and security | International Energy Agency | Intergovernmental | Oct. 15, 2026 |
| 76 | IEA Member countries to carry out largest ever oil stock release | International Energy Agency | Intergovernmental | March 11, 2026 |
| 77 | Cost Concerns Dominate as Public’s Economic Ratings Turn More Negative | Pew Research Center | Nonpartisan polling | Oct. 8, 2026 (survey Sept. 28–Oct. 4) |
| 78 | SPDR S&P 500 ETF (SPY), daily history | Yahoo Finance | Market data | Oct. 16, 2026 close |
| 79 | Energy Select Sector SPDR (XLE) and SPDR S&P 500 (SPY), daily history | Yahoo Finance | Market data | Oct. 16, 2026 close |
| 80 | Trump’s Diesel Deal With Putin Runs Into The Ban Congress Passed On Russian Energy (Stu Turley quoted) | The Daily Caller | News report (conservative-leaning; quotes Stu) | Oct. 12, 2026 |
| 81 | Europe’s Gas Prices Close to 2022 High as LNG Market Shifting | Energy News Beat | Energy News Beat (in-house) | Oct. 15, 2026 |
| 82 | Oil Over $100 as Markets Struggle to Balance Amid Tanker Attacks and Shipping Disruptions | Energy News Beat | Energy News Beat (in-house) | Oct. 17, 2026 |
| 83 | Coal Making a Comeback: How Fast and How Long? | Energy News Beat | Energy News Beat (in-house) | Oct. 16, 2026 |
| 84 | The IEA Speeds Up 20 Million Barrels of Diesel. That Is About Five Days of U.S. Use | Energy News Beat | Energy News Beat (in-house) | Oct. 16, 2026 |
| 85 | IEA Says the Diesel Squeeze Lasts Well Into 2027. Futures Imply About $6 Diesel Into January | Energy News Beat | Energy News Beat (in-house) | Oct. 14, 2026 |
| 86 | Iran IRGC Claims Third Tanker Hit in Two Days in Strait of Hormuz | Energy News Beat | Energy News Beat (in-house) | Oct. 13, 2026 |
| 87 | Hormuz Traffic Sinks and Saudi Oil Comes Under Fire: How Many Escape Routes Are Left? | Energy News Beat | Energy News Beat (in-house) | Oct. 9, 2026 |
| 88 | High European Gas Prices Coupled With Bad Energy Policies Push Power Back to Coal | Energy News Beat | Energy News Beat (in-house) | Sept. 24, 2026 |
| 89 | Debunking the Myth of Expensive Coal Plants: Energy Bad Boys Bring the Receipts | Energy News Beat | Energy News Beat (in-house) | June 27, 2026 |
| 90 | Energy Security Starts at Home: Preparing for the Grid of Tomorrow (podcast) | Energy News Beat | Energy News Beat (in-house) | June 25, 2026 |
| 91 | The New Energy Boom: Data Centers, LNG and America’s Gas Advantage | Energy News Beat | Energy News Beat (in-house) | June 24, 2026 |
| 92 | The Subsidy Cliff and Your Power Bill: Wind, Solar, Storage and the Grid | Energy News Beat | Energy News Beat (in-house) | Oct. 17, 2026 |
| 93 | Morgan Stanley Leads Fundraise for $4 Billion Texas Refinery Project | Energy News Beat | Energy News Beat (in-house) | Oct. 16, 2026 |
| 94 | Michigan v. DOE, No. 25-1159 (D.C. Cir.), opinion vacating the first Campbell 202(c) order | U.S. Court of Appeals, D.C. Circuit | Federal court | Sept. 11, 2026 |
| 95 | Court rejects DOE ‘emergency’ order delaying coal plant retirement as overstep | Utility Dive | Trade press | Sept. 2026 |
| 96 | Letter to Secretary Wright urging suspension of spot LNG exports | Industrial Energy Consumers of America | Manufacturers’ advocacy group (gas buyers) | Jan. 28, 2026 |
Appendix B. Key figures
| Figure | Value | Source |
| Brent, Dec. 2026 futures | $109.86 settle Oct. 16 (+$3.94); Thursday $105.92; contract 52-week high $126.41 (Apr. 30) | CNBC |
| WTI, Nov. 2026 futures | $101.41 settle Oct. 16 (+$3.44) | CNBC |
| Brent futures strip (Oct. 16) | Dec 26 $109.86; Jan 27 $106.82; Feb 27 $103.93; Mar 27 $101.53; Apr 27 $99.41; May 27 $97.46; Jun 27 $95.62; Jul 27 $93.87; Aug 27 $92.21; Sep 27 $90.64; Oct 27 $89.19; Nov 27 $87.88; Dec 27 $86.69; Jan 28 $85.56; Feb 28 $84.53. Dec26–Dec27 backwardation $23.17 [ENB CALC] | CNBC |
| Dated Brent spot (EIA) | Feb. 27 $71.32; Mar. 12 $102.38; peak $138.21 (Apr. 7); low $68.53 (Jul. 2); Oct. 14 $126.55; ≥$100 on 82 of 158 days since Mar. 1 [ENB CALC] | EIA |
| Monthly avg Dated Brent | Feb $70.89; Mar $103.13; Apr $117.29; May $107.14; Jun $85.40; Jul $83.76; Aug $91.08; Sep $114.16; Oct $126.98 (Oct. is month to date) [ENB CALC] | EIA |
| EIA STEO (Oct. 6) | Brent 4Q26 $105; 2026 $96; 2027 $84 (was $74); 1Q27 $95, 2Q27 $87, 3Q27 $80, 4Q27 $74; WTI 4Q26 $97, 2027 $80; shut-ins 4.5 mb/d 4Q26; diesel $5.19/$4.49; gasoline $3.91/$3.56; HH $3.48/$3.16 | EIA |
| EIA STEO monthly Brent path | 2026-Oct $111; 2026-Nov $104; 2026-Dec $99; 2027-Jan $97; 2027-Feb $95; 2027-Mar $93; 2027-Apr $90; 2027-May $87; 2027-Jun $84; 2027-Jul $82; 2027-Aug $80; 2027-Sep $78; 2027-Oct $76; 2027-Nov $74; 2027-Dec $72 | EIA |
| IEA OMR (Oct. 14) | Demand 2026 102.4 mb/d (−2.6); 2Q −5, 3Q −3.7, 4Q −2.5 mb/d y/y; supply Sept. 102.3; 2026 100.7 (−5.8); 2027 +7.7; stocks 509 mb below pre-war (end-Sept.); Hormuz flows 10.9 mb/d (+3.7); bypass 5.6 mb/d; Gulf crude exports 13.9 mb/d; OPEC+ effective spare 0.27 mb/d; Saudi 8.3 vs 12.11 capacity; Dated ~$134 | IEA |
| OPEC MOMR (Oct. 13) | Demand 2026 +0.2 mb/d to 105.7; 2027 108.3; ORB Sept. $110.59; ICE Brent Sept. $102.02; M1–M3 backwardation $8.24, M1–M6 $15.08; DoC crude 39.07 mb/d Sept. | OPEC; Enerdata |
| Bank forecasts | Morgan Stanley 4Q26 $105, 1Q27 $100 (Oct. 13); Goldman Dec. $90, 2027 $80, bull $125, bear low $70s (Oct. 12); Citi 3Q $86, 4Q $70, 2027 $65 (Sept. 3) | MS; GS; Citi |
| Hormuz traffic | UKMTO: 125 out / 129 in (week to Oct. 14), ~70% below pre-conflict; 12 attacks (10 Hormuz); 1 vessel lost; 84 incidents since late Feb. Kpler (preliminary; usually revised up 1.5–2x): clearance 11,617 kb/d 7-day avg vs 17,145 baseline (68%); ex-Iran strait transits 9,203 kb/d; tanker crossings 13/day vs 50 | Anadolu; Kpler |
| EIA chokepoint flows (1H25, mb/d) | Malacca 23.2; Hormuz 20.9 (+11.4 Bcf/d LNG); Cape 9.1; Suez+SUMED 4.9; Danish 4.9; Bab el-Mandeb 4.2; Turkish 3.7; Panama 2.3; Hormuz bypass capacity 4.7; U.S. imports via Hormuz 0.4 | EIA |
| Gas prices (Oct. 16) | JKM Dec. $29.3 (highest since Dec. 23, 2022); TTF €87.547 ≈ $28.77/MMBtu at 1.1213 [ENB CALC]; HH Nov $3.116, Dec $3.386, Jan $3.759; NWE DES LNG $27.825 (Oct. 15, S&P); TTF YTD +211%, HH YTD -15% [ENB CALC] | P&GJ; Yahoo; CNBC |
| EU storage | 74.2% vs 90.2% five-year norm; median Apr. 1 path 26.1% (GasRadar Oct. 16). AGSI+: EU 74.05% (gas day Oct. 13), 74.22% (Oct. 15); Germany 60.6% (Oct. 15) | GasRadar; GIE AGSI+ |
| Qatar LNG | Nearly 80 Mtpa, about a fifth of world supply (Reuters); two trains 12.8 Mtpa (~17%) damaged Mar. 18–19; repairs 3–5 yrs; Sept. exports 1.6 Mt; Oct. on track 0.6 Mt (≈9% of normal [ENB CALC]); NFE first train ready Nov. | IEA full report; Cyprus Mail; Baird |
| U.S. LNG | 1H26 17.4 Bcf/d (+23%); 2025 15.1; STEO 2026 17.6, 2027 18.6, Dec. 2027 ~21; new capacity online/building/sanctioned about 21.5 Bcf/d [ENB tally; Plaquemines and CC Stage 3 were already exporting in 2025] | Rig & Refinery; EIA; EIA |
| Coal (IEA, Sept. 2026) | World 2025 8.84 Bt, 2026 8.94 Bt (+1.2%), 2027 8.91 Bt; China ~5 Bt (+1%); India 1,353 Mt (+4.2%); Japan 161 Mt (−1%); Korea 119 Mt (+6%); U.S. 410 Mt in 2025 (+9.5%), −7% in 2026; EU 276 Mt | IEA |
| Coal prices and trade | Newcastle $150.40 (Oct. 16), 52-week $103.70–$152.25; IEA: June avg $139, Aug. avg $131, $136 by late Aug.; China Sept. imports 43.37 Mt (−5.7% y/y, +3% m/m); Germany H1 coal gen −0.5% to 49.4 TWh; Q2 hard coal +23.5% to 5.7 TWh | Investing.com; IEA; OilPrice; CLEW; SMARD |
| DOE 202(c) coal orders | Campbell (MI) to Nov. 14; Centralia 2 (WA) to Dec. 11; Schahfer 17/18 and Culley 2 (IN) to Dec. 18; Craig 1 (CO) to Dec. 25; Stanton 1 (FL) to Nov. 30; latest order 202-26-50 to PJM, Oct. 12 | DOE |
| U.S. exports (EIA weekly) | Crude 4.57 mb/d (week to Oct. 9), 2026 avg 4.26 vs 3.87 (2025); products 7.374, avg 7.55 vs 6.84; output 13.679; SPR 283.0M vs 407.7M a year ago [averages ENB CALC] | EIA; EIA; EIA |
| U.S. coal exports (STEO) | 2024 108.3; 2025 92.6; 2026 102.4; 2027 102.8 million short tons | EIA |
| AAA (Oct. 17, 8:25 a.m. CT) | Regular $4.3085 (yr ago $3.0511); diesel $6.3276 (yr ago $3.6425); diesel record $6.5276 (Sept. 22) | AAA |
| Investors (Oct. 16 close) | XLE $68.24, +52.6% YTD price return (about +55.7% total return); SPY +11.9%; Brent futures +80.5%; HH futures -15.5% [ENB CALC] | Yahoo |
Appendix C. Timeline
| Date | Event | Type | Source |
| Feb. 27, 2026 | Brent spot closes at $71.32, the last pre-war close (EIA). TTF ~€32/MWh. | Price | link |
| Feb. 28, 2026 | War begins with U.S. and Israeli strikes on Iran (as summarized by Anadolu/UKMTO). | Event | link |
| Mar. 2, 2026 | Iran’s IRGC announces closure of the Strait of Hormuz; Brent spot $77.24. | Event | link |
| Mar. 11, 2026 | IEA members agree the largest emergency oil stock release in IEA history, 400M barrels. | Policy | link |
| Mar. 12, 2026 | Brent spot passes $100 ($102.38). | Price | link |
| Mar. 18, 2026 | Missile attacks damage two Ras Laffan LNG trains (12.8 Mtpa) in Qatar (Mar. 18–19). | Event | link |
| Apr. 7, 2026 | Brent spot peaks at $138.21. | Price | link |
| Apr. 22, 2026 | Golden Pass LNG ships its first cargo. | Supply | link |
| Jun. 15, 2026 | Interim agreement; prospect of Hormuz reopening pushes TTF and JKM lower (June 15–26). | Event | link |
| Jul. 2, 2026 | Brent spot low since the war began, $68.53. | Price | link |
| Jul. 20, 2026 | Houthis announce blockade of Saudi-linked vessels at Bab el-Mandeb. | Event | link |
| Aug. 28, 2026 | Corpus Christi Stage 3 substantially complete (date per WorkBoat summary). | Supply | link |
| Sep. 3, 2026 | Citi: 4Q26 Brent $70, 2027 $65. | Forecast | link |
| Sep. 10, 2026 | IEA Coal Mid-Year Update: record 8.94 Bt coal demand in 2026. | Report | link |
| Sep. 22, 2026 | AAA national diesel record, $6.5276. | Price | link |
| Oct. 6, 2026 | EIA STEO: Brent 4Q26 $105, 2027 $84. | Forecast | link |
| Oct. 11, 2026 | Istanbul Strait (Bosporus) traffic suspended after a tanker engine failure. | Event | link |
| Oct. 12, 2026 | Goldman raises December Brent target to $90. | Forecast | link |
| Oct. 13, 2026 | OPEC MOMR; Morgan Stanley raises 4Q26 Brent to $105; Aramco HQ struck (Kpler). | Forecast | link |
| Oct. 14, 2026 | IEA OMR: 2026 demand −2.6 mb/d; stocks 509 mb below end-February. | Report | link |
| Oct. 15, 2026 | IEA accelerates 20M+ barrels of diesel; ENB Europe gas piece. | Policy | link |
| Oct. 16, 2026 | Panama Canal reported at 33 daily transits (DataPortuaria). | Event | link |
| Oct. 16, 2026 | Brent Dec settles $109.86 (+3.7%), highest close since May; JKM $29.30, highest since Dec. 2022; UKMTO: transits ~70% below pre-war. | Price | link |
| Oct. 17, 2026 | U.S. and Iran both claim control of Hormuz; AAA diesel $6.33. | Event | link |
| Nov. 10, 2026 | Next EIA STEO. | Upcoming | link |
Appendix D. Key passages, verbatim
“Despite lower demand, oil market balances are forecast to remain in deficit through the end of the year, with constrained middle distillate supplies likely to persist well into 2027.”
Source: IEA Oil Market Report, Oct. 14
“Cumulative global observed inventories were a steep 509 mb below pre-war levels by the end of September, with on-land stocks hovering at their lowest levels since at least 2016.”
Source: IEA Oil Market Report, Oct. 14
“Failing this, further demand reductions and the heavy economic costs these will entail may be needed to balance markets.”
Source: IEA Oil Market Report, Oct. 14
“Global coal demand is set to increase by 1.2% in 2026 to reach 8.94 Bt, reversing previous forecasts of a decline.”
Source: IEA Coal Mid-Year Update 2026
“The losses resulting from the Middle East conflict are equivalent to 15% of the amount of new LNG supply that is set to be added globally over the 2026-2030 period.”
Source: IEA Gas Market Report, Q3-2026
“We are not running out of oil, as flows out of the Middle East have largely recovered.” — Norbert Rucker, Julius Baer
Source: The National (Reuters), Oct. 16
“The bank raised its winter forecast for the Dutch TTF benchmark to €90/MWh and said prices could reach €135/MWh if a prolonged Qatar outage, colder weather or other LNG disruptions occur.”
Source: Pipeline & Gas Journal (Reuters), Oct. 16, on Morgan Stanley
“Despite the damage, Qatar would be able to resume normal gas operations within weeks once the strait reopens, Kaabi said last month.”
Source: Baird Maritime (Reuters), Oct. 7
“What we are seeing is not a coal comeback but a reality check for APAC’s energy transition.”
Source: Rystad Energy, June 8
“Existing coal plants operate at $45.57 per MWh, and nearly eight out of ten in our analysis produce electricity for less than $60 per MWh.”
Source: Energy Bad Boys, June 27
“There’s only two ways diesel and gasoline prices can come down. One, demand destruction. Number two, … more refineries.” — Stuart Turley
Source: Daily Caller News Foundation, Oct. 12
Appendix E. Methodology and ENB calculations
Price times: futures are Friday, Oct. 16 settlement prices, read from CNBC quote pages at 8:24 a.m. CT Saturday, Oct. 17. AAA prices are “Price as of 10/17/26,” checked 8:25 a.m. CT. EIA Dated Brent spot runs through Oct. 14. Markets are closed for the weekend; re-check Monday.
Backwardation [ENB CALC]: Dec. 2026 settle $109.86 minus Dec. 2027 settle $86.69 = $23.17.
Days at $100+ [ENB CALC]: count of EIA daily Dated Brent closes at or above $100 from March 1 to Oct. 14, 2026 (82 of 158).
TTF conversion [ENB CALC]: €87.547/MWh × EUR/USD 1.1213 (Yahoo Finance, Oct. 16 close) ÷ 3.412 MMBtu per MWh = $28.77/MMBtu. Reuters’ intraday figure of €88.57 ≈ $29.20 is consistent. “About nine times” = TTF (9.2x) or JKM (9.4x) ÷ Henry Hub November $3.116.
Qatar share [ENB CALC]: 0.6 Mt ÷ (80 Mtpa ÷ 12 = 6.7 Mt a month) ≈ 9%. Reuters puts capacity at “nearly 80 Mtpa,” so normal is an approximation.
LNG wave tally [ENB]: EIA Today in Energy capacities in Bcf/d for Rio Grande Phase 1 (2.1), Port Arthur Phase 1 (1.6), Woodside Louisiana (2.2), Golden Pass (2.1, split one-third to Train 1 by ENB) and CP2 Phase 1 (2.0); WorkBoat’s 4 Bcf/d for Plaquemines plus Corpus Christi Stage 3. Others converted by ENB at about 0.13 Bcf/d per Mtpa and 0.0967 Bcf/d per bcm/yr: CC Midscale 8–9 (>3 Mtpa ≈0.4), Rio Grande 4–5 (~12 Mtpa ≈1.6), Port Arthur Phase 2 (~13 Mtpa ≈1.7), CP2 Phase 2 (40 bcm/yr total minus Phase 1 ≈1.9), Commonwealth (13 bcm ≈1.3), Delfin FLNG 1 (6 bcm ≈0.6). Total about 21.5 Bcf/d. Plaquemines and part of Corpus Christi Stage 3 were already exporting in 2025, so the tally overlaps 2025’s 15.1 Bcf/d of exports. Rio Grande Trains 4 and 5 reached FID Sept. 9 and Oct. 16, 2025 (NextDecade). Timing buckets are ENB’s reading of company and press guidance; nameplate and peak ratings differ, and dates slip.
Export averages [ENB CALC]: mean of EIA weekly U.S. crude oil exports and total petroleum product exports for weeks ending Jan. 2–Oct. 9, 2026, versus all 2025 weeks.
Fill-ups [ENB CALC]: 30 gallons × AAA diesel and 15 gallons × AAA regular, today and a year ago.
Investor returns [ENB CALC]: Yahoo Finance closing prices, Oct. 16, 2026 versus Dec. 31, 2025. Brent and Henry Hub use continuous front-month futures, which roll between contracts. Not investment advice.
Coal: U.S. 2026 tonnage is ENB’s 410 Mt × (1 − 7%) ≈ 381 Mt; China 2026 is the IEA’s “5 Bt.” Germany data are generation (TWh), not tonnes.
Scenario ranges: ENB groupings of published forecasts and the 2026 price record. They are not ENB forecasts.
Rounding: dollars to the cent where quoted; percentages to whole numbers unless a decimal matters.
Appendix F. Perspective guide: who said what
| Voice | Perspective | View in this story |
| U.S. EIA | Official statistics | Brent under $100 from December; $84 in 2027 |
| IEA | Intergovernmental (importers) | Deficit through year-end; surplus 2027; demand −2.6 mb/d |
| OPEC | Producer group | Demand still growing in 2026 |
| Morgan Stanley | Investment bank | $105 4Q26; $100 1Q27; costly freight favors short-haul crude |
| Goldman Sachs | Investment bank | $90 by December; risk “significant”; bull $125 |
| Citi | Investment bank | Reopening means surplus; $65 in 2027 |
| Norbert Rucker, Julius Baer | Private bank analyst | “Not running out of oil” |
| Kpler, Lloyd’s List, UKMTO | Ship-tracking and maritime security | Hormuz still far below normal; attacks continue |
| Rystad Energy | Analyst | Asian coal shift is a “reality check,” not a comeback |
| Energy Bad Boys (Orr, Rolling) | Mandate-critical think tank | Existing coal is cheap and reliable; names outliers at both ends |
| Michigan AG / D.C. Circuit / Consumers Energy | State government, court, utility | 202(c) orders overstepped; real compliance costs |
| IECA | Manufacturers’ advocacy (gas buyers) | Limit spot LNG exports to protect U.S. prices |
| Pew Research Center | Nonpartisan polling | 74% very concerned about gas and energy prices |
| Stuart Turley, ENB | Opinion (labeled) | Energy security starts at home; build refineries; keep firm power |
Appendix G. What ENB could not confirm
- Morgan Stanley’s full note. We relied on the investingLive summary; Quantum Commodity Intelligence’s story is paywalled. Aggregator reports crediting the same raise to JPMorgan quoted Morgan Stanley’s Martijn Rats, so we did not use them; we found no JPMorgan note or release.
- Any Citi oil forecast newer than Sept. 3, 2026.
- A primary JKM settlement. We used the Reuters-reported December assessment ($29.30); a CNBC quote page showed 29.93 in an unsettled, synthetic quote that we did not use.
- Kpler’s Hormuz figures are preliminary (Kpler says early counts are typically revised up 1.5–2x) and, by Kpler’s own notes, exclude Iranian-origin cargo and depend on how ship-to-ship transfers are dated.
- Qatar’s exact pre-war monthly export average; ENB used Reuters’ “nearly 80 Mtpa” ÷ 12.
- Firm start dates for Golden Pass Trains 2–3; the company says only that they come online “in turn.” LNG wave timing in general is ENB’s reading of guidance.
- An IEA or EIA publication of the OPEC+ spare-capacity reasoning; the “stranded behind the strait” wording is ENB’s interpretation of the IEA table.
- A source confirming that Istanbul Strait traffic has fully resumed after the Oct. 11 suspension, or the exact date Panama moved to 33 daily transits (DataPortuaria reported it Oct. 16).
- Whether the U.S. and Iranian claims of “control” of Hormuz reported by Al Jazeera on Oct. 17 change any shipping patterns; UKMTO’s next weekly count will tell.
- A WSJ analyst-survey figure that appeared in early notes; we could not find it in the WSJ text and did not use it. The WSJ market story we cite was updated: its headline now says oil prices rose, while its web address still reads “oil-prices-fall.”
Appendix H. Glossary
Brent / WTI: The world and U.S. crude oil price benchmarks.
Dated Brent: The physical North Sea cargo price, which this year has run far above futures because of freight and insurance.
Backwardation: When near-term futures cost more than later ones, a sign of scarcity now.
TTF / JKM / Henry Hub: European, Asian and U.S. natural gas price benchmarks.
LNG: Liquefied natural gas, shipped by tanker.
Mtpa / Bcf/d / bcm: Million tonnes per year; billion cubic feet per day; billion cubic meters.
FID: Final investment decision, the point when a project is funded and built.
Effective spare capacity: Oil output that can be added quickly and actually delivered.
SPR: The U.S. Strategic Petroleum Reserve.
202(c): The Federal Power Act section DOE uses to order plants to keep running in an emergency.
Newcastle: The Asian seaborne thermal coal price benchmark.
mb/d: Million barrels per day