

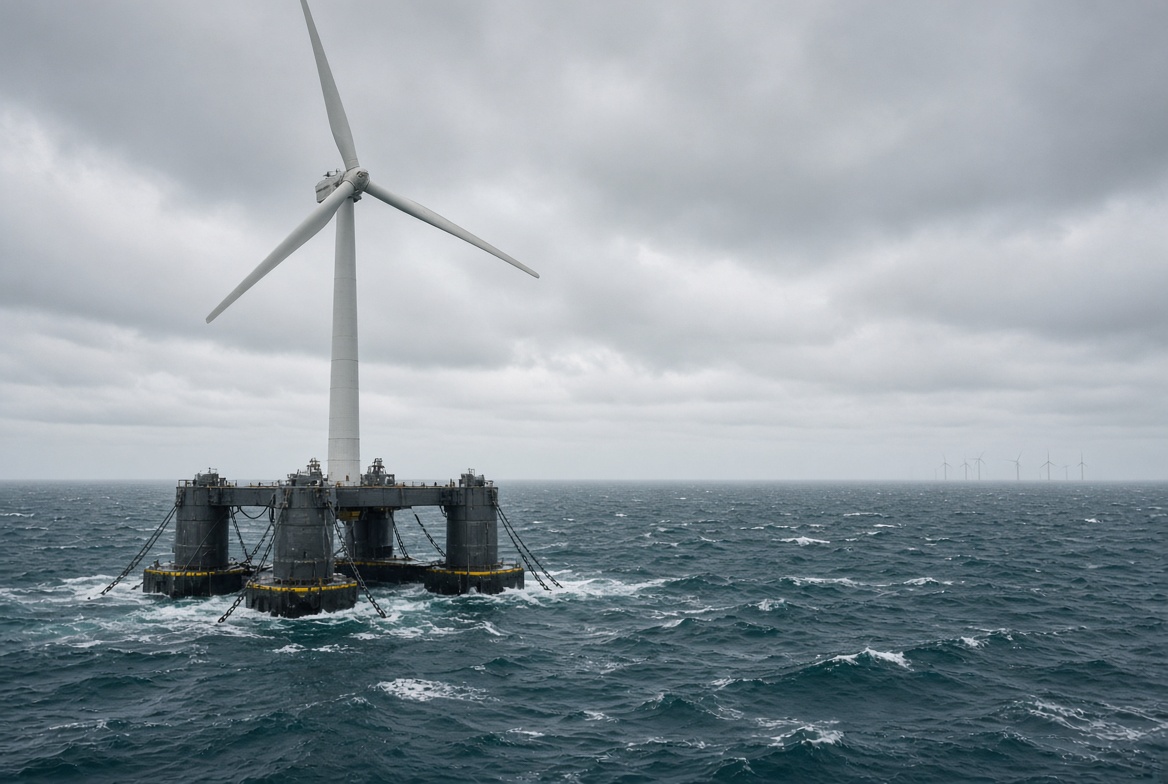
Britain is running out of shallow waters suitable for fixed-bottom offshore wind turbines and is now pivoting aggressively to floating wind farms in deeper seas around Scotland, Wales, and Cornwall. According to recent reporting, the government aims for roughly 3,000 new floating turbines over the next 10–15 years (about 500 by 2030), adding around 30 GW of capacity—equivalent to the UK’s entire current wind fleet. These would be connected by thousands of miles of subsea cables and new onshore substations.
Existing small projects like Hywind Scotland (five turbines operating since 2017 in waters up to 120 m deep) and Kincardine have demonstrated higher capacity factors in stronger deep-water winds (Hywind has reached around 54%). Trade body RenewableUK tracks a substantial pipeline of projects with planning permission or in development. The government has offered significant subsidies, with floating wind strike prices reported around £270/MWh (three to four times typical wholesale prices in earlier discussions) or lower but still elevated figures such as £216/MWh in recent auctions. Port upgrades have received grants in the tens to hundreds of millions of pounds. Proponents, including former Energy Secretary Ed Miliband, frame this as making Britain a “clean energy superpower,” creating jobs (projections of up to 97,000 by 2050) and economic value.
The reality is far costlier and more complex. Embodied Energy, Materials, and Installation Reality
Floating platforms, moorings, anchors, blades, towers, nacelles, and extensive cabling are highly material-intensive, dominated by steel, composites (fiberglass/resin for blades), copper, and concrete or ballast. Life-cycle assessments show materials and manufacturing typically account for 70–80% of global warming potential for offshore (and especially floating) wind. Floating foundations can require more steel or materials per MW than fixed-bottom designs (e.g., spars or semi-submersibles often higher intensity). Steel production alone is energy-intensive; conventional routes emit roughly 1.9–2+ tonnes CO₂ per tonne of steel. Foundations can contribute thousands of tonnes of CO₂e per unit.
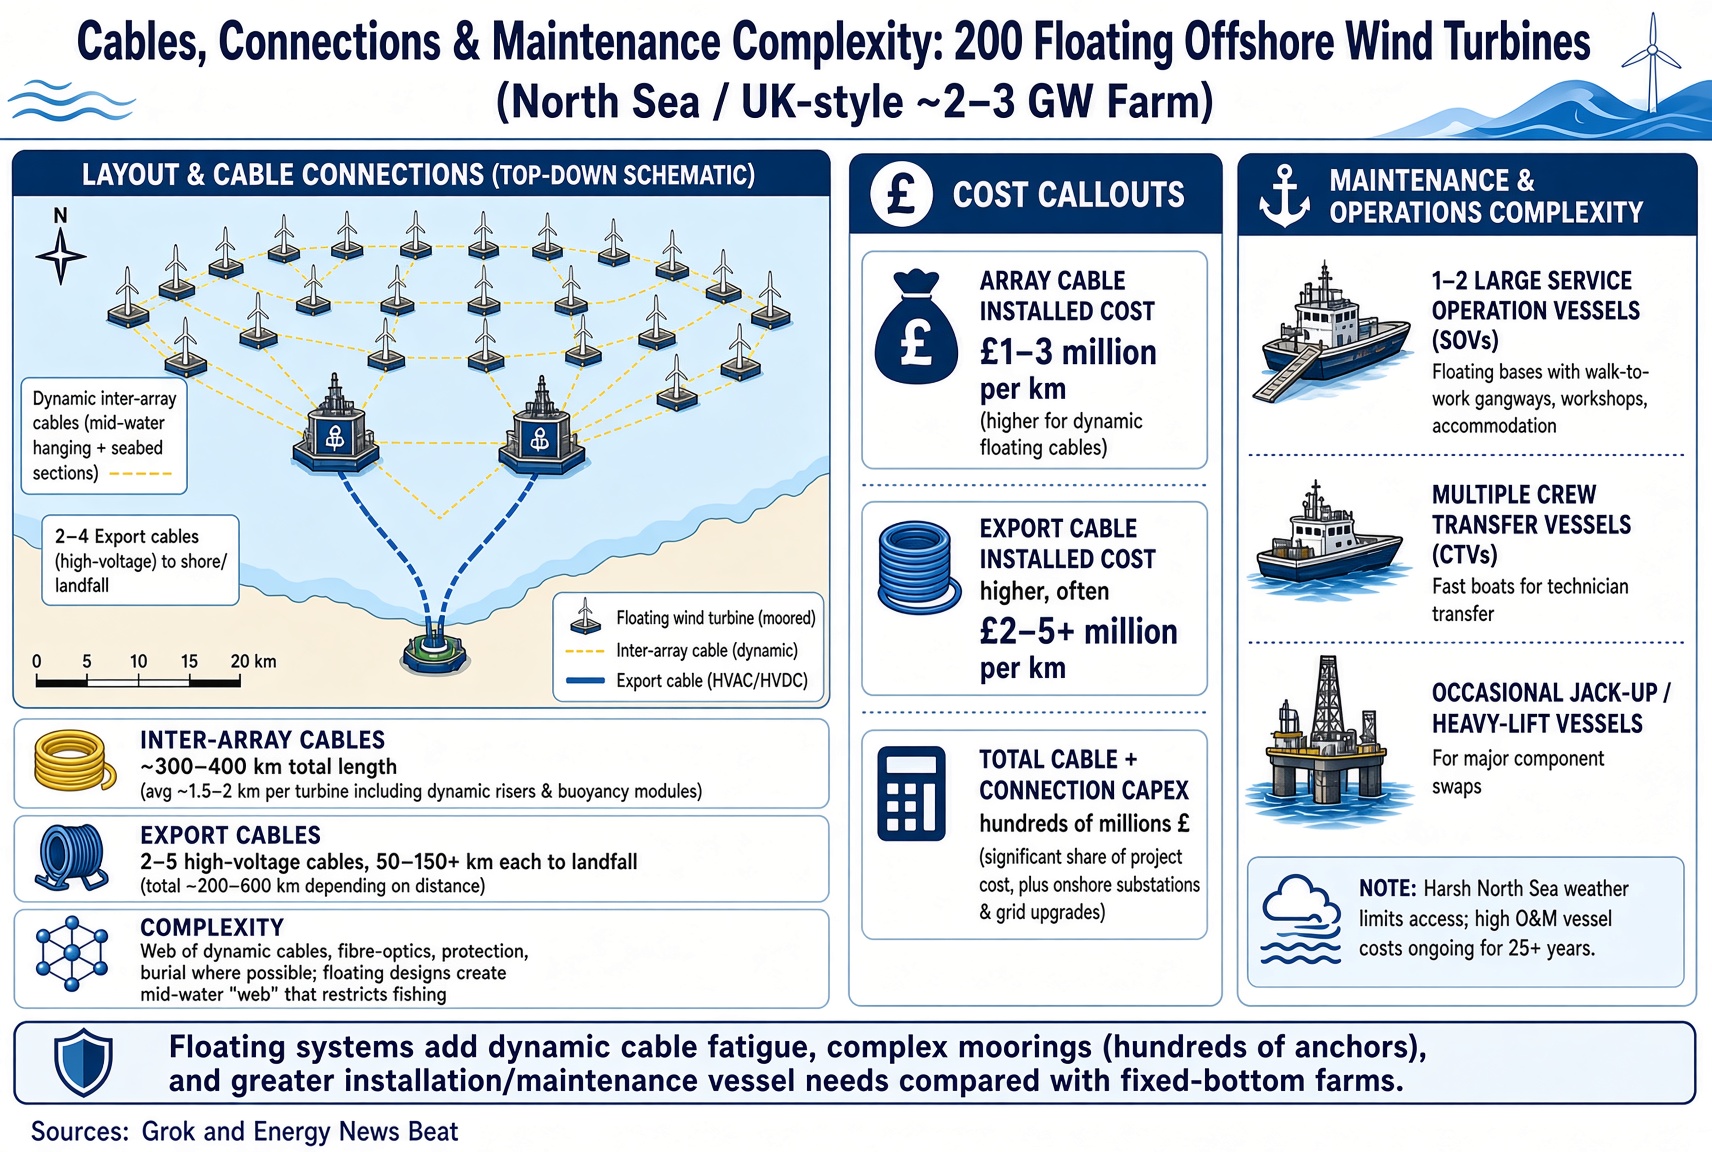
Cables (inter-array and long export HVDC or AC lines spanning tens to hundreds of km), massive anchors/chains, and specialized installation vessels (heavy-lift ships, tugs for towing assembled floaters) add further embodied energy and emissions. Ships and vessels for construction and later maintenance burn significant fuel. While a single turbine may “pay back” the energy in its steel relatively quickly under ideal continuous operation assumptions (months in some green-steel hypotheticals), this ignores system-wide needs, intermittency, the full supply chain (often overseas components), and the fact that floating designs increase material demands. Deeper, more remote sites amplify logistics energy use.
Harsh Maintenance, Durability, and Lifespan Claims
Offshore environments are savage—salt, waves, storms, and corrosion. Moving deeper with floating systems introduces additional stresses from dynamic mooring and platform motion. Operations and maintenance (O&M) already form a large share of lifetime costs for fixed offshore wind (often 16–30% of LCOE or more), driven by specialized vessels (crew transfer, service operation vessels, jack-ups costing tens of thousands of pounds per day), weather windows that limit access (25–40% downtime in campaigns), and higher failure rates/downtime compared to onshore.
Empirical evidence shows operating costs rising with age—around 5% per year in real terms for offshore wind in some analyses—as failures increase. Capacity factors for UK offshore fleets have averaged in the high 30s to low 40s percent in recent years (with variation by wind resource and farm age), not the higher figures sometimes projected for new deep-water sites. Degradation occurs; some studies note declines in output with age. Claims of 25–35-year operating lifetimes face economic reality: high and rising O&M, component replacements (gearboxes, blades, generators), and post-subsidy viability questions suggest shorter practical economic lives for many projects. Floating systems in deeper water will face even greater access and repair challenges.
Limited Grid Benefit and the Natural Gas Backup Imperative
Wind is intermittent. Even with higher capacity factors in deeper waters, output varies dramatically with weather. The UK grid cannot rely on wind alone; natural gas (and other firm capacity) must remain available as a complete backup system to maintain reliability when the wind does not blow. This requires keeping gas plants online or on standby, capacity market payments, and balancing/constraint costs (which have run into billions annually, including payments to curtail wind when the grid cannot accept it).
Adding more intermittent capacity increases system integration costs—transmission upgrades, storage (still limited and expensive), and backup—without eliminating the need for dispatchable generation. Declining overall electricity consumption in recent decades raises further questions about the scale of new subsidized capacity. The net result is not a simple displacement of gas but a dual system: subsidized intermittent generation plus firm backup, with consumers paying for both.
Soaring Costs to Consumers and Deindustrialization
UK industrial electricity prices rank among the highest in developed economies—often double continental European averages and several times US levels in recent data. Low-carbon levies, network costs, CfD subsidies, capacity markets, and balancing charges form a substantial portion of bills. Energy-intensive sectors (steel, chemicals, paper, glass, etc.) have seen output declines, with manufacturers warning of bankruptcy risks and deindustrialization without relief. Government schemes now provide discounts and exemptions for thousands of firms precisely because prices are uncompetitive, effectively shifting more costs onto other consumers or taxpayers.
Floating wind’s higher capital and ongoing costs, locked in via long-term guaranteed prices well above market wholesale levels, will add further pressure. Electricity consumption has fallen even as policy pushes electrification, while manufacturing competitiveness erodes.
Atmospheric CO₂ Context: Scale and UK Contribution
Atmospheric CO₂ has risen from pre-industrial levels around 280 ppm to about 315 ppm when continuous Mauna Loa measurements began in 1958, and to roughly 420–426+ ppm in recent years (2023–2024 data). The increase has accelerated.
The UK’s share of current global CO₂ emissions is under 1% (around 0.8% in recent figures). Cumulatively since the Industrial Revolution (from ~1750/1850), the UK accounts for roughly 3–4.3% of historical fossil/industrial CO₂ (higher, around 5%, in some analyses that include colonial-era emissions outside its modern borders). The United States holds the largest historical share (around 20–25%), China has risen rapidly to the largest annual emitter (around 30%+ recently) with a growing cumulative total, and other major contributors include Russia, India, and various European nations. Global emissions growth has been driven overwhelmingly by developing economies’ industrialization and energy demand in recent decades.
UK (and broader Western) investments in wind, solar, and storage have coincided with rising consumer and industrial energy costs and manufacturing challenges, while global atmospheric CO₂ continues its upward trajectory driven by the largest emitters. The marginal impact of UK floating wind on global concentrations is negligible relative to the domestic economic cost.
Britain’s doubling down on floating offshore wind locks in higher long-term energy costs for an intermittent resource that still requires a full gas-backed system. Material and energy intensity of construction, escalating maintenance in harsher, deeper environments, grid integration realities, and the tiny share of global emissions attributable to the UK all point to expensive symbolism over substantive, affordable energy security or climate impact. Consumers and industry will continue to pay the price.
And in the United States, Blue States will follow the climate crisis zealots. So get out and vote as your energy bill depends on it. You have to ask why Blue States are 38% higher in energy costs – consistently. – Just saying Clark
Appendix: Sources and Links
- Primary article: “Britain turns to floating wind farms as it runs out of shallow waters,” Jonathan Leake, The Telegraph / Yahoo News, August 21, 2026. https://www.yahoo.com/news/science/articles/britain-turns-floating-wind-farms-050000888.html (and related Telegraph coverage).
- UK offshore wind project pipelines and auctions: RenewableUK / Crown Estate data, GOV.UK CfD AR7 results and notes (e.g., 2025–2026 announcements on capacities, strike prices including floating ~£216/MWh examples).
- Embodied carbon/energy and LCA of floating/offshore wind: Studies in Journal of Cleaner Production, Energies (MDPI), ScienceDirect papers on foundations (steel intensity, gCO₂/kWh ranges 4.7–6.4 for floating over 25 years), marine.gov.scot EIA appendices, and related analyses showing materials/manufacturing dominance (70%+).
- Maintenance, O&M costs, capacity factors, and lifespan: DESNZ/Arup renewable generation costs reports; REF.org.uk performance analyses; academic papers on UK offshore capacity factors and aging effects; industry reports on vessel costs and failure rates.
- UK energy prices, subsidies, and industrial impacts: GOV.UK announcements on industrial competitiveness schemes (BICS, Supercharger); FT, Guardian, Make UK surveys on high prices and deindustrialization risks; ONS/IEA industrial price data; analyses of levies and constraint costs.
- Atmospheric CO₂: NOAA/Mauna Loa / Scripps Keeling Curve data (1958–present ~315 to 420+ ppm); ice-core historical context (~280 ppm pre-industrial).
- National/historical CO₂ shares: Our World in Data (UK ~0.8% recent annual, ~4.3% cumulative); Carbon Brief analyses of historical responsibility (including colonial adjustments); Global Carbon Project / Statista country rankings (US historical lead, China current annual lead).
Additional supporting data drawn from Crown Estate Celtic Sea leasing announcements, DESNZ technical assumptions, and peer-reviewed LCA literature on offshore wind materials and vessels. All figures are approximate and subject to project-specific variation; readers should consult primary sources for the latest official numbers.