

U.S. energy exports have surged to unprecedented levels in 2026, driven by global supply disruptions from the ongoing conflict in the Middle East and the effective closure of key Persian Gulf shipping routes. According to The Wall Street Journal, crude oil and petroleum product exports reached a record of nearly 12.9 million barrels per day (bpd) last week, while liquefied natural gas (LNG) exports set an all-time high in March.
This boom reflects a major shift in global energy markets, with Asia and Europe turning to reliable U.S. supplies of crude, refined products, jet fuel, and natural gas to offset shortages from the region. The U.S. is capitalizing on its status as the world’s top energy producer and exporter, filling critical gaps and reinforcing its role as an energy superpower amid geopolitical volatility.
Record-Breaking Crude and Petroleum Product Exports in 2026 YTD
Year-to-date 2026 data shows a sharp acceleration in U.S. exports compared to 2025 levels. In January 2026, total crude oil and petroleum products exports averaged 10.78 million bpd, building on strong 2025 monthly averages of 10.5–11.4 million bpd (with a December 2025 peak of 11.422 million bpd).
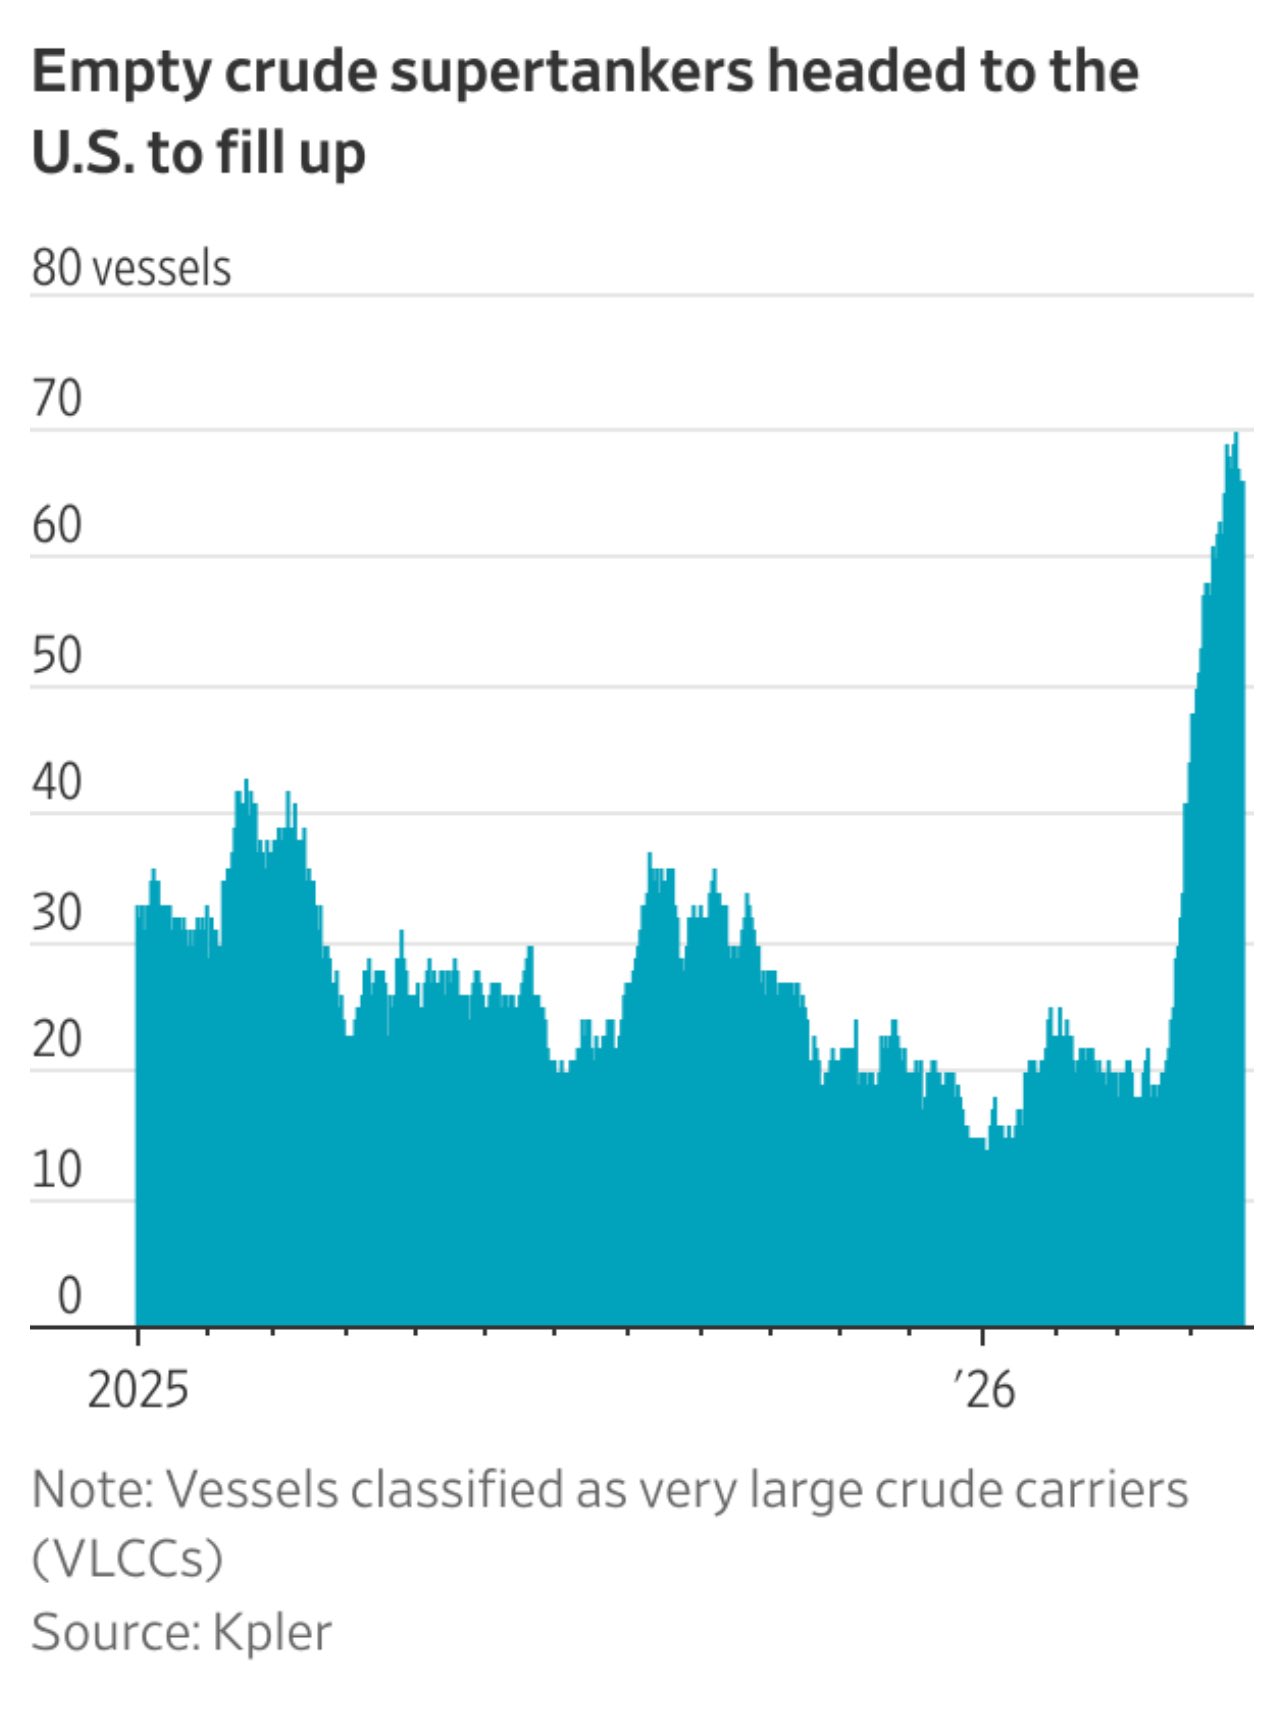
Crude oil exports specifically started the year at 3.922 million bpd in January but have exploded higher. Commodity analysts at Kpler project April 2026 crude exports at a record 5.44 million bpd, with May climbing further to 5.48 million bpd. Weekly data from the U.S. Energy Information Administration (EIA) confirms total crude-plus-products exports hit 12.7–12.9 million bpd in mid-April—the highest on record.
Refined petroleum product exports are also setting new benchmarks. Maritime exports of clean petroleum products (gasoline, diesel, LPG, jet fuel) on clean tankers averaged 6.3 million bpd in January 2026—up about 10% from January 2025 and near record highs, per Vortexa Analytics data cited by the EIA. Total petroleum product exports reached 7.0 million bpd in January (+8% year-over-year). Growth was led by diesel (+19%), gasoline (+7%), LPG (+7%), and jet fuel (+78%).
By March, clean product exports hit a Kpler record of about 3.11 million bpd, with April projections at 3.59 million bpd.
Petrochemical Feedstock Exports Surge
Petrochemical-related exports have joined the rally. U.S. naphtha exports—a key feedstock for plastics and chemicals—reached a record ~15 million barrels in March 2026 (per Kpler), with another firm estimating 11.5 million barrels, the highest in four years. This reflects global buyers in Asia (e.g., Japan) scrambling for alternatives as Middle East supplies were disrupted.
LPG and other natural gas liquids, often used as petrochemical feedstocks, also contributed to the clean products growth.
Shifting Destinations: Asia and Europe Lead Demand
Destinations have shifted dramatically toward Asia and Europe as buyers replace lost Middle East volumes:Asia: U.S. crude shipments are surging—2.27 million bpd in April rising to a projected 3.29 million bpd in May. Refined product exports to Asia are up sharply, from just 132,000 bpd in January to 386,000 bpd expected in April.
Europe: Diesel exports more than doubled to 396,000 bpd in January 2026 (vs. 167,000 bpd in January 2025), overtaking traditional South American markets in some periods. Overall fuel exports to Europe rose nearly 27% month-over-month in March.
Other notable flows include increased exports to Africa (+169% for fuels in March) and sustained volumes to traditional partners like Canada, South Korea, Taiwan, and the Netherlands.
These shifts highlight how U.S. exporters are pivoting quickly to meet urgent global demand.LNG Exports Also at All-Time Highs
Natural gas exports via LNG continue their upward trajectory. March 2026 saw a record 11.7 million metric tons exported, with Europe taking ~64% (about 7.49 million tons). Louisiana facilities handled a disproportionate share amid strong international premiums over U.S. Henry Hub prices.
The U.S. set annual LNG records in 2025 (>100 million metric tons), and 2026 is on pace to build on that momentum despite new capacity ramp-ups.
Jones Act Waiver Facilitates Domestic Energy Flows
Adding to the export story is a significant policy adjustment on the domestic front. In mid-March 2026, the Trump administration issued a 60-day waiver of the Jones Act (Merchant Marine Act of 1920), allowing foreign-flagged vessels to transport oil, refined fuels, natural gas liquids, fertilizer, and related energy derivatives—including petrochemical products—between U.S. ports. The waiver was extended for 90 days in late April, pushing it through mid-August.
This exception has already enabled dozens of foreign tankers to move cargoes domestically (e.g., Gulf Coast to California), easing supply constraints and helping blunt domestic price spikes amid global disruptions. Approximately 40 foreign tankers have been utilized, boosting capacity by ~70% and moving millions of barrels. While not exclusively for petrochemicals, the waiver explicitly covers fossil fuel-based products and derivatives critical to the petrochemical sector, directly addressing intra-state and coastal shipping needs last week and ongoing.
Outlook: A Structural Shift or Temporary Boom?
While current records are impressive, analysts note challenges in converting wartime demand into permanent gains, including infrastructure limits and competition as global markets stabilize. Still, with U.S. crude production near all-time highs and export terminals operating at high utilization, the foundation for sustained leadership is strong.
The 2026 surge underscores America’s energy dominance and its ability to adapt rapidly to market shifts—benefits that flow back to domestic producers, jobs, and energy security.
All data and analysis drawn from the following (accessed April 2025–2026 reporting):
- The Wall Street Journal: “U.S. Energy Exports Hit Records as World Adjusts to a Closed Persian Gulf” – https://www.wsj.com/business/energy-oil/us-energy-exports-persian-gulf-closure-588c257e?mod=mhp
- U.S. Energy Information Administration (EIA) – Weekly Petroleum Status Report & Today in Energy: https://www.eia.gov/todayinenergy/detail.php?id=67184 and https://www.eia.gov/petroleum/data.php
- Reuters: “US crude and fuel exports surge to record highs…” (April 21, 2026) – https://www.reuters.com/markets/commodities/us-crude-fuel-exports-surge-record-highs-its-not-enough-2026-04-21/
- Reuters & Kpler data on crude/product exports and naphtha (multiple April 2026 reports).
- OilPrice.com: “U.S. LNG Exports Soar To Record Levels In March” (April 9, 2026).
- EIA historical export tables: https://www.eia.gov/dnav/pet/hist/LeafHandler.ashx?n=PET&s=MTTEXUS2&f=M
- Reuters on Jones Act waiver/extension (April 23–24, 2026): https://www.reuters.com/business/energy/white-house-expected-extend-jones-act-waiver-up-90-days-sources-say-2026-04-23/ and related coverage.
- Additional context from Bloomberg, Vortexa, and EIA releases on 2026 YTD trends.
Energy News Beat Channel – Delivering the latest in U.S. and global energy markets.