With West Texas Intermediate oil at $100+ per barrel and Henry Hub natural gas quadruple its 2022 open, non-operated interest investors have an unprecedented opportunity to cash in on commodity prices as each operator drills to drive their own capital return strategy. But absent a working interest, non-ops lack any decision-making power in an operator’s go forward development profile. To buy minerals ahead of the drill bit and assess the changing value of an existing portfolio, non-operators need good leading indicators of producer next steps, starting with guidance and disclosures and graduating to a more nuanced analysis of operator behavior.
As investors, we can no longer rely solely on tried-and-true indicators of drilling, such as permits and rig activity (aka, “line of sight”). The industry is in flux and the playing field is repositioning as operator interest shifts to different U.S. basins, DUC inventory backlog continues to burn, M&A accelerates, and development responds more sluggishly to demand with operators seeking to return more value to shareholders instead of reinvesting all their profits. To estimate the timeframe over which their minerals will be developed, a non-operator needs to consider how acreage development will evolve for each operator active in their area given the range of options those operators have available and market pressure. That requires analysis of proved developed producing (PDP) acreage on an operator-by-operator basis and untangling the complexities of proved undeveloped (PUD) reserves. It’s all about having the right data and workflow.
High grading operator PDP potential
The rising tide lifts all boats, but as mineral and royalty owners we certainly know that not all E&Ps are created equal or benefit uniformly from higher commodity prices. Low-cost operators and those with prime acreage positions and large drilling inventory are at an advantage. Even within a sub-basin, we shouldn’t think of E&Ps as uniform producers. Production can vary based on what formations are targeted (critical in the stacked pay of the Permian), an operator’s holdings across basins, production economics, and the range of hydrocarbons each operator produces (e.g., dry gas, grades of crude, NGL).
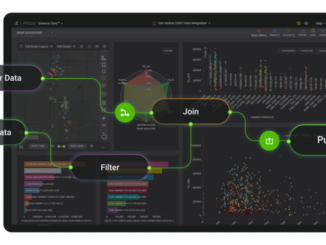
Using PRISM, we can begin assessing EUR based on type curves assigned to each well in an operator’s portfolio and see which locations E&Ps are most levered to. In just minutes, we can understand where an operator’s go forward production profile will move based on current production and inventory.
From a non-op investment point of view, it’s important for us to see who is most active in each basin (and not necessarily just our area of interest), how producers are shifting PDP focus, and what drilling activity is required to maintain decline profiles. For some operators, this profile might be maintained through continued development in the same areas based on inventory and rig activity. However, given ongoing repositioning, investors should never assume that operators will continue replacing production, even in areas where they have inventory.
Figure 1: Production by operator (left) and allocation into each basin (right).
Putting a value on undeveloped upside
Under the current state of the market, undeveloped drilling activity is the greatest source of uncertainty that requires a more complex analysis to assess PUD upside. We need to see ahead of the bit based on what is disclosed in filings and read between the lines to glean the value of undeveloped go forward production, land and drilling program economics. We also need to better assess the economics of each operator’s portfolio as they rearrange or refocus following M&A. At the end of the day, investors really want to know just how long they can continue to collect royalties from their portfolio.
Mining the Past for Insights
To understand how to move forward we need to understand historical activity to see how we arrived at today’s strong production output.
Using PRISM, we can look at well count over time across operator positions and see when and where production came online. From the historical well count chart, we can see well counts have returned to pre-pandemic levels. A shift in capital discipline and emphasis on free cash flow point toward sustained production and returns, which is great from a minerals and royalties perspective because it would indicate that new wells could be developed on our properties, adding to revenue streams. But we have noticed an interesting shift in production from the Delaware to the Midland Basin where a greater backlog of inventory (DUCs) exists.
Rig activity provides a better indicator of go forward PUD production. DUC draw down is impacting go forward development in the short term as drilling continues to lag pre-pandemic rig count (Figure 2), but it may not return to past levels and, from a non-op position, it’s important to dig deeper to determine whether this basin-level recovery trend will actually add any new production to our portfolio. Indeed, the following PRISM charts show that for one non-op interest owner in the Delaware the trend is flat compared to the steep uptick for the Permian.
Figure 2: Basin-level drilling vs. drilling activity on a mineral company’s position.
While Permian rig recovery has been steady, rig activity has been flat for some minerals-exposed companies in parts of the Delaware, as the above example illustrates. Continuing with this example in PRISM, we can dive into current rigs and allocation for the minerals exposure to identify the operators and regions at play. This is where line of sight can help reduce uncertainty of which wells will be put on production.
From PRISM we can easily see the operators who have line of sight wells in the minerals position and their status from permit to DUC and completion. We can then see which operators will contribute the most to the near-term production profile for our example minerals position. Using offset well analysis we can better forecast the go forward production profile and get accurate EURs for the formations DUCs are drilled in which will directly impact near term cashflow.
Operator benchmarking
Looking further ahead, it’s important for minerals and royalty investors to understand the economics of the land in their portfolio as well as the operators drilling the wells. From PRISM we can drill into operator benchmarking to assess the value of a mineral position’s economics and how operators compare on a peer-to-peer basis.
Figure 3: Breakeven for Delaware and Midland Basins based on associated LOE and productivity metrics.
The above scatterplot shows the relative strength of top operator wells (P10 – P90) and compares hydrocarbon recovery and costs to gauge the breakeven costs across the Permian. It’s clear that the Delaware Basin provides superior economics, but activity is shifting away to the Midland Basin. To untangle what is driving this trend, we’ll need to isolate operator activity for a clearer picture of go forward activity. From PRISM we can quickly identify Devon and EOG as the top producers in the Delaware.
Figure 4: Top operators in the Delaware Basin.
Even though overall production in the Delaware has leveled off, Devon’s rig count within the mineral position has dropped from 10 pre-pandemic rigs to two or three, which better informs our view of the go forward revenue stream. The operator has not pulled rigs completely out of the Delaware, but it has rearranged its rigs within Lee and Eddy Counties. With PRISM’s ability to overlay your own minerals and royalty position alongside operator acreage, inventory and activity, it’s easy to understand the upside.
Conclusion and key takeaways
Our industry has been rocked by market forces over the last two years, including a global pandemic, geopolitical events, Wall Street’s desire for disciplined growth and shareholder value, a hyperfocus on ESG, and the energy transition, all of which are shaping the go forward strategy for every energy company. The oil and gas industry of the past will not resemble the oil and gas industry of the future. As mineral and royalty investors, the evolving oil and gas landscape presents pitfalls and opportunities to realign. Now more than ever, analytics and contextualized data are what will make or break your portfolio going forward.
To get more details on how to better forecast production timing from line of sight well activity including Frac Crew tracking, and better understand how operator development strategies will affect development of your minerals, email businessdevelopment@enverus.com or call 1-800-282-4245.
Enverus’ forecasting tools provide pre-generated and customizable production forecasts and economics in one platform to gain visibility into operator behavior, near-term cashflow, and asset value to help non-operators confidently make business decisions.
The post Deciphering Minerals Upside: An Analytics-Intensive Approach first appeared on Enverus.