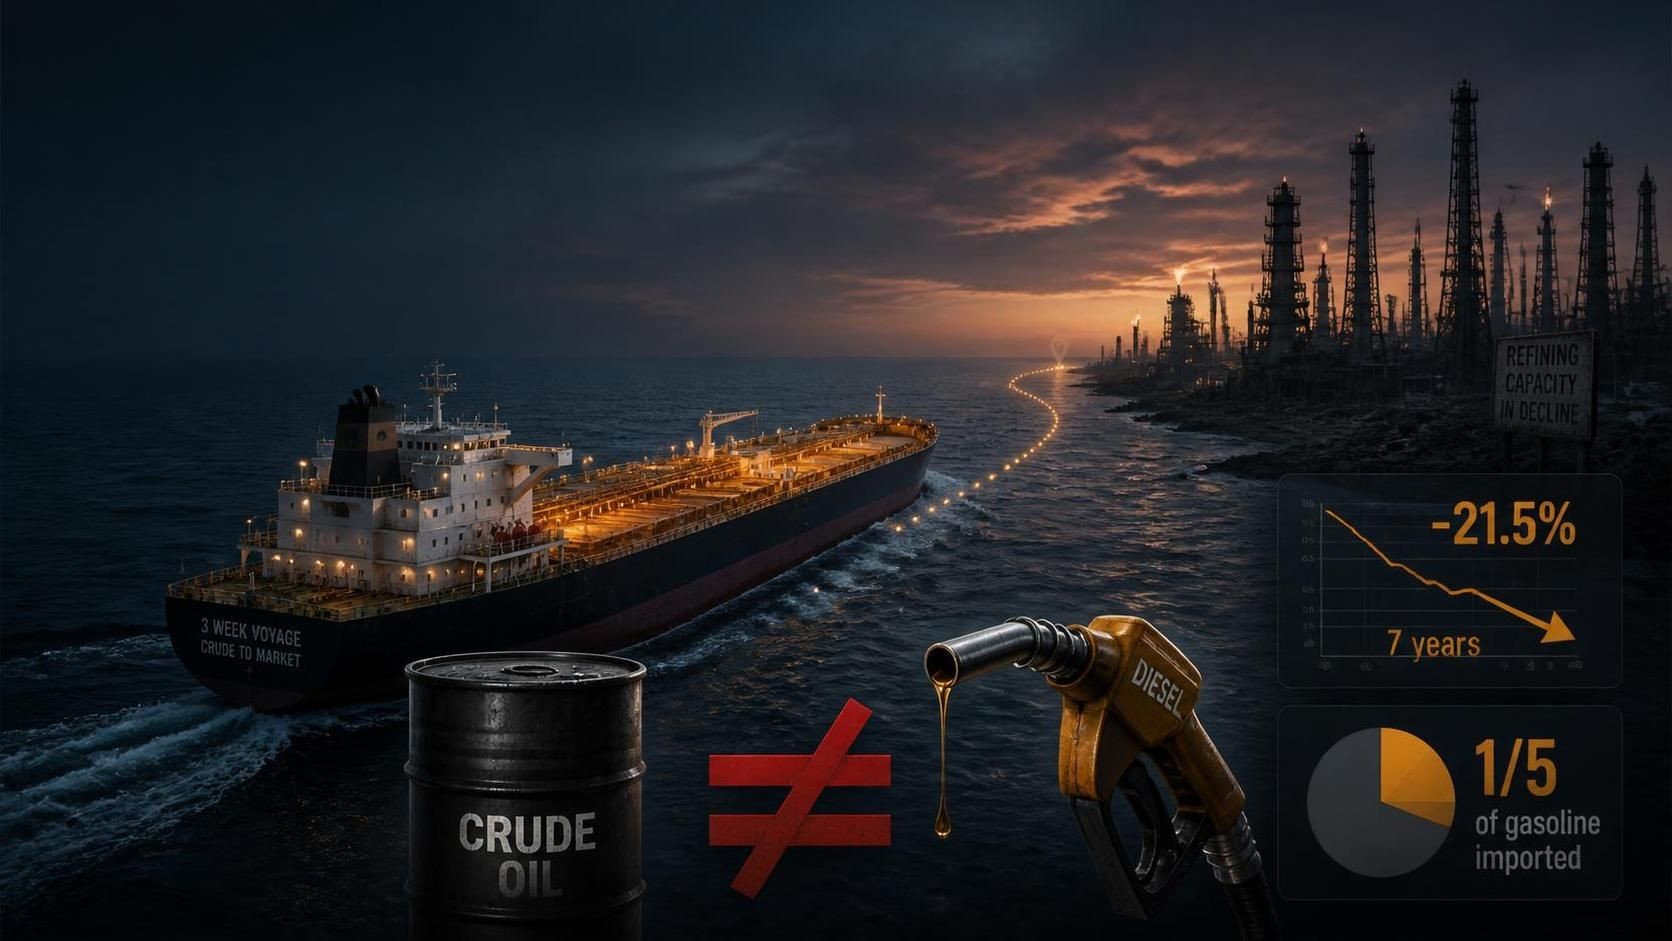
Europe’s refinery rethink is real, smaller than the headlines, and exactly the argument California needs to hear. The state cut 21.5% of its refining capacity in seven years, 64% of the entire national decline, and now buys a fifth of its gasoline across a three-week ocean voyage with no pipeline to fall back on.
By Energy News Beat | Oct. 31, 2026 | Council of the EU doc 14726/1/26 REV 1, read Oct. 30, 2026; EIA Refinery Capacity Report, 2019 and 2026 editions; FuelsEurope/Concawe Statistical Report 2026
On Oct. 28 the European Commission held its first high-level dialogue on oil refining. Energy Commissioner Dan Jørgensen and Defense Commissioner Andrius Kubilius co-chaired it, with NATO at the table beside refiners and technology providers — the first time this dialogue has put refining and defence at the same table.
That refutes the assumption under a decade of policy on two continents: that crude and diesel are interchangeable if you pay the freight. Closing that gap takes steel that cannot be conjured in the week it is needed.
What Europe announced, and what it did not
The direction came from above. The European Council of Oct. 15–16 welcomed the Commission’s intention to “develop a short-term framework to optimise the capacity and efficiency of EU refineries” — optimise, not expand: utilization, not new capacity. That language is the Council’s own: EUCO 14/26 of Oct. 16, 2026, paragraph 6, read in full in the published conclusions.
Here is what the headlines missed. Nothing was announced. No funding. No state-aid mechanism. No capacity target. No exemption. No plant reopened. No next step before early 2027. What emerged was a promise to assess industry proposals, a joint roadmap and support for a Refining Strategy — “a constructive start,” in FuelsEurope’s words.
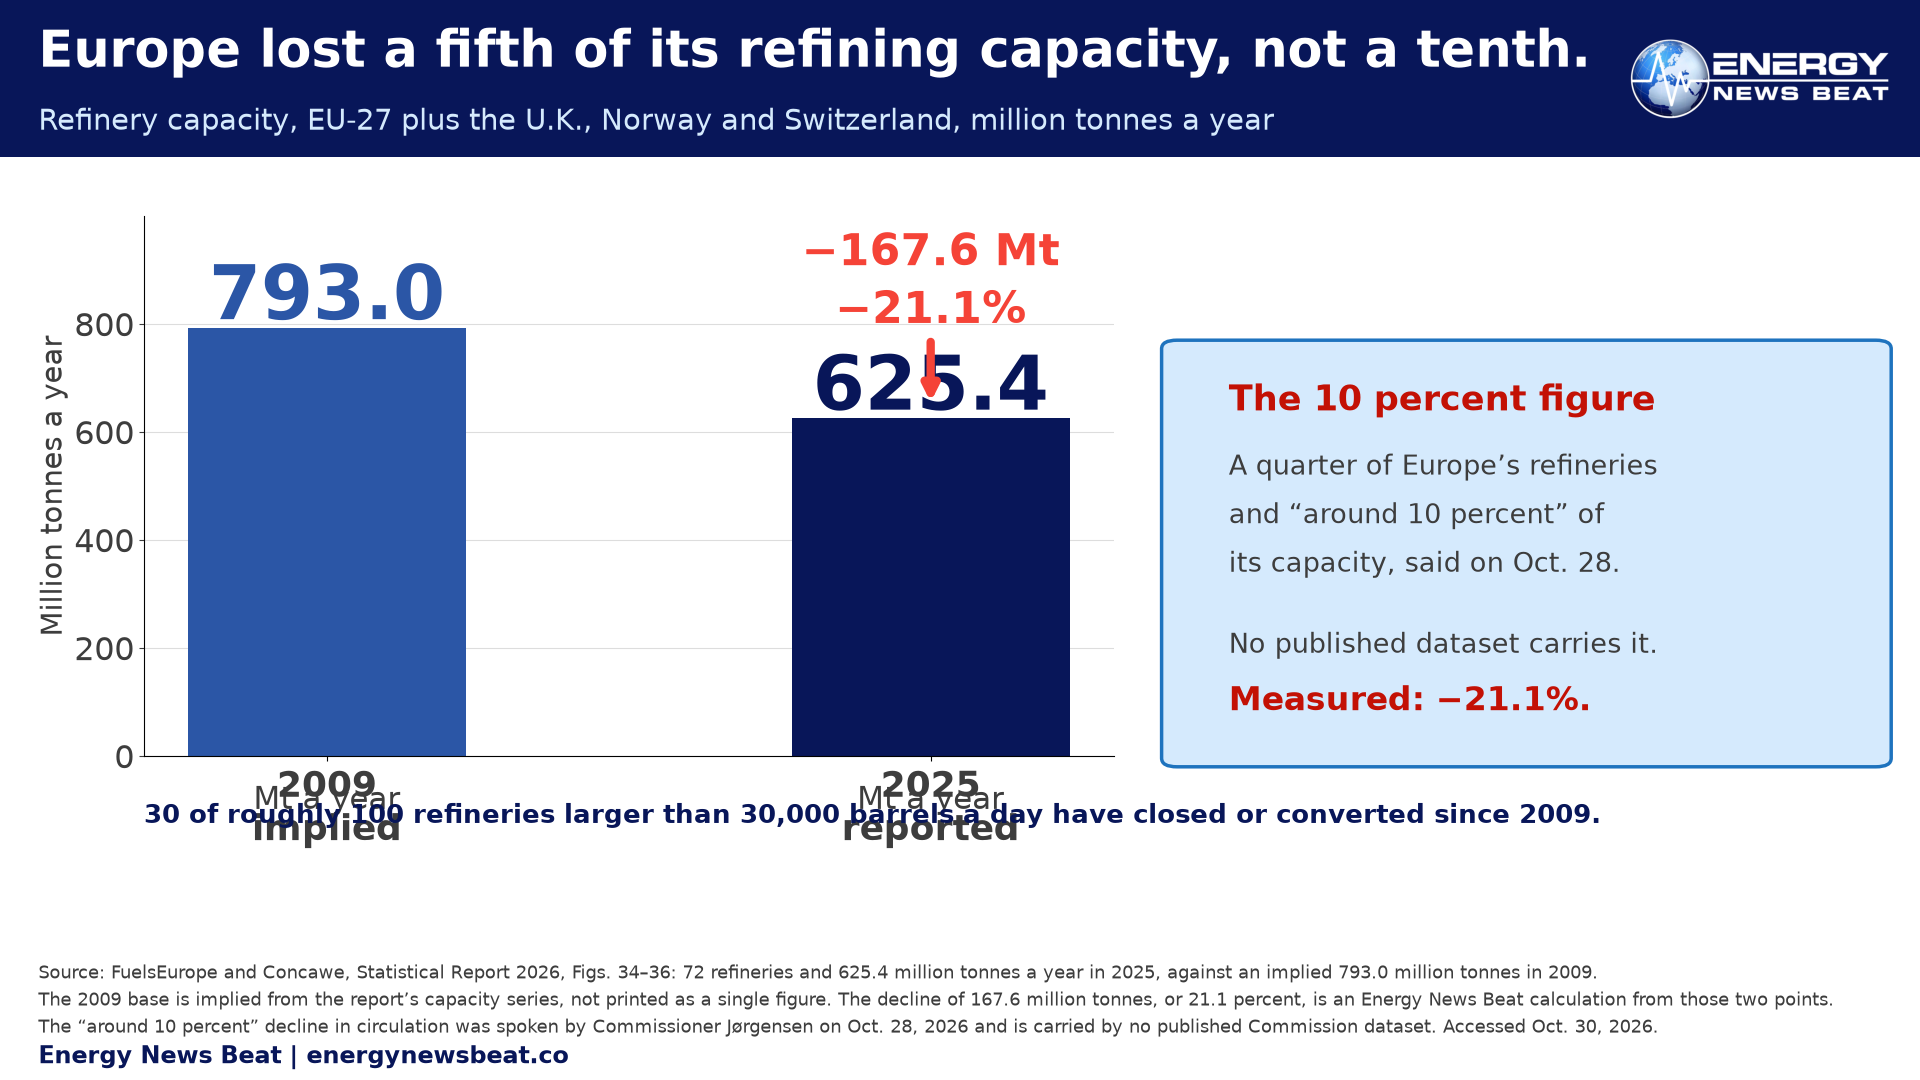
Chart 1. Refinery capacity, EU-27 plus the U.K., Norway and Switzerland: 793.0 million tonnes a year in 2009 (implied) against 625.4 million in 2025, a decline of 167.6 million tonnes, or 21.1 percent. The “around 10 percent” figure in circulation is the Commissioner’s spoken number, carried by no published Commission dataset. Sources: FuelsEurope and Concawe, Statistical Report 2026, Figs. 34–36; the percentage change is an Energy News Beat calculation.
What the six did not ask for matters as much: no moratorium, no capacity floor, no fund, no subsidy. The ask is “access to investment financing”, a door left ajar — as is the €27 billion NATO programme for storage and pipelines: defence logistics, not a refinery subsidy.
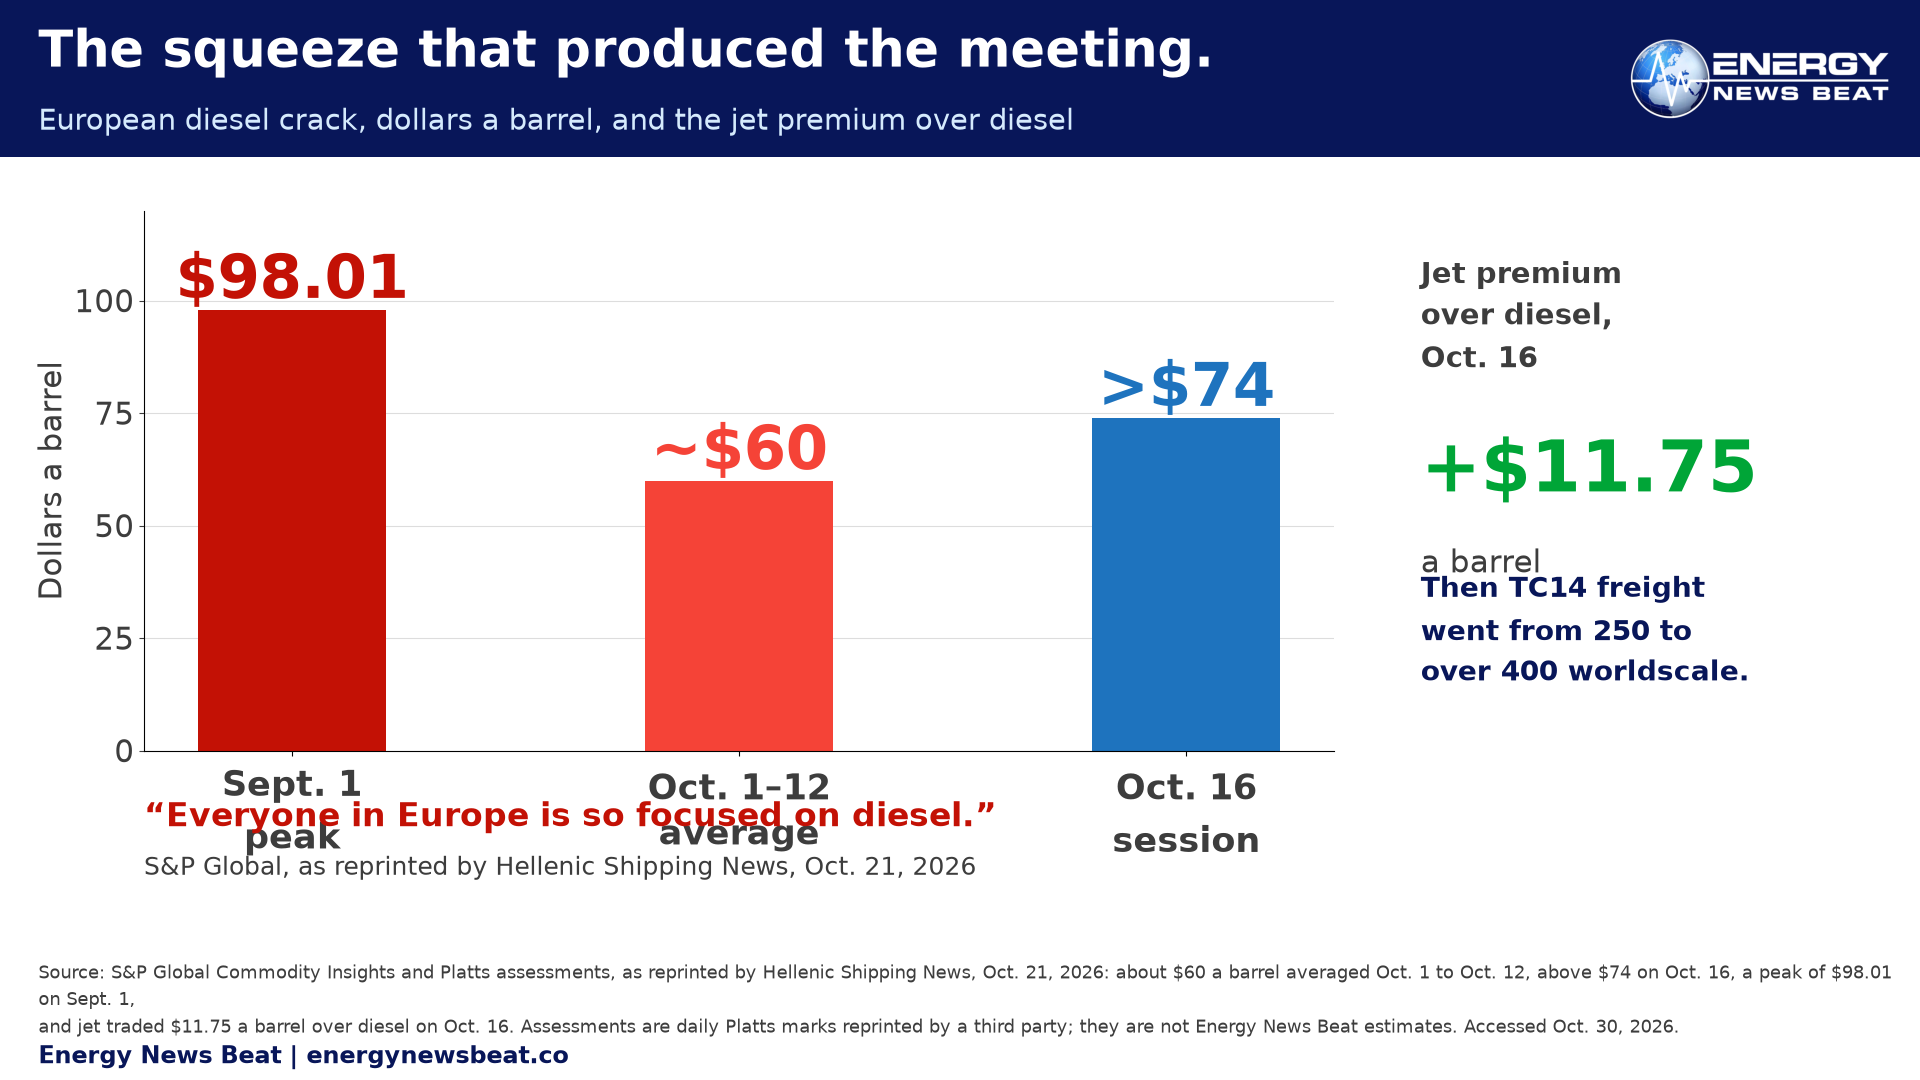
Chart 2. European diesel crack, dollars a barrel: a peak of $98.01 on Sept. 1, 2026, about $60 averaged Oct. 1 to Oct. 12, and above $74 on Oct. 16, when jet traded $11.75 a barrel over diesel. Source: S&P Global Commodity Insights and Platts assessments, as reprinted by Hellenic Shipping News, Oct. 21, 2026.
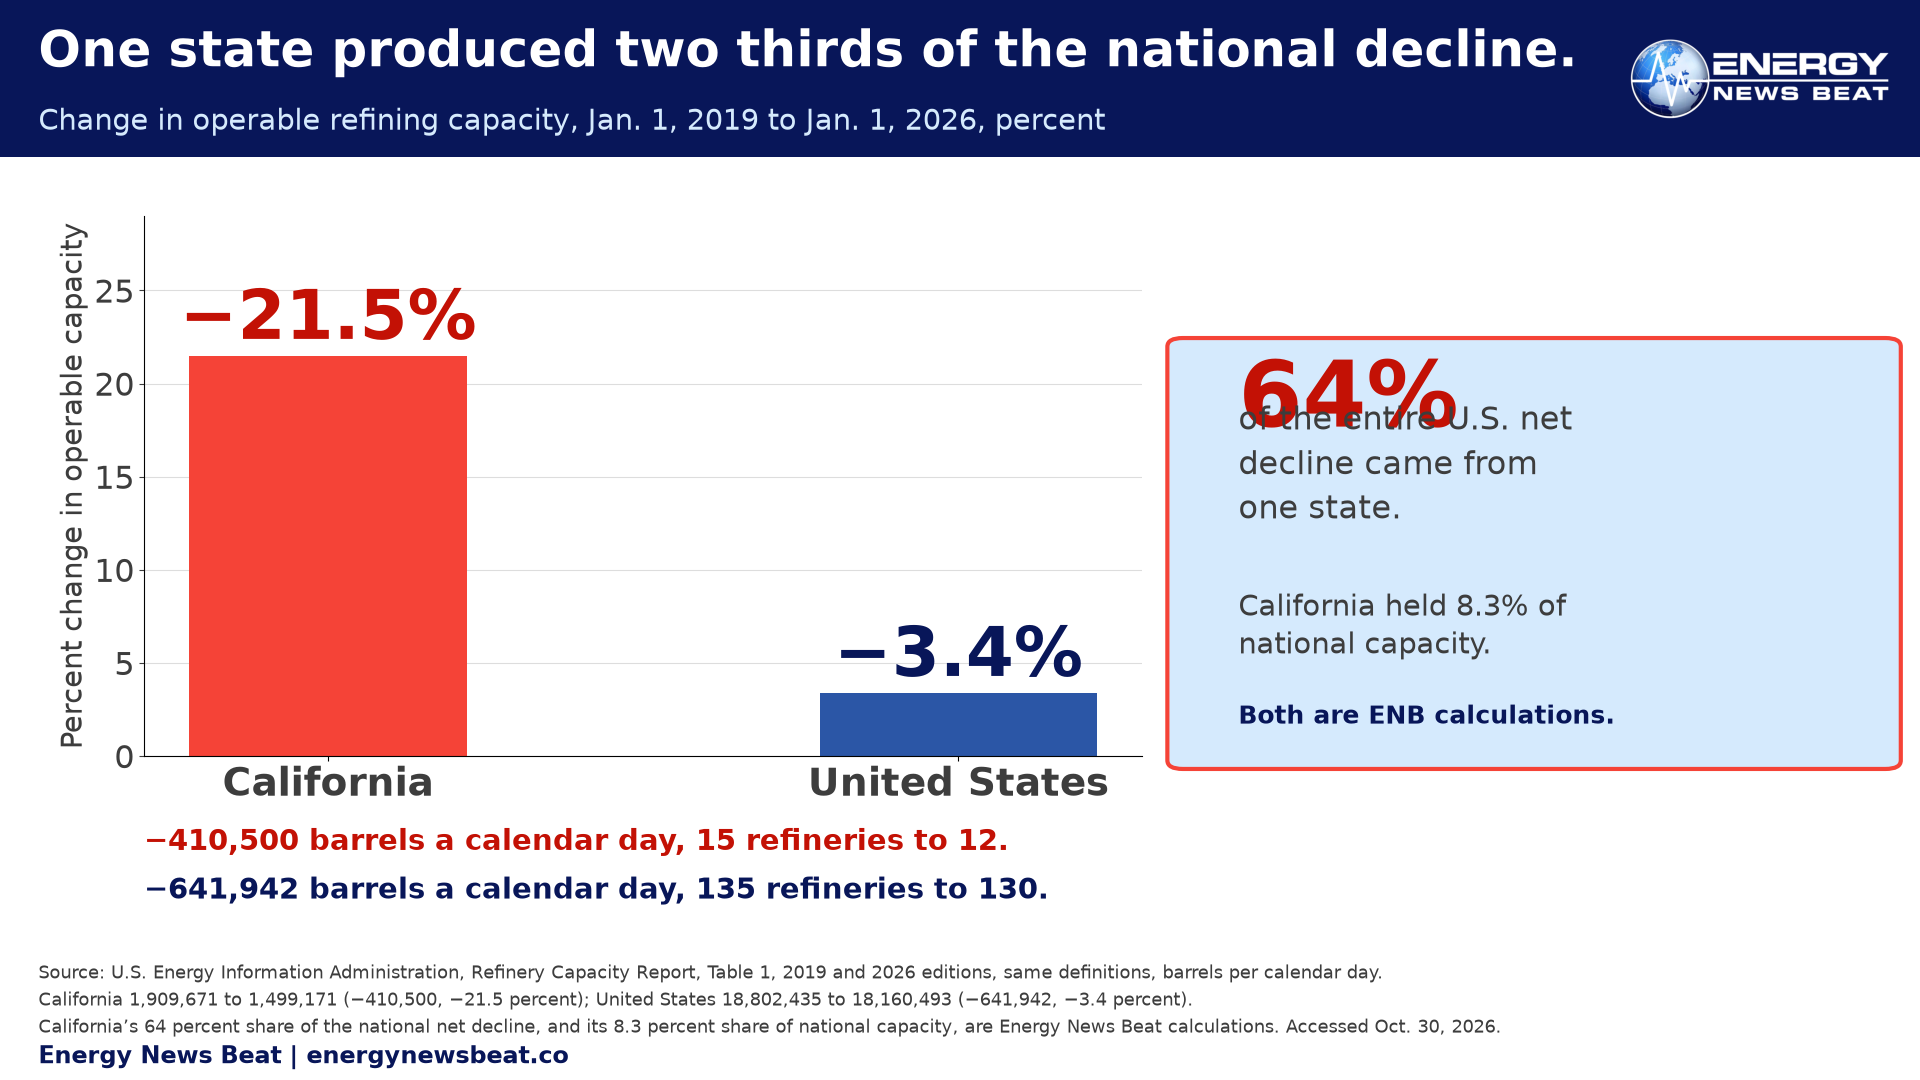
Chart 3. Operable refining capacity, Jan. 1, 2019 to Jan. 1, 2026: California down 410,500 barrels a calendar day, or 21.5 percent; the United States down 641,942, or 3.4 percent. California supplied 64 percent of the national net decline while holding 8.3 percent of national capacity; both shares are Energy News Beat calculations. Source: EIA Refinery Capacity Report, Table 1, 2019 and 2026 editions.
Two refineries in Martinez is the fact that trips people, and it trips them in both directions. What closed and converted was Marathon’s Golden Eagle refinery at Martinez/Avon — 166,000 barrels a day on a stream-day basis, which EIA counts at 161,000 a calendar day and Marathon’s own 10-K calls Martinez, California, 161 mbpcd — which Marathon idled in 2020 and is converting to renewable diesel. What did not close is the Shell-built Martinez refinery next door: Shell sold it to PBF Energy for $960 million in February 2020, a $1.2 billion deal with the inventory, and PBF still runs it at about 157,000 barrels a day. EIA’s phrasing is right. So is the closure it records. The shorthand that gets it wrong is common enough that this article names both plants.
2025: a buyer search, a $200 million idea, $5.25 million for imports
No bailout passed and no buyer emerged; Valero stopped refining at the end of April 2026. What the state paid for was the terminal. Under AB 113 it appropriated $5.25 million: $3.75 million for city services “as the Valero Benicia Refinery is used for Fuel Import Operations” plus $1.5 million community benefit, backing a standstill from Oct. 1, 2026 to June 30, 2027. The city voted Oct. 20 and will seek $7 million more.
Confronted with a refinery closure, the world’s fifth-largest economy spent $5.25 million to keep imported fuel moving and nothing to keep refining. You cannot order a refinery back to life when the owner is redeveloping and the state is paying for imports.
Washington is running the reversal Sacramento would not
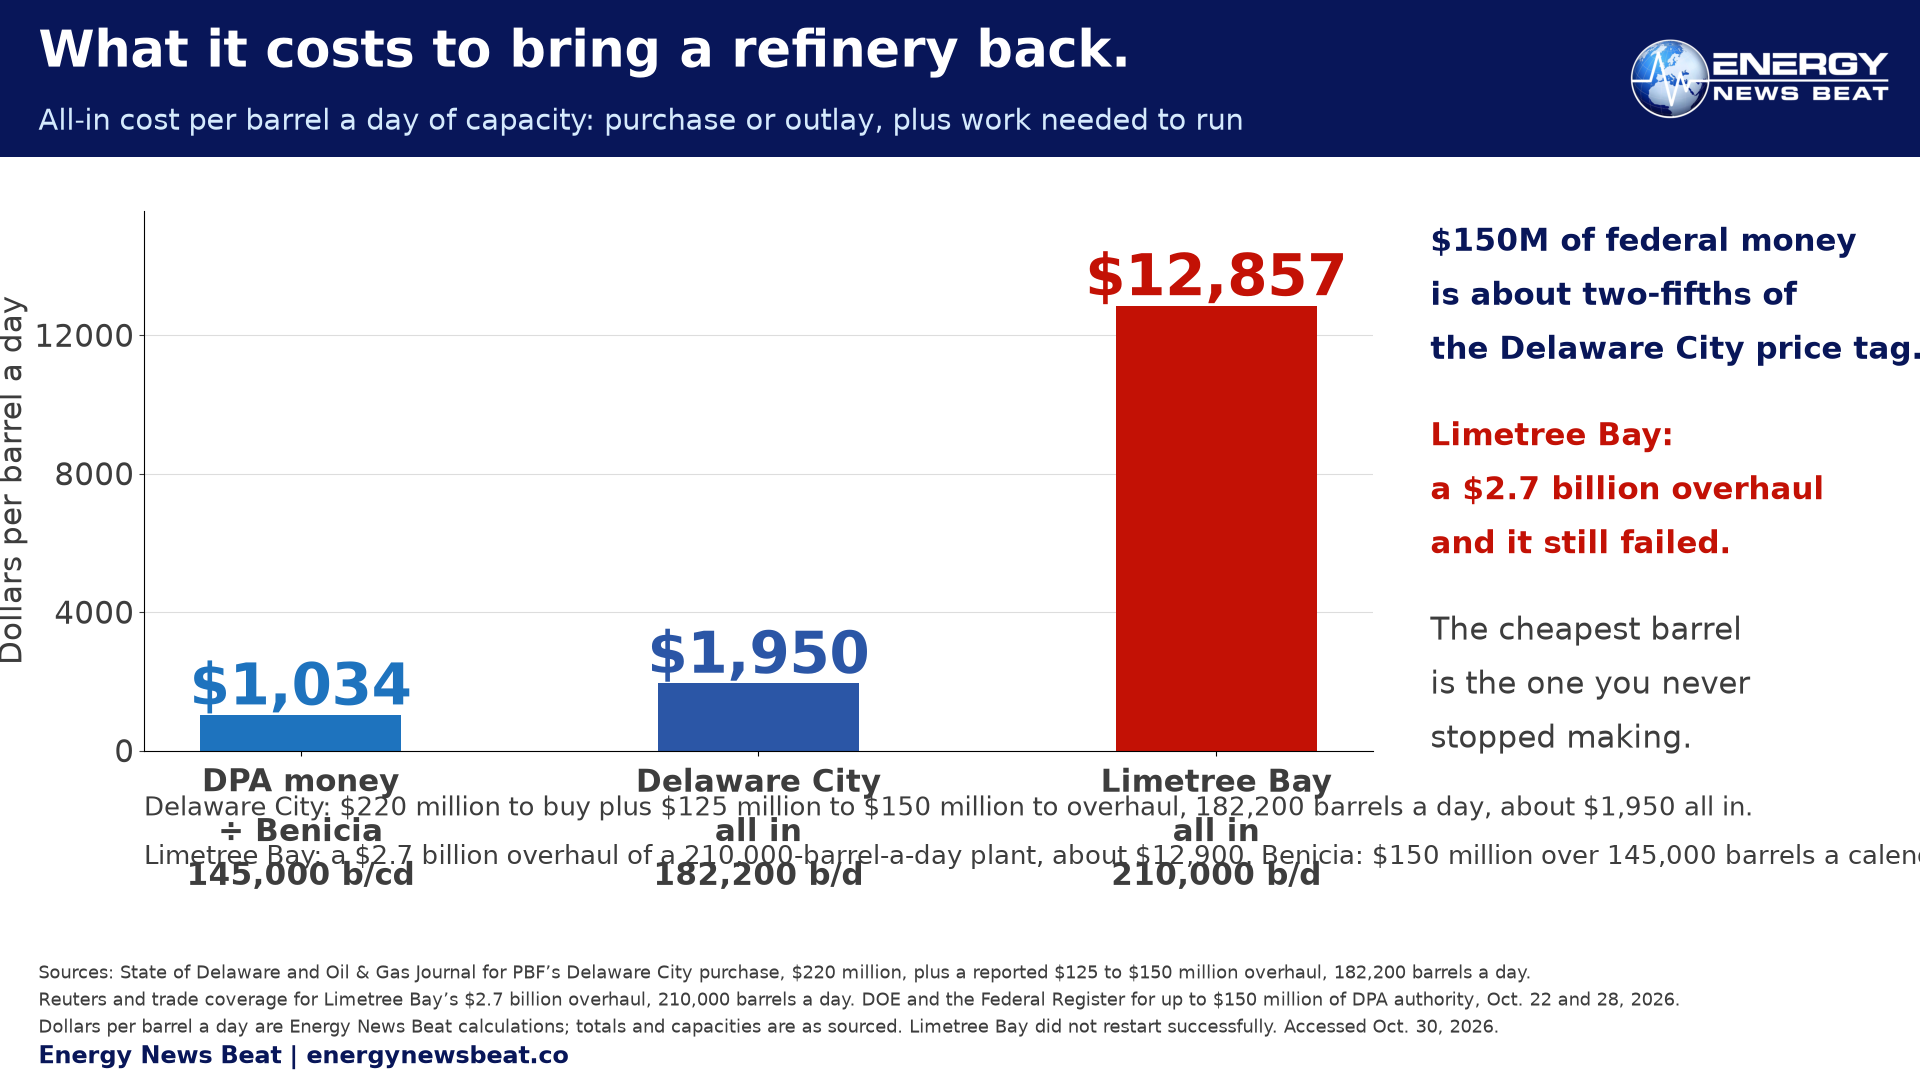
Chart 4. Named restart economics, all-in dollars per barrel a day of capacity: Delaware City, $220 million to buy plus $125 million to $150 million to overhaul 182,200 barrels a day, about $1,950; Limetree Bay, $2.7 billion for 210,000 barrels a day; $150 million of Defense Production Act money spread over Benicia’s 145,000 barrels a calendar day, about $1,034. The per-barrel figures are Energy News Beat calculations. Sources: State of Delaware; Oil & Gas Journal; Reuters as reported by trade coverage; Department of Energy and Federal Register.
Hold 230,000 next to Giannini’s threshold: the import volume needed to fully offset both California closures is 283,000 barrels a day, where the modelled price effect goes to zero. Western Gateway is almost exactly that number, in private capital rather than subsidy. FID is not steel in the ground, but it is the first structural answer to a state with no inbound fuel pipeline.
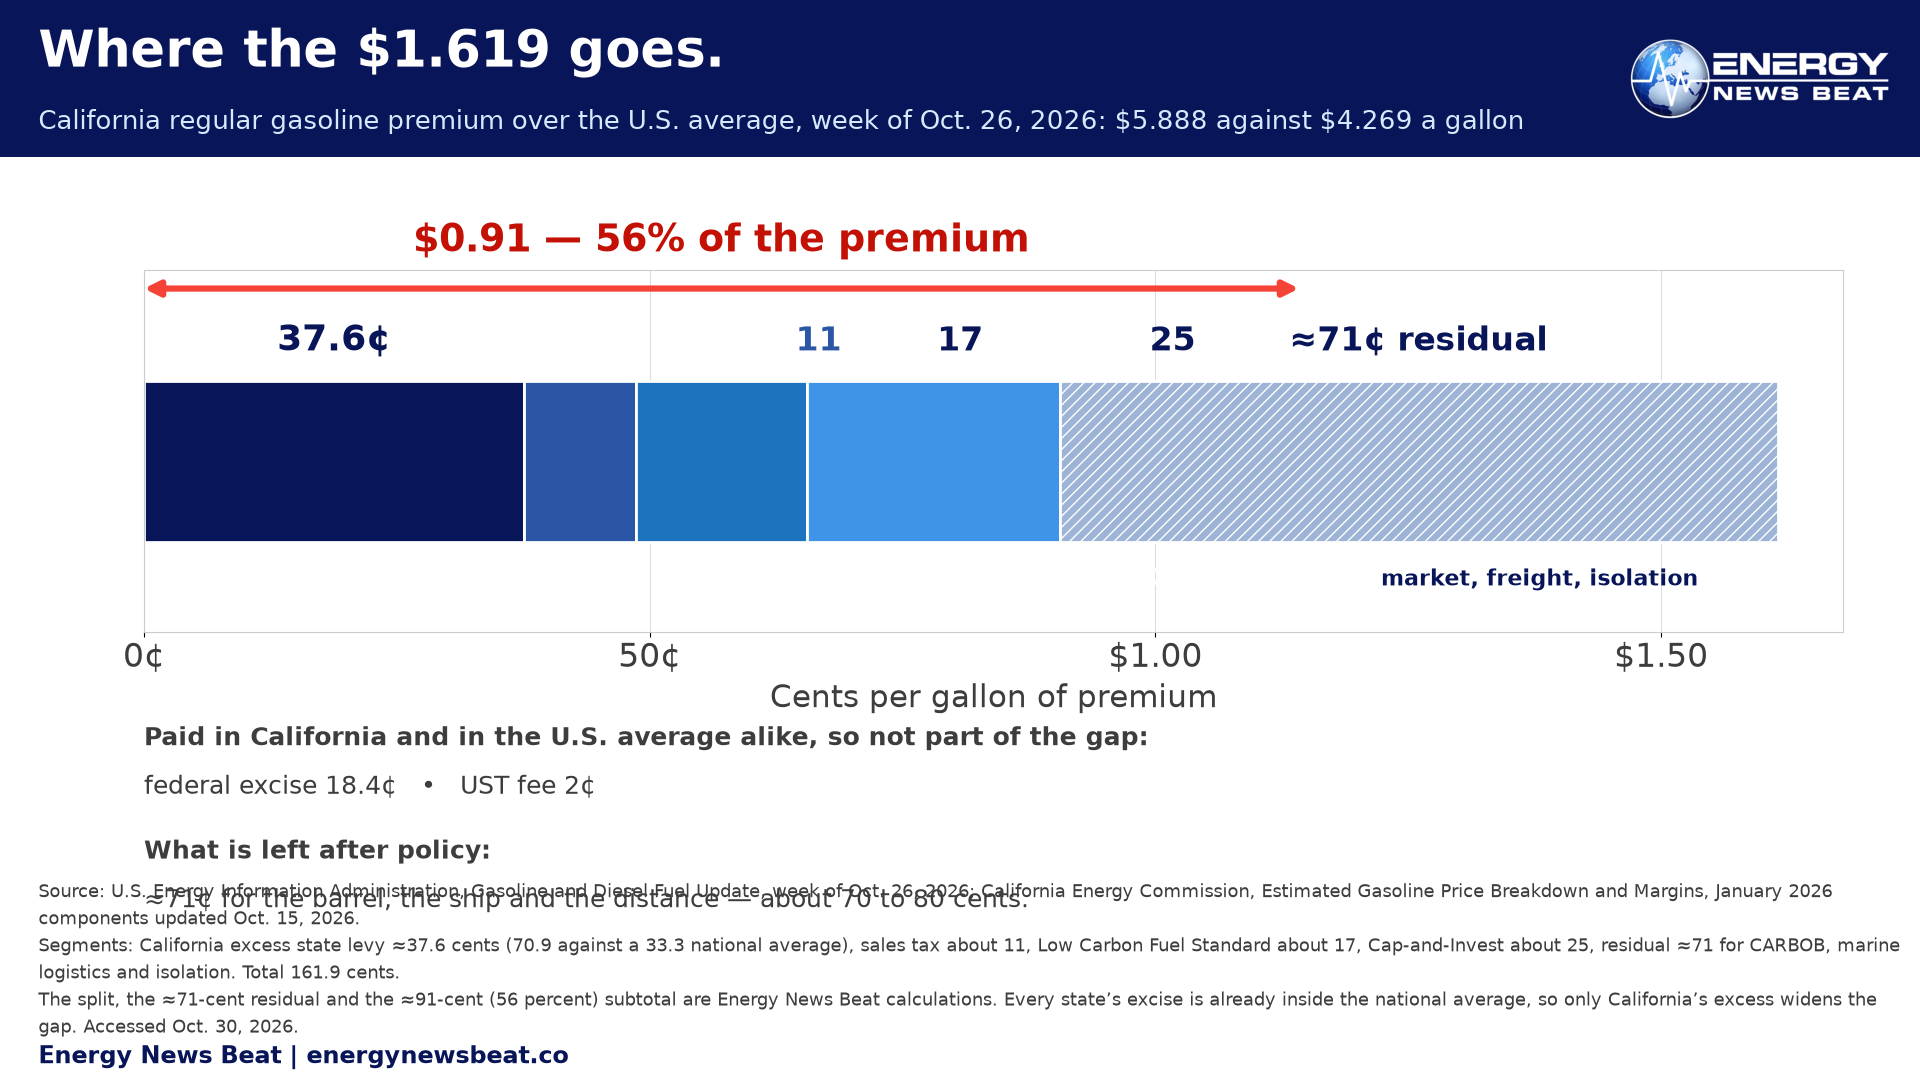
Start with the tax bill, the strongest part of the other side. In the week of Oct. 26, California regular averaged $5.888 against $4.269 nationally, a premium of $1.619, diesel at $8.155 against $6.352. The comparison has to be built carefully, because the national average already contains every other state’s gasoline tax. EIA puts California’s state taxes and fees at 70.9 cents a gallon against a 33.3-cent average across states, so the excess levy is about 37.6 cents. Add the Low Carbon Fuel Standard at about 17 and Cap-and-Invest at about 25, plus the sales tax those programmes and the rest of the pump price carry at the state’s 2.25 percent average — about 11 cents on a taxable base near $5.07, though it is a derivation rather than a published line item — and California policy explains roughly 91 cents of the $1.619, or 56 percent. The other 71 cents is CARBOB, marine freight and the cost of being isolated, which is more than this article claimed the last time we ran these numbers. We had it at 70 percent; that version double-counted, charging California’s full excise against an average that already held everyone else’s.
Chart 5. Decomposition of California’s $1.619-a-gallon regular gasoline premium over the U.S. average, week of Oct. 26, 2026. California’s excess state levy of about 37.6 cents, sales tax about 11, Low Carbon Fuel Standard about 17, Cap-and-Invest about 25, and a residual of about 71 cents for CARBOB, marine logistics and isolation. The roughly 91-cent subtotal, about 56 percent of the gap, is an Energy News Beat calculation. Federal excise and the UST fee are excluded, and so is every other state’s levy, because all of them are already inside the national average. Sources: EIA Gasoline and Diesel Fuel Update; EIA state taxes as of Jan. 1, 2026; California Energy Commission price breakdown, January 2026 components updated Oct. 15, 2026.
Europe reopened a question it had closed, in a room with NATO in it, and put security ahead of emissions in the reasoning without spending a euro or reopening a plant. California ran the only American version of that experiment and failed in a documented way: a buyer search that found nobody, a maintenance package never enacted, $5.25 million that went to imported fuel. The reversal is easy to announce and hard to execute, and the cheapest barrel is the one you never stopped making.
STU’S TAKE
Opinion. Every number is linked to its source.
Europe did not reverse its refinery phase-down. It reopened a question it had spent twenty years closing, and it did it in a room with NATO in it, which tells you what changed. Six governments, including Italy, signed a sentence that could have been written in Sacramento: crude cannot substitute for diesel or aviation fuel without suitable processing capacity. That is not a policy. It is an admission, and admissions are how reversals start.
We should be precise about what it is worth. Nothing was announced: no fund, no target, no exemption, no reopened plant, and no next meeting until early 2027. Europe has not restarted a single closed refinery. What it has done is stop pretending the closures were free.
California is the only American state that has run this experiment, and it ran it in 2025. It went looking for a buyer and found none. It discussed $200 million and appropriated nothing. Then it paid $5.25 million to keep imported fuel moving through the site, because a terminal was cheaper than a refinery. That is seven years in one line item: 21.5 percent of the state’s capacity gone, 64 percent of the national decline, a fifth of its gasoline arriving across three weeks of ocean.
We are not going to win this on the average price, and we should stop trying. About 56 percent of California’s premium is taxes and carbon programmes the voters chose — and that is counting only the state’s excess levy, not the whole 61.2 cents every other state also charges. Say so, then ask the question that survives the concession: what happens in the week a tanker does not arrive? A state with no inbound fuel pipeline and seven gasoline-making refineries has one answer, and it is three weeks long.
Washington is now attempting at federal scale what Sacramento would not do at state scale, and Valero’s answer was that the plant is safely idle and it has no plans to restart it. That is the lesson. The reversal is easy to announce and hard to execute, and the cheapest barrel is the one you never stopped making.
[STU: OK or edit]
Appendix
Sources, verbatim excerpts, data tables, methodology notes and corrections for “Six Governments Just Admitted You Can’t Substitute Crude for Diesel”. Every figure in the article resolves to one of these entries. Where a number is an Energy News Beat calculation it is labelled as one here and in the text.
Council of the European Union, doc. 14726/1/26 REV 1, Oct. 28, 2026, signed by Bulgaria, Czechia, Hungary, Italy, Poland and Slovakia: “Security of crude oil supply and security of refined product supply are distinct challenges. Crude oil cannot substitute for diesel or aviation fuel without suitable processing capacity.” [CONSREV] Link
The same document: “The pace of reductions in conventional capacity must reflect actual changes in demand, the availability of alternatives and the resilience of regional supply chains.” [CONSREV] Link
The same document, on closures: “Closures affect all types of refineries, creating, from the perspective of energy security, a strategic vulnerability in the system.” [CONSREV] Link
Doc. 14726/26, Oct. 26, 2026, the drafting the six later replaced: “Closures primarily affect smaller refineries.” [CONSINIT] Link
Energy Commissioner Dan Jørgensen, Oct. 28, 2026: “This is not just a matter of economic competitiveness. It is also a matter of security.” [COMMST] Link
Jørgensen, Oct. 28, 2026, the counter-argument in his own words: “The production of renewable liquid fuels has already compensated some of the reduction in Europe’s refinery capacity. The potential is significant.” [ANADOLU] Link
Jørgensen, Oct. 28, 2026, the disputed capacity figure: “Over the last two decades, around a quarter of EU refineries were shut down, decreasing domestic refining capacities by around 10 percent.” [COMMST] Link
Defence Commissioner Andrius Kubilius, Oct. 28, 2026, quoting Pershing: “defence without fuel is impossible.” [COMMDLG] Link
European Commission topic page on refining, current at Oct. 30, 2026: the sector must become more flexible and “adapt to shrinking capacity.” [COMMTOP] Link
Euronews, Oct. 28, 2026, on what the Commission is actually doing: its “immediate focus appears to be identifying measures that could increase production from facilities already operating in Europe.” [EURONEWS] Link
Council ask, doc. 14726/1/26 REV 1: member states request improved “access to investment financing.” No moratorium, capacity floor, fund or subsidy is requested. [CONSREV] Link
Presidential Determination No. 2027-01, FR Doc. 2026-22052, 91 FR 68011–68012, signed Oct. 22, 2026 and published Oct. 28, 2026, invoking section 303 of the Defense Production Act. [FEDREG] Link
Energy Secretary Chris Wright, Oct. 22, 2026: “After 17 years of Democrat leaders enacting energy subtraction policies that led to the closure of refineries and more expensive refined oil products, the Trump Administration is taking action to expand our nation’s refining capacity and strengthen our energy security.” [DOE] Link
Valero general counsel Rich Walsh, third-quarter 2026 call, Oct. 22, 2026, on the Benicia refinery: “safely idle and has been since April. And we have no plans to restart it.” [VALEROTR] Link
Walsh, on the state and federal entreaties: “none of those efforts actually materialized anything.” [VALEROTR] Link
Walsh, on what a restart would require: “reinventory it. You would have to restaff it. You would have to undertake a rather extensive turnaround.” [VALEROTR] Link
Valero chief executive Lane Riggs, Oct. 22, 2026: “It would be very difficult for them to help the prompt situation.” [VALEROTR] Link
Riggs, on the policy premise: “the idea that there is these refineries that you can just sort of walk in and put the lights on and they are going to start running is not exactly the case.” [VALEROTR] Link
GasBuddy petroleum analyst Patrick De Haan, interviewed by ABC7 (KGO), Sept. 11, 2025, on California’s posture: “an about-face and stepping in to keep refineries from shutting down.” ABC7’s own interview, not a Bloomberg quotation; Bloomberg does not quote him. [ABC7] Link
Mahoney and Cummings, Stanford SIEPR, June 20, 2025, on the price effect: “negligible” to “15 cents/gallon as a conservative upper bound,” conditional on streamlined permitting. [MAHONEY] Link
Mahoney, on the subsidy risk: “significant overpayments” and “a vicious cycle where additional financially viable refineries threaten shutdowns to extract their own subsidies.” [MAHONEY] Link
Institute for Energy Research, “The Pacific Premium,” July 2026: “producing crude oil or hosting refineries does not, by itself, make a state’s gasoline cheaper once taxes and the refining region are accounted for.” [IER] Link
California Energy Commission, on inbound fuel logistics: “There are no pipelines bringing fuel into the state.” [CECCOST] Link
California Energy Commission, on resupply: “Overseas supply can take three weeks,” and price spikes “may last longer for Californians because resupply time is longer.” [CECCOST] Link
S&P Global, as reprinted by Hellenic Shipping News, Oct. 21, 2026: “Everyone in Europe is so focused on diesel.” [SPH] Link
Phillips 66, Aug. 11, 2026, on the Western Gateway in-service date: “subject to receipt of all permits and regulatory approvals.” [P66WG] Link
North Macedonia, Oct. 21, 2026, on OKTA: a restart is “just one of the options.” [OKTA] Link
C. Data tables
C1. European refining capacity and refinery count by country, 2025
Country
Refineries
Capacity, Mt/yr
Country
Refineries
Capacity, Mt/yr
Austria
1
9.7
Lithuania
1
9.7
Belgium
2
32.0
Netherlands
5
59.7
Bulgaria
1
5.8
Poland
2
29.2
Croatia
1
4.6
Portugal
1
11.3
Czechia
2
7.9
Romania
3
11.9
Denmark
2
8.7
Slovakia
1
5.3
Finland
1
10.3
Spain
8
70.6
France
6
57.4
Sweden
3
19.8
Germany
11
98.7
EU-27 total
66
567.4
Greece
4
24.9
Norway
—
10.4
Hungary
1
7.7
Switzerland
—
3.2
Ireland
1
3.6
United Kingdom
—
44.4
Italy
9
78.6
EU-27 + UK + NO + CH
72
625.4
Source: FuelsEurope and Concawe, Statistical Report 2026, Figs. 34–36. Norway, Switzerland and the United Kingdom are shown for the total only; the report does not break their counts in the table used here. Italy’s 78.6 million tonnes across nine refineries is the second-largest sector in the EU-27, behind Germany at 98.7 and ahead of Spain at 70.6; the Netherlands is fourth at 59.7 and France fifth at 57.4.
C2. Operable refining capacity, California against the United States, two EIA vintages
Measure
Jan. 1, 2019
Jan. 1, 2026
Change
Percent
California, barrels a calendar day
1,909,671
1,499,171
−410,500
−21.5%
California, refinery count
15
12
−3
−20.0%
United States, barrels a calendar day
18,802,435
18,160,493
−641,942
−3.4%
United States, refinery count
135
130
−5
−3.7%
California share of national capacity
10.2%
8.3%
−1.9 pts
—
California share of the national net decline
—
—
64%
—
Source: EIA Refinery Capacity Report, Table 1, 2019 edition and 2026 edition, same definitions in both. EIA publishes the capacity totals; the changes, percentages and both share measures are Energy News Beat calculations. The 2026 table lists Marathon’s Los Angeles refinery, Carson and Wilmington together, at 365,000 barrels a calendar day, and it is operating; a hydrocracker went down for planned work in October 2026. The refinery that ceased crude processing on Oct. 16, 2025 is the separate Phillips 66 Wilmington plant, 139,000 barrels a calendar day, which is absent from the 2026 count. The figure that runs generous is Benicia, counted at 145,000 barrels a calendar day on Jan. 1, 2026 although Valero stopped refining at the end of April 2026.
C3. California gasoline premium decomposition, week of Oct. 26, 2026 (cents a gallon)
Component
Cents
In the gap?
Note
California regular, retail average
588.8
—
$5.888 a gallon
U.S. regular, retail average
426.9
—
$4.269 a gallon
Premium to be explained
161.9
—
$1.619 a gallon
California state taxes and fees
70.9
—
EIA, as of Jan. 1, 2026
Average state taxes and fees, all states
33.3
—
EIA, as of Jan. 1, 2026
California excess levy
≈37.6
yes
70.9 minus 33.3
Low Carbon Fuel Standard
≈17
yes
CEC January 2026 components
Cap-and-Invest
≈25
yes
CEC January 2026 components
Sales tax
≈11
yes
2.25% on the taxable retail base (588.8 less 18.4 federal excise, 61.2 state excise, 2.0 UST = 507.2) ≈ 11.4 cents; a derivation, not a published line item
Subtotal, state policy
≈91
—
≈56% of the premium, ENB calculation
Residual: CARBOB, freight, isolation
≈71
yes
ENB calculation
Sources: EIA Gasoline and Diesel Fuel Update, week of Oct. 26, 2026; EIA, state taxes and fees as of Jan. 1, 2026, which puts California at 70.9 cents a gallon against a 33.3-cent average across states and a revised national average of 33.3; California Energy Commission price breakdown, January 2026 components updated Oct. 15, 2026. Federal excise (18.4 cents) and the Underground Storage Tank fee (2.0) are excluded from this table, and so is every other state’s levy, because all of them are already inside the $4.269 national average that the premium is measured against. Counting California’s full state levy against that average would charge it twice for the tax every state pays. The excess-levy method here instead isolates the amount by which California’s own taxes exceed the national average, which is the only part of the levy that widens the gap. The subtotal, the residual and the roughly 56 percent share are Energy News Beat calculations on a single vintage of components; they are not a time series and should not be compared with earlier decompositions that used different component values.
C4. The price effect of the California closures: four Giannini scenarios at a $4.56 reference price
Scenario
Change per gallon
What has to be true
No import response
+$1.23
Closures are not offset by imports; in-state supply clears
Partial response
+$0.63
Imports arrive but logistics and freight absorb part of the shock
Full offset
$0.00
Import capacity fully replaces the 283,000 barrels a day lost
Over-supply
−$0.63
Import capacity exceeds the loss and competes down the price
Source: Giannini Foundation of Agricultural Economics, University of California, ARE Update 29(3). The closures modelled total 283,000 barrels a day. Compare Mahoney and Cummings, Stanford SIEPR, June 20, 2025, who put the effect at “negligible” to “15 cents/gallon as a conservative upper bound,” conditional on streamlined permitting. The two differ on an assumption about import logistics, not on the underlying capacity data; permitting is the variable that decides which is right.
C5. The Council signatory diff, Oct. 26 to Oct. 28, 2026
“Closures affect all types of refineries, creating, from the perspective of energy security, a strategic vulnerability in the system”
Sources: doc. 14726/26 and doc. 14726/1/26 REV 1. Italy is the addition that matters: 78.6 million tonnes a year across nine refineries, the second-largest refining sector in the EU-27 behind Germany. Neither document requests a moratorium, a capacity floor, a dedicated fund or a subsidy; the operative ask is “access to investment financing.”
D. Methodology notes
Scope discipline. Four different measurements appear in this article and none is blended with another. European capacity is in million tonnes a year, because that is the only unit any official European source publishes. U.S. national capacity is in barrels per calendar day, from one EIA table. California state capacity is in barrels per calendar day from the same table, which is a state total and not a plant figure. Single-refinery throughput — Benicia’s 145,000 barrels a calendar day, Golden Eagle’s 166,000 barrels a stream day (161,000 a calendar day), PBF Martinez’s roughly 157,000 a stream day (156,400 a calendar day) — is a fourth measurement entirely, and a plant’s nameplate is not its run rate. Every time the article changes scope it names the scope.
The 64 percent calculation. California’s decline of 410,500 barrels a calendar day divided by the national net decline of 641,942 equals 63.9 percent, rounded to 64. The denominator is the net change, not the sum of all state declines; states that added capacity offset states that lost it. The 8.3 percent share of national capacity is 1,499,171 divided by 18,160,493, using the Jan. 1, 2026 vintage for both. Both are Energy News Beat calculations from published EIA figures. EIA does not publish either ratio.
The Council conclusions. The Oct. 16, 2026 conclusions were read from the Council’s published PDF, EUCO 14/26, in full; paragraph 6 is quoted in the body from that document.
The 21.1 percent calculation. Concawe reports 625.4 million tonnes a year for 2025 and the report’s own series implies a 2009 base of 793.0 million. The difference is 167.6 million tonnes, which is 21.1 percent of the base. The 2009 figure is implied from the report’s capacity series rather than printed as a single headline number, and the article says so. The “around 10 percent” figure that circulates is the Commissioner’s spoken number of Oct. 28, 2026; no published Commission dataset, annex or Eurostat series carries it, and Eurostat does not publish refinery counts or distillation capacity at all.
The decomposition vintage. The California premium decomposition uses CEC’s January 2026 component values as updated Oct. 15, 2026, applied to the retail prices of the week of Oct. 26, 2026. Component values and retail averages are from different release dates within the same autumn; the residual absorbs any drift between them. This is a single-vintage snapshot, not a series, and the roughly 71-cent residual should be read as a band of about 70 to 80 cents rather than a measurement.
Restart economics. The dollars-per-barrel-a-day figures in Chart 4 and in the text are Energy News Beat calculations that divide a named dollar total by a named capacity. They are not estimates of what any specific restart would cost. Delaware City is the only case here with a documented purchase price, a documented overhaul range and a documented capacity; Limetree Bay is a capital figure reported through trade coverage of Reuters; and the $150 million DPA figure is an authorization ceiling, not a commitment to Benicia or to any other plant.
Evidence labels. In this appendix, [PRIMARY] marks a document read directly: a Council document, a Federal Register notice, an agency page, a company release, an earnings-call transcript. [PRESS] marks a figure that reached us through an outlet’s reporting, including the paywalled Reuters and Bloomberg material carried by other outlets and the Platts assessments reprinted by Hellenic Shipping News. Nothing marked [PRESS] in the research file has been promoted to [PRIMARY] in the article, and where a figure exists only through press attribution the text says so.
E. What we could not verify
Reproduced from the research file so the gaps are on the record rather than buried. Nothing in the article depends on any item below.
Any published European Commission dataset containing the “roughly 10 percent” capacity figure. The number itself is in the Commission’s own statement 26/2278, the transcript of Commissioner Jørgensen’s Oct. 28 remarks, and Euronews attributes it to the Commission. What does not exist is a published Commission dataset, annex or statistical series carrying it, and Eurostat publishes neither refinery counts nor distillation capacity. The article therefore treats it as the Commissioner’s spoken number and corrects it on the merits.
Any Eurostat series counting refinery closures or refining capacity. Eurostat does not appear to publish refinery counts or distillation capacity at all, so it is not cited for either.
A plant-by-plant European closure register with capacities for all roughly 30 closures since 2009. The country totals are solid; the named-plant list is partial and is described as partial in the text.
Any IEA or OPEC primary document quantifying European refinery closures. Both report capacity and runs rather than closure registers.
An EU-27-only capacity figure in barrels a day from any official source. Every official European figure is in tonnes. No barrel conversion of European capacity is used in this article.
Any adopted revision to the Oil Stocks Directive. No text exists as of Oct. 30, 2026.
A 2026-specific Industrial Emissions Directive compliance cost for a European refinery. All located figures date from 2014 to 2016 and none is presented as a current number.
Any EU funding instrument, state-aid mechanism or capacity target for refinery upgrades announced at the Oct. 28 dialogue. The absence is corroborated across the Commission’s own materials, the industry readout, Euronews, Agence Europe and 2eu.brussels, and is reported as a finding rather than a gap.
The S&P Global original of the Oct. 21 diesel-crack story. The publisher’s site returned HTTP 403; the verbatim Hellenic Shipping News reprint was used and is cited as a reprint.
A clean euro split of the €100 billion energy import bill between crude, refined products and gas. Eurostat aggregates crude and condensates, so no defensible split exists. The figure is given as a total, attributed to the Commissioner by name and date, with no method disclosed, and the Associated Press dollar figure is used where dollars are needed.
The body of the Associated Press article itself. The headline and the “more than $113 billion” figure came from search results rather than the article text.
The full text of the Reuters July 23, 2025 exclusive on California’s search for a Benicia buyer. The article is paywalled; the headline, date, the HF Sinclair detail and the “no sale resulted” outcome come from press reporting and are attributed as such.
The Bloomberg story of Sept. 9, 2025, read through the Transport Topics reprint of the Bloomberg text; bloomberg.com itself is paywalled. The figure is attributed in Bloomberg’s own words to people familiar with the talks, which is why it stays a press figure rather than a primary one.
A single credible per-gallon estimate of the cost of import dependence. It does not exist in defensible form. The only two credible figures are conditional: 13 to 15 cents a gallon in transport cost, and a range of zero to $1.23 depending on the import response.
Any U.S. state, blue or red, with a refinery keep-open subsidy, capacity target or protection mechanism. The absence appears genuine as of Oct. 30, 2026.
A verified closure date for the Portsmouth, New Hampshire refinery. The commonly repeated 1998 date does not hold up; no date is stated in this article.
A verified count of California refineries forty years ago. The figure in circulation is unverified and is not used.
Any documentation that California’s ACC II was modelled on the EU 2035 rule. None was found, and no such claim is made here.
A published academic or consultancy estimate of the local crack-spread loss a region suffers from a refinery closure. None was located; the article makes no such estimate.
Primary-source confirmation of the Limetree Bay $2.7 billion figure. Reuters is paywalled and the figure came through trade aggregation, which the chart and the text both disclose.
F. What the source coverage got wrong
Three corrections carried in the reporting, stated on the merits. Each is a correction of a published number or framing, not a criticism of any outlet, and none of them names one.
The 10 percent capacity figure. The widely carried line is that Europe shut around a quarter of its refineries and lost around 10 percent of its capacity. The first half is close to right — roughly 30 of about 100 plants larger than 30,000 barrels a day have closed or converted since 2009. The second half is not: the same fleet fell from an implied 793.0 million tonnes a year in 2009 to 625.4 million in 2025, which is 167.6 million tonnes, or 21.1 percent. A quarter of the plants cannot account for a tenth of the capacity when the plants that closed averaged close to the fleet average. The two numbers describe the same universe and cannot both be right. This article uses 21.1 percent and prints the 10 percent figure only beside it, with its origin.
The three-country framing. Coverage of the Oct. 26 Council document described three member states — Poland, Czechia and Slovakia — asking Brussels to think again about refining. By Oct. 28 the same document, revised, carried six, and the addition was not another landlocked state: it was Italy, with the second-largest refining sector in the EU-27 at 78.6 million tonnes a year across nine refineries, behind Germany. The revised text also dropped the convenient claim that closures “primarily affect smaller refineries” and replaced it with the admission that closures “affect all types of refineries.” A three-country protest and a six-country statement including a G7 economy are different political facts.
The Martinez attribution. A widely repeated formulation holds that “Marathon’s Martinez refinery closed in 2020.” It did close, and that is the point: the refinery EIA records as closing in Martinez in 2020 is Marathon’s own Golden Eagle plant, 161,000 barrels a calendar day by EIA’s count and 166,000 on a stream-day basis, which Marathon is converting to renewable diesel. The refinery that did not close is the one next door, which Shell built, Shell sold to PBF Energy for $960 million in February 2020, and PBF still runs at about 157,000 barrels a day. Marathon never owned it at any date. Two plants, two owners, two outcomes, one municipal name — and the shorthand that says “Marathon’s Martinez refinery did not close” gets the plant right and the fact backwards.