

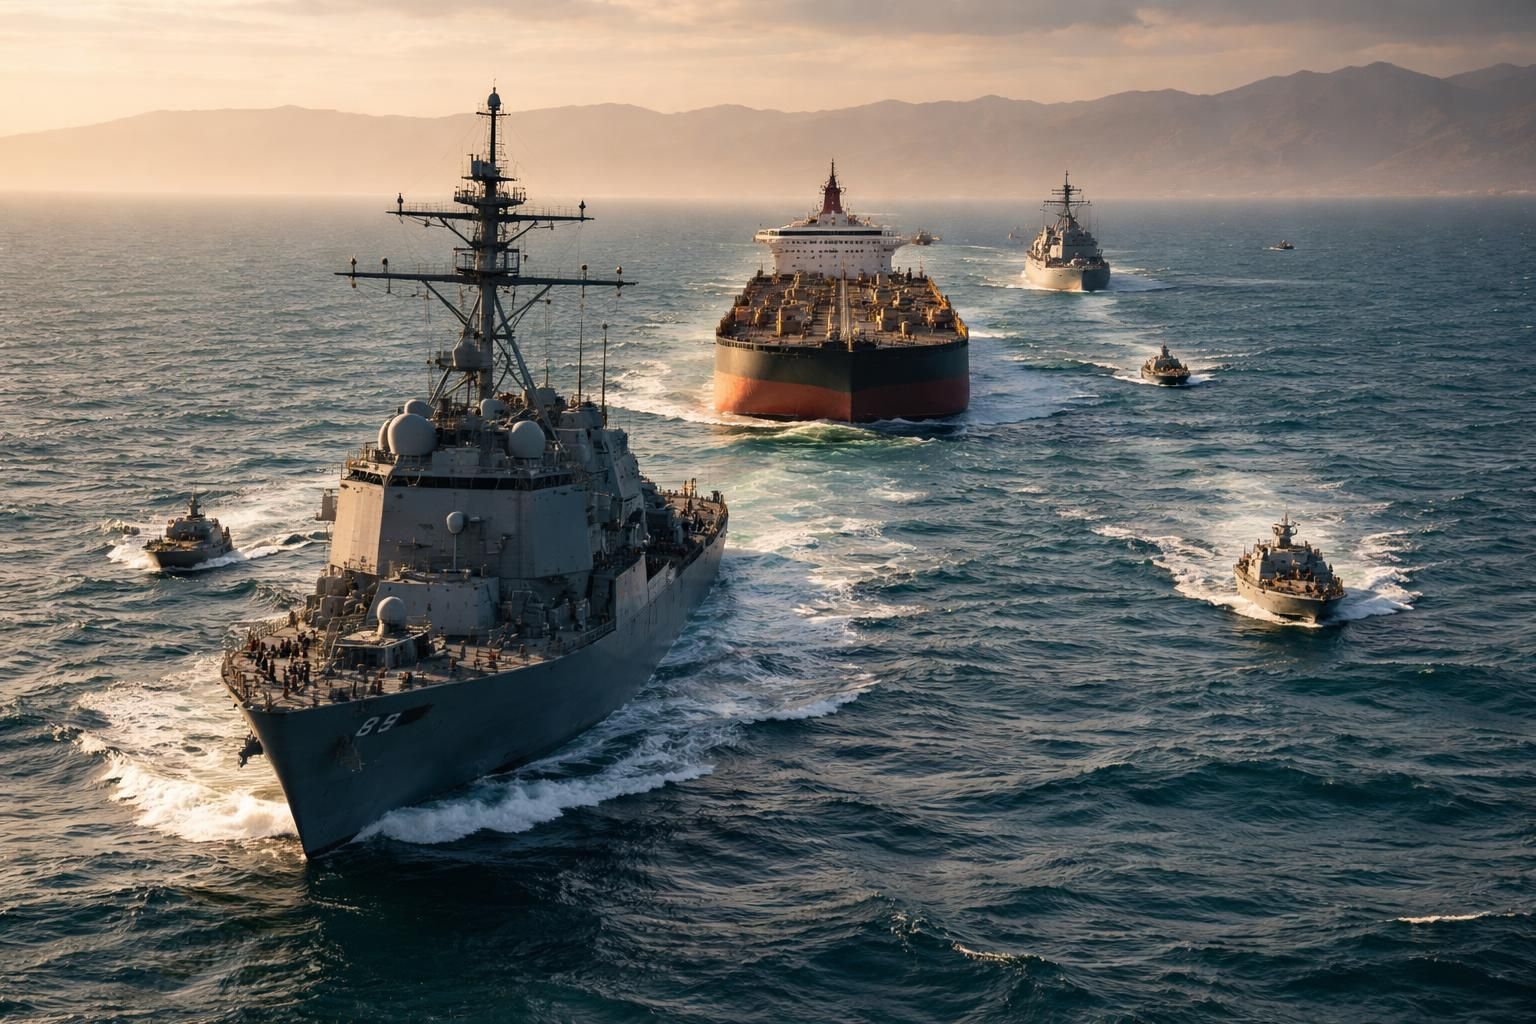
Oil and liquefied natural gas moving through the Strait of Hormuz over the past two weeks reached a six-month high, U.S. Central Command chief Adm. Brad Cooper said Saturday, crediting mine clearance, naval escorts, and coordination with Gulf producers, insurers, and shipowners. The same briefing drew a sharp contrast: Gulf partners have moved more than 1 billion barrels of crude through the waterway in recent months, Cooper said, while Iran has exported zero barrels under what he called an “ironclad blockade.”
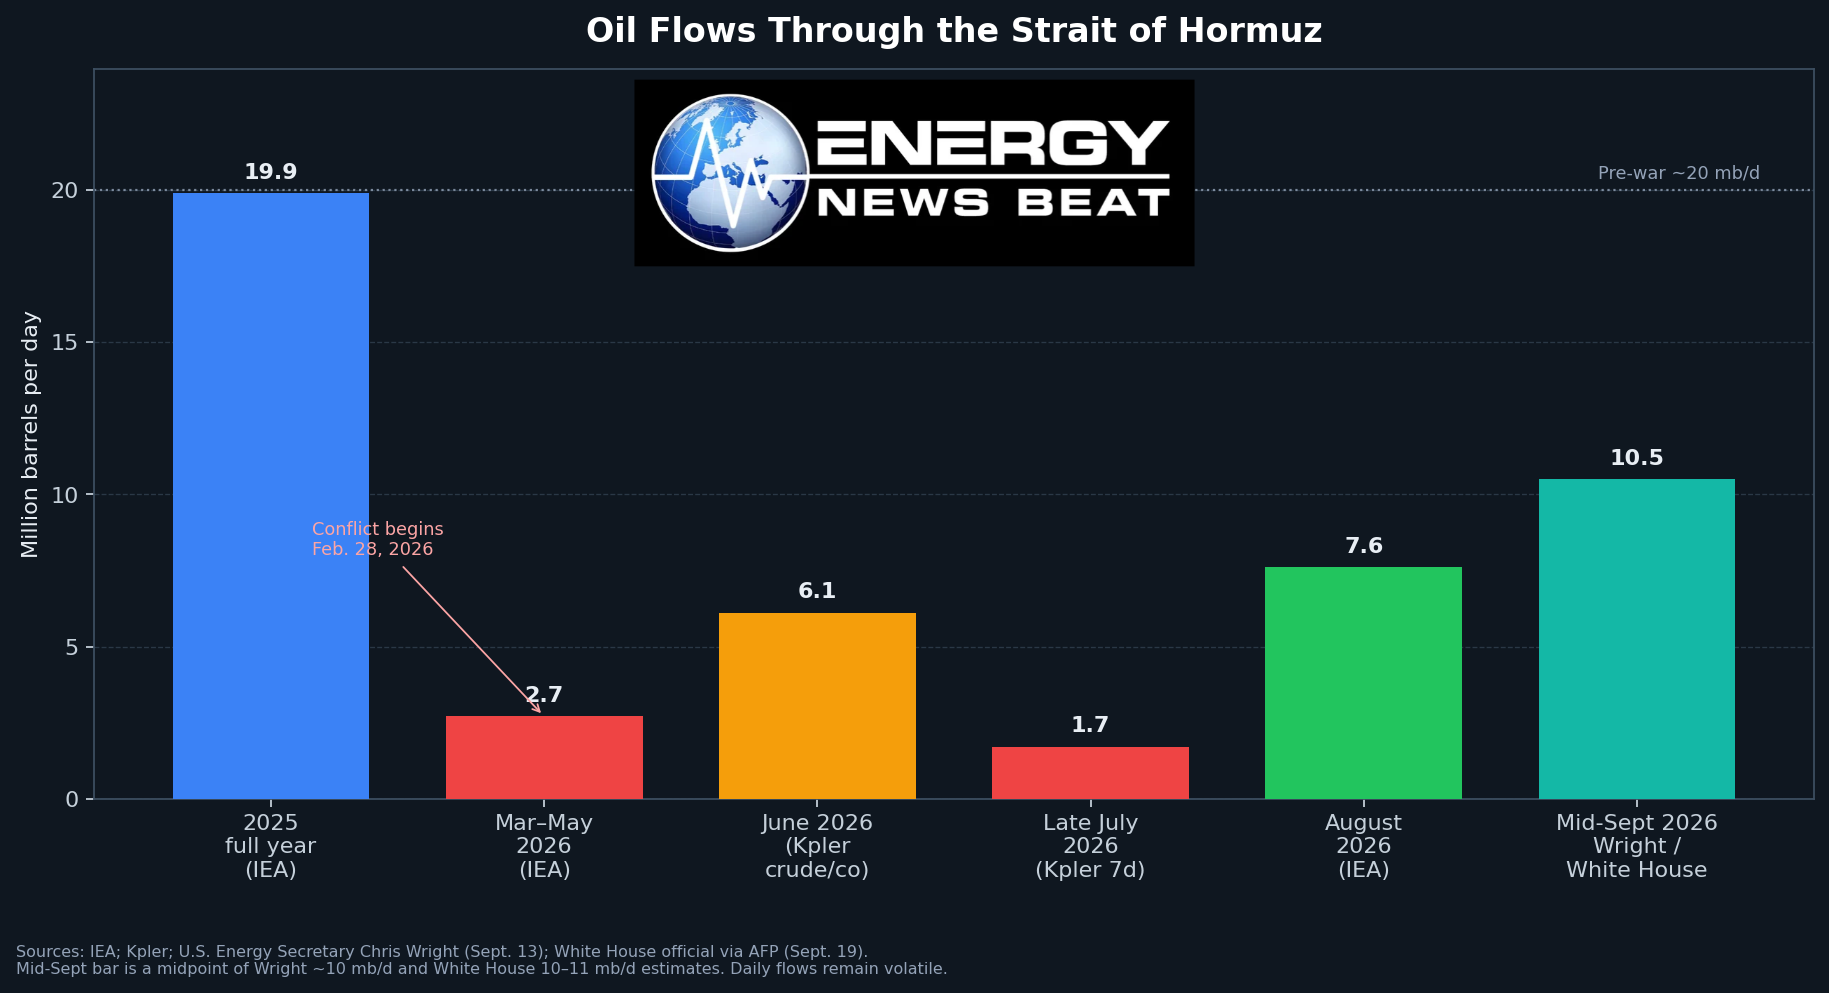
The claim lands on day 203 of the Hormuz disruption that began with the U.S.–Israeli war on Iran on February 28. Tracker data still show a waterway that is open only in pulses, not restored to the pre-war machine of roughly 20 million barrels a day of crude and products and about one-fifth of global LNG. The IEA put August Hormuz oil flows at 7.6 million b/d — 13.1 million b/d below pre-war levels, with cumulative losses through the strait approaching 2.8 billion barrels. White House officials told AFP on Saturday that oil was moving at 10–11 million b/d. Energy Secretary Chris Wright had put the working figure at about 10 million b/d of crude and products on September 13. Those estimates and Cooper’s two-week “six-month high” can sit together. A clean return to 2025 traffic cannot.
What the commander saidCooper recorded a CENTCOM video update posted on X on September 19. The key lines, compiled from the video transcript and contemporaneous reporting:
“CENTCOM forces have supported more than 1 billion barrels of crude oil leaving the Gulf. That’s 1 billion barrels of crude oil out through the Strait of Hormuz in the last couple of months.”
“We’ve reached this significant milestone while assisting over 2,000 commercial ship transits through the Strait by providing coordinated protection. Clearly, momentum is building. Primary transit lanes in the Strait are clear of mines.”
“Thousands of ships have passed through the Strait. Over 1 billion barrels of crude have been shipped from Gulf partners through the Strait of Hormuz, and Iran has exported zero barrels thanks to our ironclad blockade.”
“The effort is paying off. The volume of crude oil, cargo, and liquid natural gas these past two weeks is higher than at any point in the past six months.”
“We’re also working with every partner in the region, enhancing their air defense, forming a new coalition attack drone unit, and keeping the Strait of Hormuz and surrounding waters open and clear.”
The timing was not accidental. A day earlier, Iran’s Revolutionary Guard said it had struck the Togo-flagged tanker Trend for an “illegal attempt” to pass the strait and warned that unauthorized transit would bring “destruction.” A separate projectile incident set a tanker on fire northeast of Khasab, Oman, before the fire was extinguished. Kpler, cited Saturday, counted just three ships through the strait on Wednesday against a 10-day average near 17. The six-month high is a two-week volume claim, not a statement that every day now looks like 2025.
The last year in oil through Hormuz2025 baseline. The IEA’s Hormuz factsheet put 2025 flows at 14.95 million b/d of crude (including condensates) and 4.93 million b/d of products, or 19.87 million b/d total. Country shares were dominated by Saudi Arabia (6.23), Iraq (3.63), the UAE (3.24), Iran (2.41), Kuwait (2.37), and Qatar (1.43). About a quarter of seaborne oil trade moved through a channel 21 miles wide at its narrowest point. Typical daily vessel counts cited during the war have ranged from about 75 (IMF PortWatch commercial arrivals) to 125 ships of all types.
- February 28–May: the collapse. After the war started, Hormuz oil fell from ~20 million b/d to an average of 2.7 million b/d in March, April, and May. S&P Global said total ship movements dropped from more than 3,700 in February to around 400 in May, an 89% decline. IMF PortWatch daily transits averaged 4.8 in March, 8.5 in April, and 6.5 in May, against 89.4 in February and more than 100 in mid-2025. U.S. crude exports hit a record 5.6 million b/d in May as buyers reached into the Atlantic Basin.
- June 17 MoU: the backlog flush. The 60-day U.S.–Iran memorandum produced the first real reopening. Kpler put June crude/condensate transits at 6.1 million b/d, with a 11.9 million b/d peak on June 25. Windward saw 13.4 million barrels leave on June 24 and 11.7 million on June 25. S&P counted 78 vessels on June 24. Energy Secretary Wright told a Reuters forum that about 20 million barrels exited in one 24-hour stretch. Confirmed June oil through Hormuz was still well below the 2025 average. Kpler later said the MoU window moved roughly 374 million barrels of crude out of the Gulf and never restored the strait as a normal highway.
- July 14: blockade back on. After attacks on tankers — including Qatar’s Al Rekayyat LNG carrier on July 7 — Washington reinstated the Iran blockade. Kpler’s 7-day crude/condensate average fell to 1.7 million b/d by July 28. LNG transits went to zero after July 12. The MoU expired August 17 with no extension.
- August–September: escorts, dark ships, shuttles. The IEA’s September 18 commentary is the cleanest official monthly print: 7.6 million b/d through Hormuz in August. Traders told Bloomberg late August that total oil flows had lifted toward 8 million b/d from about 4 million in mid-July as producers expanded ship-to-ship shuttles in the Gulf of Oman. Wright said more than 17 million barrels transited on one early-September Monday. By September 13 he was describing a market that still needed about 10 million b/d through the strait: “tighter than we’d like today, but they’re not overly tight.” Cooper’s Saturday update is the U.S. military’s version of that same climb.
The 1 billion barrel figure needs a footnote. Sixty days at the IEA’s August rate is about 456 million barrels. Sixty days at 10–11 million b/d is 600–660 million. A billion barrels in “a couple of months” implies a higher average, a longer window that captures the June flush, product cargoes, or volumes the public trackers still miss when ships go dark. CENTCOM is counting barrels it says it helped move. Kpler, Vortexa, and the IEA are counting what they can see. Both series should be published side by side.Imagine
Bypass pipes filled part of the hole, then cracked. Saudi Yanbu and UAE Fujairah exports rose from 4.1 million b/d in February to 7.8 million in June, then slipped to 5.5 million in August after Houthi pressure in the Red Sea. Attacks shut the Saudi East-West line in early September. The IEA says those bypass routes offset more than 500 million barrels — about 2.8 million b/d — since February. They do not replace Hormuz.
LNG: the lagging cargo
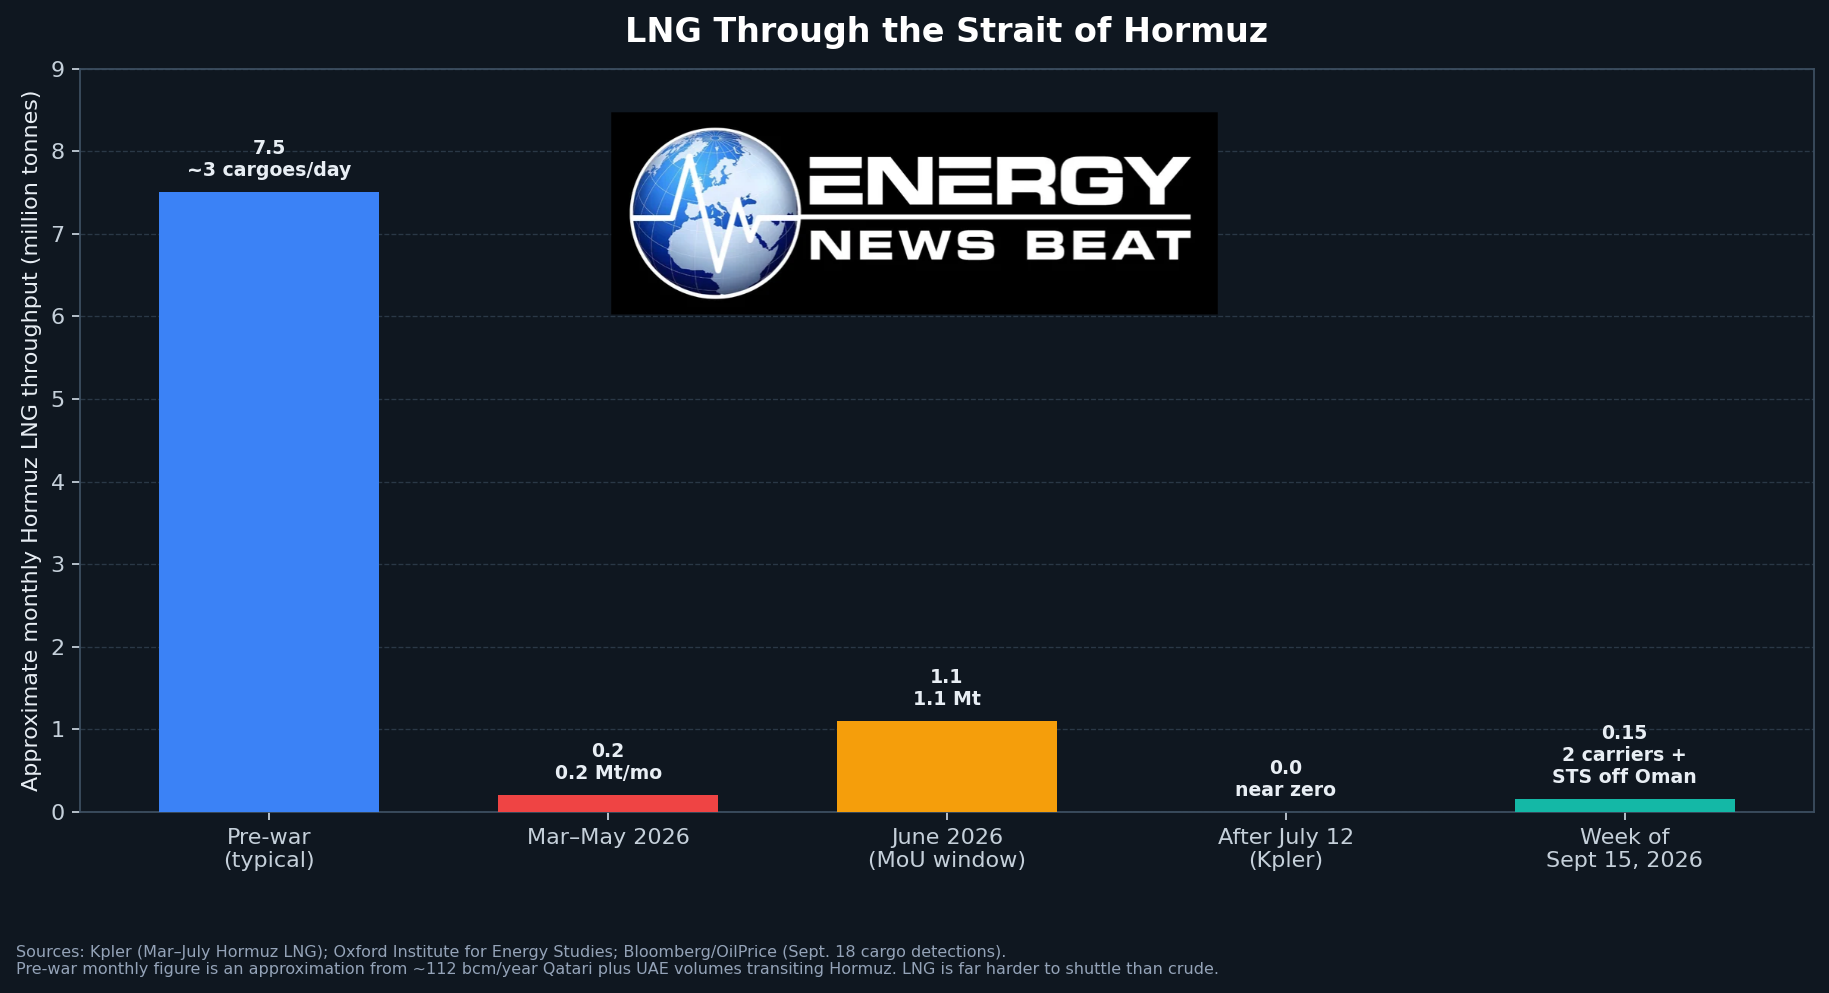
LNG is the harder story, and Cooper’s inclusion of “liquid natural gas” in the two-week high is newsworthy because the gas market has been starved far longer than crude.Before the war, about three LNG cargoes a day left through Hormuz. Qatar alone accounted for roughly a fifth of global LNG supply; CEPR puts 2025 Hormuz LNG at about 112 bcm from Qatar and 6.9 bcm from the UAE. There is no meaningful pipeline substitute. Two Qatari liquefaction trains were damaged in March and are out for years.
Kpler’s wartime tape: 0.2 million tonnes a month through Hormuz in March–May, 1.1 million tonnes in June, then zero after July 12. Oxford Institute for Energy Studies estimated May–July deliveries from Qatar and the UAE to import markets at only 1.8 bcm a month, a loss of about 7.1 bcm a month versus 2025. European TTF has been trading at crisis-era premiums; one mid-September print put Dutch gas up 175% year to date.
This week’s trickle is the first real sign of life since midsummer. Bloomberg tracking on September 18 showed at least two LNG carriers through Hormuz and two more doing ship-to-ship transfers off Oman. Satellite images picked up at least three LNG STS operations off Oman since mid-August. That is not three cargoes a day. It is proof producers are testing the same dark-and-shuttle model crude already uses — a model that is technically much harder when the cargo has to stay cryogenic.
Current activity: higher, not normal
As of Saturday, the operating picture is:
Official U.S. line: mines cleared in primary lanes; 2,000-plus commercial ships escorted; two-week oil, cargo, and LNG volumes at a six-month high; 10–11 million b/d of oil moving, per a senior White House official.
Independent tape: August average 7.6 million b/d (IEA); daily ship counts still swinging from the high teens down to single digits; dark transits and Oman-coast shuttles doing a large share of the work.
Risk: Iran still claims the strait is closed and is shooting at ships it calls unauthorized. Houthi drones have hit the Saudi bypass system. War-risk premiums remain multiples of peacetime levels.
Market: Brent was quoted near $99 on some Saturday monitors. Distillate, not crude, is the tighter product in several Atlantic markets — a separate Energy News Beat thread, but one Hormuz product shortfalls feed.
Iran: zero through Hormuz, and the truck story does not replace a VLCC
Cooper’s “zero barrels” line is a blockade-line claim, not a claim that Iran loaded nothing. That distinction matters.
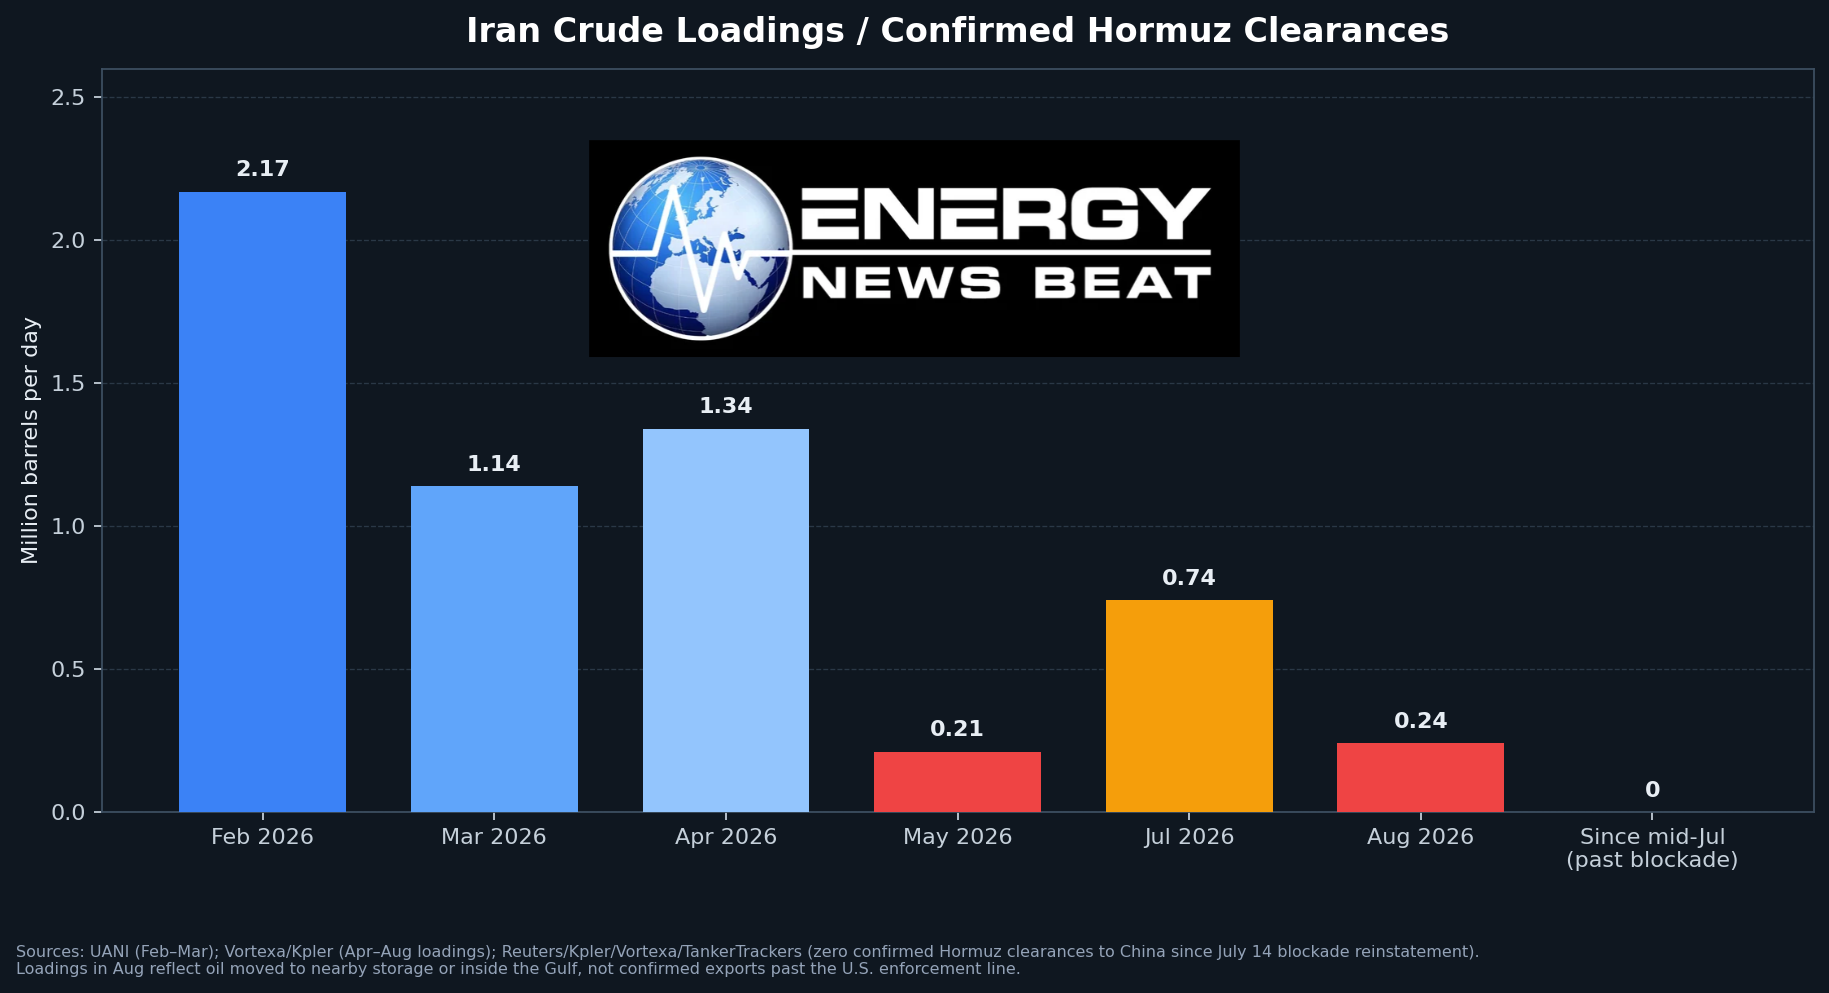
Seaborne crude past the U.S. line. Reuters, summarizing Kpler, Vortexa, and TankerTrackers, reported on September 1 that no Iranian crude cargoes had successfully transited Hormuz to China since the blockade was reinstated on July 14 — the first sustained near-zero stretch on record, including the 2019–20 sanctions peak. UANI said it had tracked no laden crude tanker that cleared the Gulf of Oman and avoided enforcement since July 12. Kharg Island loadings effectively halted at the end of July. August loadings were estimated at 220,000–260,000 b/d, down more than 80% from a year earlier and from ~1.7–1.9 million b/d earlier in 2026. Those August barrels were going into nearby storage and floating inventory inside the net, not through the gate. Iran’s central bank governor, Abdolnaser Hemmati, said on state television in August that “we are not exporting any oil.” CENTCOM said Saturday the scoreboard is still zero.
Pre-war Iran moved about 1.7–2.4 million b/d of crude and products through Hormuz. UANI had February 2026 at 2.17 million b/d. May collapsed to as little as 65,000 b/d on one tracker. The June window let tens of millions of barrels escape; July 14 slammed the door again.
Overland: what can be verified, and what cannot.
The premise that Iran is replacing Hormuz crude with “thousands of trucks” is only half right, and the half that is right is mostly not Iranian export crude.
Verified:
Iran’s land borders are jammed with trucks — mostly general cargo, LPG cylinders, cement, food, and parts, not a VLCC-scale crude pipeline on wheels. The Wall Street Journal (September 17) reported hundreds of Iranian drivers stuck at Pakistan, with the same mess at Turkey, Turkmenistan, and Afghanistan. Ehsan Malekzadeh, chairman of the Iranian International Transport Companies Association, said 3,700 trucks were stranded on the Iranian side of the Turkish crossing, with delays up to 20 days. At the main Pakistan crossing, about 700 trucks wait at a time — “mostly carrying bottled gas and cement” — while only about 40 are allowed through. Pishin traffic rose from ~40 to as many as 130 trucks a day. Tehran’s Chamber of Commerce asked Turkey to lift a cap from 200 to 500 Iranian trucks a day. That is border congestion, not a 1.5-million-b/d crude bridge.
Rail to China is real and still tiny. The Xi’an–Tehran corridor went from weekly trains to a train every three or four days. The Diplomat put a typical oil-by-rail shipment at 60,000–70,000 barrels. Even a generous case — oil also moving to Turkey, Pakistan, Afghanistan, and Uzbekistan — was framed as 250,000–300,000 b/d at the high end, and that was an if-everything-works number in May, not a confirmed August–September rate. One VLCC is 1.5–2.0 million barrels. A 50,000-ton general cargo ship is about 2,000 truck journeys at 25 tons each. Rail helps Tehran move some oil and LPG and keep a political link to China. It does not clear Kharg.
The “thousands of trucks” oil story that is documented is largely Iraqi fuel oil, not Iranian crude. Bloomberg reporting carried in the Boston Herald in July described thousands of trucks hauling Iraqi fuel oil across Syria to Mediterranean ports. Each truck carried about 20 tons, or 135 barrels, on a four- to six-day run. Traders put Syrian trucked fuel-oil flows above 600,000 tons in June; Iraq’s oil ministry claimed 1 million tons trucked to Syria and Jordan that month. Baniyas received “thousands” of those vehicles. That is a Hormuz-war workaround for Iraq. It is not Tehran emptying Kharg into 18-wheelers.
Gulf product trucking inside the UAE is also real, and also small. Hellenic Shipping News, citing traders at APPEC, said parcels of 5,000 tonnes or less of bunkers and gasoline are now split into dozens of trucks from Ruwais and Hamriyah to Fujairah so they never enter the strait. One example: 28 trucks for 18 days to move ~5,000 tonnes. “Thousands of trucks have been deployed” in that intra-Gulf niche. Again: products, short haul, not Iranian export crude.
Iran’s actual seaborne bypass is Jask, not a highway. The Goreh–Jask pipeline was built to put barrels on the Gulf of Oman outside Hormuz. It has moved some Iranian heavy oil to China. It is a pipe to a buoy, not a truck route, and it has not offset the blockade.
The arithmetic is why the truck story fails as a substitute:
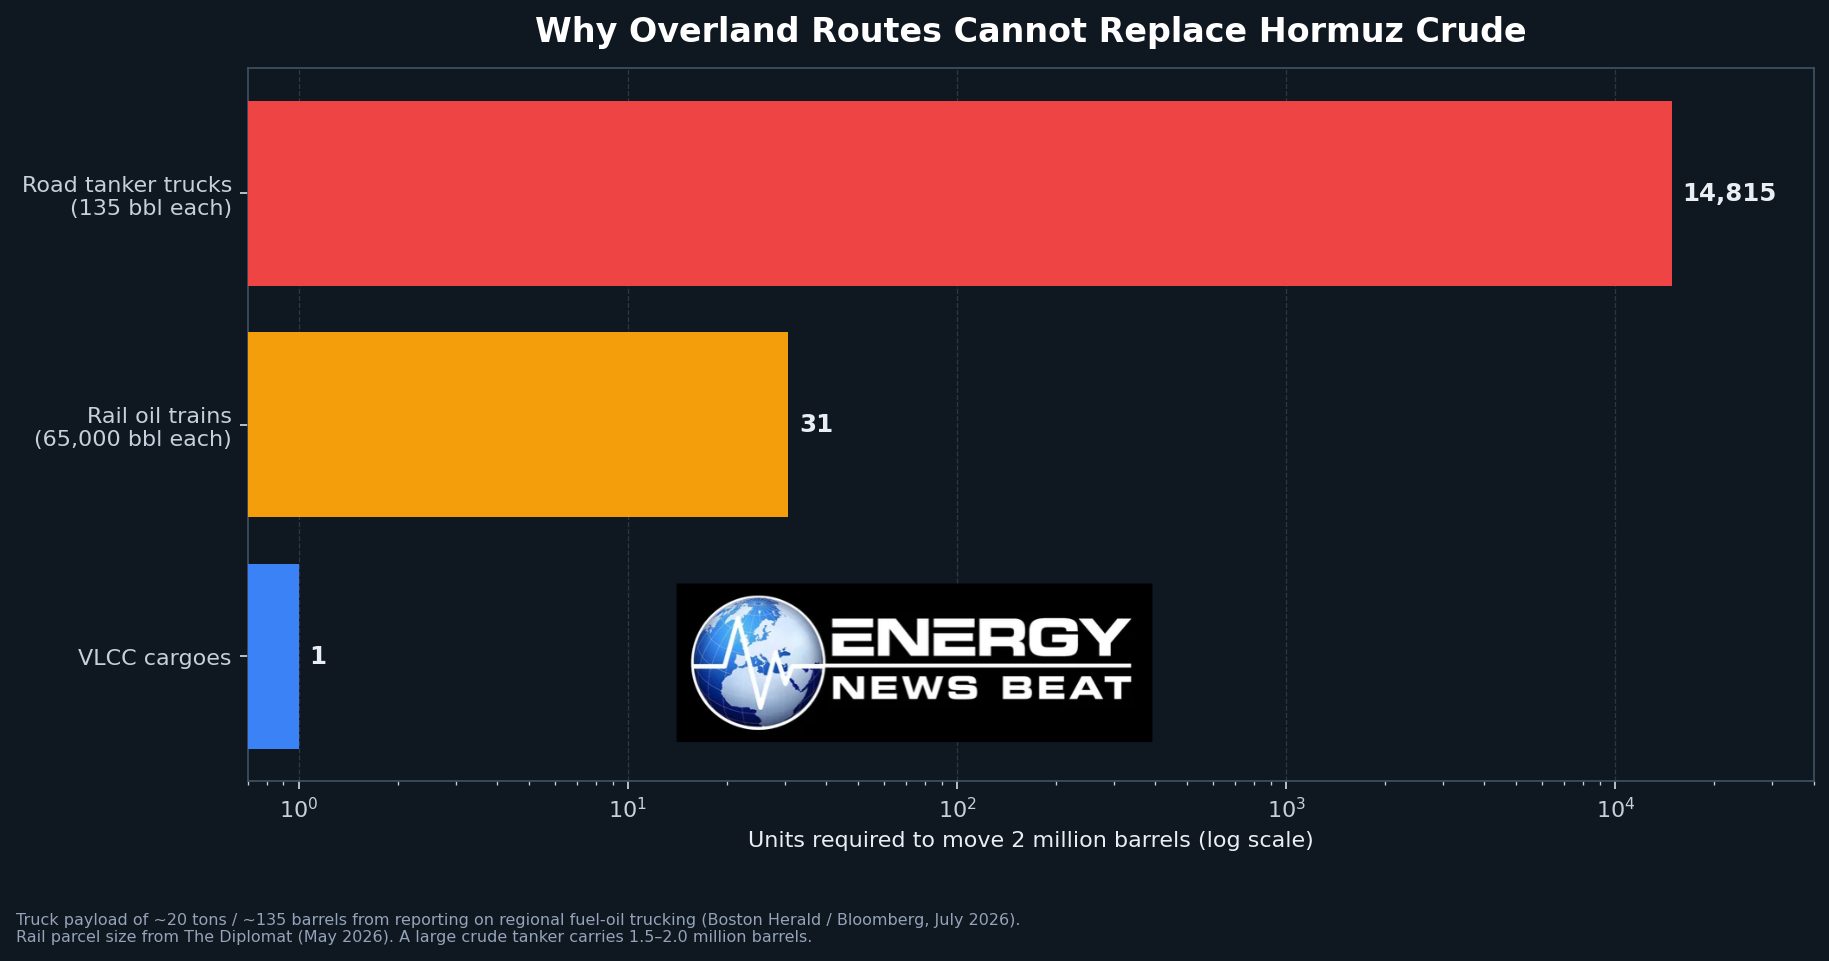
To move one 2-million-barrel VLCC cargo takes on the order of 30 rail oil trains at 65,000 barrels, or about 15,000 road tankers at 135 barrels. Pre-war Iranian seaborne exports of ~1.7 million b/d would require more than 12,000 loaded tanker trucks every day, ignoring drivers, border gates, return trips, and the fact that Turkey and Pakistan are already backing up on cement and cooking gas. No public source has verified that fleet, that daily count, or those crude volumes leaving Iran by road.What the overland shift is doing is expensive and incomplete: Caspian transit up about 70% by Iranian officials’ account, more China rail frequency, Pakistan road links from Gwadar and Karachi into Gabd and Taftan, and a growing queue of drivers who are not getting paid on time. DW quoted analysis that a long shift of Iran’s southern container trade onto land could add on the order of $18 billion in costs. Energy is harder. Umud Shokri told DW that neither alternative sea lanes nor the Pakistan–Iraq–Turkey–Caspian–Jask–Chabahar mix is a full substitute for southern energy exports.
Bottom line
Appendix: Sources and links
Commander statement and same-day coverage
- Bloomberg, “Hormuz Oil Shipments Hit Six-Month High, US Commander Says,” September 19, 2026: https://www.bloomberg.com/news/articles/2026-09-19/hormuz-oil-shipments-hit-six-month-high-us-commander-says
- Washington Examiner, “Oil and gas shipments through Strait of Hormuz hit six-month high: CENTCOM,” September 19, 2026: https://www.washingtonexaminer.com/news/world/4734876/oil-gas-shipments-strait-hormuz-hit-six-month-high-centcom/
- Times Now, “Strait of Hormuz Traffic 6-Month High, 2,000+ Ships Escorted…,” September 19, 2026: https://www.timesnownews.com/world/middle-east/strait-of-hormuz-traffic-6-month-high-2000-ships-escorted-says-us-a-day-after-iran-hits-tanker-article-156188614
- Boston Herald reprint of the Bloomberg report, September 19, 2026: https://www.bostonherald.com/2026/09/19/hormuz-oil-shipments-hit-6-month-high/
- Moneycontrol reprint, September 19, 2026: https://www.moneycontrol.com/world/hormuz-oil-shipments-hit-six-month-high-us-commander-says-article-14033627.html
- JNS, “CENTCOM: US forces facilitate shipping of 1 billion oil barrels…,” September 19, 2026: https://www.jns.org/news/u-s-news/centcom-us-forces-facilitate-shipping-of-1-billion-oil-barrels-out-of-strait-of-hormuz
- The Peninsula Qatar / QNA, September 19, 2026: https://thepeninsulaqatar.com/article/19/09/2026/centcom-us-forces-facilitated-passage-of-1-billion-barrels-of-crude-oil-through-strait-of-hormuz
- Shafaq News, “CENTCOM: 1B+ oil barrels clear Hormuz,” September 19, 2026: https://shafaq.com/en/World/CENTCOM-1B-oil-barrels-clear-Hormuz
- Al Arabiya English, September 19, 2026: https://english.alarabiya.net/News/middle-east/2026/09/19/us-working-to-keep-strait-of-hormuz-open-and-secure-centcom-chief-
- New York Post video with Cooper transcript, September 19, 2026: https://www.youtube.com/watch?v=31H1-TtOcYw
- CENTCOM post referenced across outlets:
https://x.com/CENTCOM
(video update, September 19, 2026)
Oil flow data, last year through September
- IEA, “Oil markets strain to plug the gap left by Middle East supply shortfall,” September 18, 2026: https://www.iea.org/commentaries/oil-markets-strain-to-plug-the-gap-left-by-middle-east-supply-shortfall
- IEA, “How global oil supplies have readjusted…,” June 22, 2026: https://www.iea.org/commentaries/how-global-oil-supplies-have-readjusted-to-help-fill-the-huge-gap-left-by-the-strait-of-hormuz-shock
- IEA, Strait of Hormuz 2026 factsheet (2025 baseline 19.87 mb/d): https://iea.blob.core.windows.net/assets/c8248eba-8689-46d9-ae4b-b858b59c0f1c/StraitofHormuz2026-Factsheet.pdf
- Reuters, “Crude shipments through Hormuz at highest since Iran war began,” June 25, 2026: https://www.reuters.com/business/energy/crude-shipments-through-hormuz-highest-since-war-amid-concerns-over-iran-exit-2026-06-25/
- CNBC, “Tankers with 35 million barrels exited Gulf through Hormuz since Iran deal,” June 24, 2026: https://www.cnbc.com/2026/06/24/oil-tanker-strait-hormuz-iran-deal.html
- CNBC, “More than 17 million barrels of oil transited Hormuz: Energy Secretary,” September 2, 2026: https://www.cnbc.com/2026/09/02/energy-secretary-chris-wright-tells-cnbc-that-more-than-17-million-barrels-of-oil-transited-hormuz-on-monday.html
- Bloomberg, “Hormuz Oil Shipments Surge Past 10 Million Barrels…,” July 1, 2026: https://www.bloomberg.com/news/articles/2026-07-01/us-sees-10-million-barrels-via-hormuz-sapping-iran-oil-leverage
- S&P Global, “Hormuz disruption drives Americas crude exports to all-time high in May,” June 8, 2026: https://www.spglobal.com/energy/en/news-research/latest-news/crude-oil/060826-hormuz-disruption-drives-americas-crude-exports-to-all-time-high-in-may
- Axios, “Oil transit is rebounding — but fresh hurdles arrive,” June 29, 2026: https://www.axios.com/2026/06/29/oil-transit-rebound-iran-war-hormuz
- New York Times, “Despite US Help, Little Oil Has Gone Through Strait of Hormuz,” June 13, 2026: https://www.nytimes.com/2026/06/13/business/oil-strait-of-hormuz.html
- Kpler, “Strait of Hormuz Re-Closes…,” July 29, 2026: https://www.kpler.com/blog/extended-conflict-becomes-the-baseline-assumption
- Kpler, “60 days of a broken US-Iran MoU,” August 19, 2026: https://www.kpler.com/blog/60-days-of-a-broken-us-iran-mou-the-market-stopped-waiting-for-hormuz
- Vortexa, “Hormuz after the MoU”: https://www.vortexa.com/insights/hormuz-after-the-mou
- AGBI, “Iran route is dominant Hormuz channel but shuttling grows,” August 28, 2026: https://www.agbi.com/analysis/shipping/2026/08/iran-route-is-dominant-hormuz-channel-but-shuttling-grows/
- IMF PortWatch-based monitor: https://straitofhormuz.report/is-oil-flowing-through-the-strait-of-hormuz
- World Monitor, July 2026 transit report: https://www.worldmonitor.app/research/strait-of-hormuz-transit-report-2026-07/
- WTO / AXSMarine Hormuz Trade Tracker: https://datalab.wto.org/Strait-of-Hormuz-Trade-Tracker
- ExecutiveBiz / Kpler’s Brian Kesecker on June traffic: https://www.executivebiz.com/articles/kpler-brian-kesecker-us-iran-mou-shipping-trends
LNG
- OilPrice, “LNG Tankers Push Through Hormuz Again…,” September 18, 2026: https://oilprice.com/Latest-Energy-News/World-News/LNG-Tankers-Push-Through-Hormuz-Again-as-Qatar-UAE-Fight-Supply-Crunch.html
- Energy Connects / Bloomberg, “More LNG Getting Through Hormuz…,” September 18, 2026: https://www.energyconnects.com/news/gas-lng/2026/september/more-lng-getting-through-hormuz-as-producers-push-for-transits/
- Bloomberg, “Qatar LNG Loading Jumps Ahead of Potential Hormuz Reopening,” August 11, 2026: https://www.bloomberg.com/news/articles/2026-08-11/qatar-lng-loading-jumps-ahead-of-potential-hormuz-reopening
- Oxford Institute for Energy Studies, Hormuz comment (August 2026 PDF): https://www.oxfordenergy.org/wpcms/wp-content/uploads/2026/08/Comment-Hormuz-HC-Phase.pdf
- CEPR/VoxEU, “Energy markets under chokepoint stress: The 2026 Hormuz shock”: https://cepr.org/voxeu/columns/energy-markets-under-chokepoint-stress-the-2026-hormuz-shock
- McKinsey, “Energy security beyond the Strait of Hormuz crisis,” September 17, 2026: https://www.mckinsey.com/mgi/our-research/aftershocks-energy-security-beyond-the-strait-of-hormuz-crisis
Iran seaborne exports and blockade
- Reuters / U.S. News, “Blockade Succeeds Where Sanctions Failed as Iran Oil Exports Stall,” September 1, 2026: https://www.usnews.com/news/world/articles/2026-09-01/blockade-succeeds-where-sanctions-failed-as-iran-oil-exports-stall
- CNBC, “U.S. Navy blockade slashes Iran oil exports…,” August 28, 2026: https://www.cnbc.com/2026/08/28/navy-blockade-iran-oil-exports-sanctions-trump.html
- UANI, May 2026 Iran Tanker Tracker: https://www.unitedagainstnucleariran.com/analysis/may-2026-iran-tanker-tracker
- ABC.AZ, “Iran Central Bank Chief: Oil Exports Drop to Zero…,” August 20, 2026: https://abc.az/en/news/212254/iran-central-bank-chief-oil-exports-drop-to-zero-due-to-us-blockade
- Benzinga, “Iran’s Oil Stopped Moving. Gulf Barrels Are Flowing Again,” August 26, 2026: https://www.benzinga.com/markets/commodities/26/08/61442750/iran-oil-exports-stopped-gulf-barrels-hormuz
- 20Cube summary of UANI August blockade tracking: https://20cube.com/resources/us-blockade-pushes-iranian-oil-exports-near-zero
Overland trucks, rail, and the “thousands of trucks” check
- Wall Street Journal via archive, “Iran’s Attempts to Get Around the Hormuz Blockade Are Hitting a Wall,” September 17, 2026: https://archive.li/2026.09.17-062356/https://www.wsj.com/world/middle-east/irans-attempts-to-get-around-the-hormuz-blockade-are-hitting-a-wall-c1f42cbe
- IBTimes, “Iran Tried To Bypass The U.S.’s Hormuz Blockade With Overland Trade…,” September 17, 2026: https://www.ibtimes.com/iran-tried-bypass-uss-hormuz-blockade-overland-trade-border-chaos-tangling-plan-3807566
- Boston Herald / Bloomberg, “Thousands of trucks haul Iraq’s oil through Syria…,” July 18, 2026: https://www.bostonherald.com/2026/07/18/thousands-of-trucks-haul-iraqs-oil-through-syria-in-sign-of-hormuz-legacy/
- The Diplomat, “Transporting Oil to China by Rail Will Not Solve Iran’s Export Headache,” May 28, 2026: https://thediplomat.com/2026/05/transporting-oil-to-china-by-rail-will-not-solve-irans-export-headache/
- Moneycontrol, “Iran bypasses US blockade with rail oil exports to China, Pakistan…,” May 30, 2026: https://www.moneycontrol.com/world/iran-bypasses-us-blockade-with-rail-oil-exports-to-china-pakistan-freight-traffic-surges-article-13936437.html
- New York Post, “Iran is using Caspian Sea, highways and a railroad to China…,” May 13, 2026: https://nypost.com/2026/05/13/world-news/iran-is-using-caspian-sea-highways-and-a-railroad-to-china-to-bypass-us-blockade-of-hormuz/
- DW, “Can Iran replace sea trade with land routes?,” August 27, 2026: https://www.dw.com/en/can-iran-replace-sea-trade-with-land-routes/a-79211179
- OilPrice, “How Iran Is Bypassing the Strait of Hormuz Blockade,” May 7, 2026: https://oilprice.com/Energy/Energy-General/How-Iran-Is-Bypassing-the-Strait-of-Hormuz-Blockade.html
- Hellenic Shipping News, “Hormuz risks drive increase in road haulage for smaller oil parcels”: https://www.hellenicshippingnews.com/hormuz-risks-drive-increase-in-road-haulage-for-smaller-oil-parcels/
- Reuters, “Iraq trucks southern crude north…,” September 16, 2026 (209 trucks, ~38,000 barrels in a two-day pilot — Iraq, not Iran): https://www.reuters.com/business/energy/iraq-trucks-southern-crude-north-bid-raise-exports-via-turkey-2026-09-16/
- Eurasianet, Pakistan–Iran road routes, June 5, 2026: https://eurasianet.org/new-pakistan-iran-road-routes-and-central-asian-trade
Charts compiled by Energy News Beat from the official and tracker sources listed above. Daily Hormuz volumes remain volatile; monthly averages and single-day spikes should not be treated as the same statistic.
