Massive shifts are occurring in the U.S. crude oil export market, but you wouldn’t know it from the steady-as-she-goes pace of activity. The volumes being loaded along the Gulf Coast have stayed within a relatively tight range — 2.5 MMb/d to 3.2 MMb/d — for 12 consecutive quarters now, and the export pace for each of the past three quarters has remained within a few thousand barrels of 3 MMb/d. So, what’s changed? For one thing, Corpus Christi is now by far the dominant point of export, with Houston, Louisiana, and Beaumont/Nederland trailing. Another is that Europe, heavily impacted by the sharp decline in imports from Russia, is now the leading destination for U.S. barrels. There are other changes, too, including increased use of Very Large Crude Carriers (VLCCs) and terminal expansion projects. In today’s RBN blog, we discuss highlights from our recently published Crude Voyager Quarterly Report.
When fully loaded with 2 MMbbl of crude oil, a VLCC in some ways resembles an alligator moving stealthily along a Florida lake, its body largely submerged with only a sliver of the beast visible above the waterline. The same could also be said of U.S. crude exports — a lot of what’s happening is occurring beneath the surface. As we said in our introduction, export volumes have remained remarkably stable over the last three-plus years. It’s difficult to tell just from looking at the totals that since mid-2019 the world has endured a once-a-century pandemic that crushed demand for oil and refined products and sent crude prices tumbling. There is also little to indicate that earlier this year Russia — one of the world’s three leading oil producers along with the U.S. and Saudi Arabia — invaded Ukraine, spurring not only Europe’s first major land war since World War II but an “energy war” the likes of which none of us has ever seen. And don’t forget the ongoing “energy transition,” a key element of which would presumably aim to ratchet down the role of oil and other hydrocarbons.
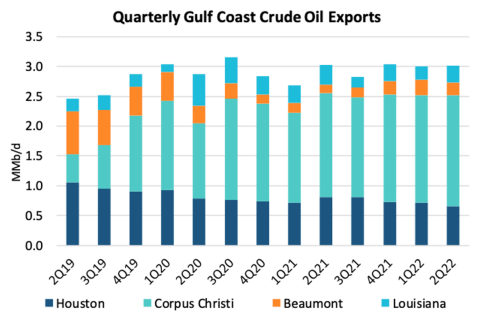
The fact is, U.S. crude export markets have been morphing, largely out of sight, in response to these and other factors. In today’s review of highlights from our new Crude Voyager Quarterly Report (and the latest issue of our weekly Crude Voyager), we’ll begin with a look at how much crude oil each of the four primary export points along the Gulf Coast is handling and how those volumes have shifted. Figure 1 shows the average volumes by area since the second quarter of 2019. As you can see, the total volume has increased gradually over time but also stayed within a definite range. What has changed is that Corpus Christi (aqua bar segments), a middle-of-the-pack player in exports only three years ago, rapidly became by far the #1 export point for U.S. crude oil, mostly at the expense of Houston (dark-blue bar segments).
This shift isn’t a fluke. It’s largely the result of new infrastructure: three new, large-capacity pipelines from the Permian to Corpus and a number of new or improved terminals, including at least a couple of facilities across the bay from Corpus Christi in Ingleside that allow for VLCCs — the oil-movers of choice for long-haul transport, given their size and efficiency — to be at least partially loaded at the dock before being filled to the brim via reverse lightering just offshore. The numbers for the Louisiana Offshore Oil Port (LOOP) — the largest export point in Louisiana (light-blue bar segments) — have also been holding up and even rising, in part because LOOP remains the only Gulf Coast facility capable of fully loading a VLCC. Further, as we described in Every Little Thing, there have also been a number of changes in the crude oil sectors — upstream, midstream and downstream — that have impacted flows to the Gulf Coast and which terminals could see increased usage.
According to the Crude Voyager Quarterly Report, the Enbridge Ingleside Energy Center (EIEC) kept its top spot among export points in the second quarter this year with a 23% share of overall loadings. The South Texas Gateway (STG) terminal in Corpus Christi loaded the second-highest volume of crude oil in the quarter, with a 14% share. It took over that position from Enterprise’s Houston terminal, which fell to third place. LOOP loaded the fourth-highest volume, accounting for a 7% share.
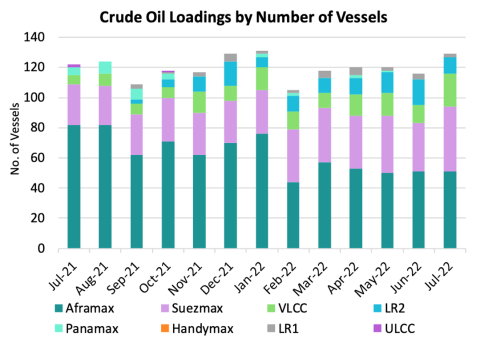
The light-green bar segments in Figure 2 (from our weekly Crude Voyager report) show the generally higher number of VLCCs being loaded so far in 2022 versus the second half of last year. This is all about transport efficiency and lower transport costs per barrel over long distances. Note that the number of Suezmax-class tankers being loaded (lavender bar segments) is also up — Suezmaxes are the runners-up to VLCCs in size, with a capacity of about 1 MMbbl.
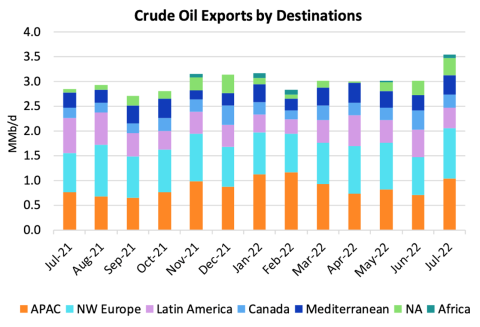
There’s also been a big change in where U.S. crude exports are going, especially in recent months, as shown in Figure 3 above. According to U.S. Census Bureau data, European destinations accounted for the largest share of U.S. crude exports in the first half of 2022 — 43%, or 253 MMbbl of the total 585 MMbbl — narrowly edging out Asia for the first extended period since the U.S. lifted its ban on most crude exports in December 2015. (First-half volumes to Asia totaled 248 MMbbl, or 42%.) In 2021 as a whole, the volumes sent to Asia accounted for 48% of the total, with Europe a distant second at 37%.
There are two primary — and related — reasons for the shift in destinations for U.S. crude oil. One is that Europe is trying to replace barrels it had been receiving prior to Russia’s invasion of Ukraine and the subsequent efforts by the European Union (EU) to quickly wean itself off Russian oil (and natural gas). The other reason is that many of the barrels that the U.S. had been sending to Asia — especially to China and India prior to the invasion — are now being replaced by discounted Russian crude. There are also other factors at play, including the impact of IMO 2020, international refining dynamics, and how crude oil releases from the Strategic Petroleum Reserve (SPR) tie in — much of which we analyzed previously in If I Could Change the World.