


The global oil market remains on edge as the Strait of Hormuz — the world’s most critical oil chokepoint — stays effectively paralyzed amid the ongoing U.S.-Iran conflict that began in late February 2026. JP Morgan has issued a fresh, more urgent update, warning that the situation could drive Brent crude sharply higher in the coming weeks unless substantial progress is made on reopening the strait.
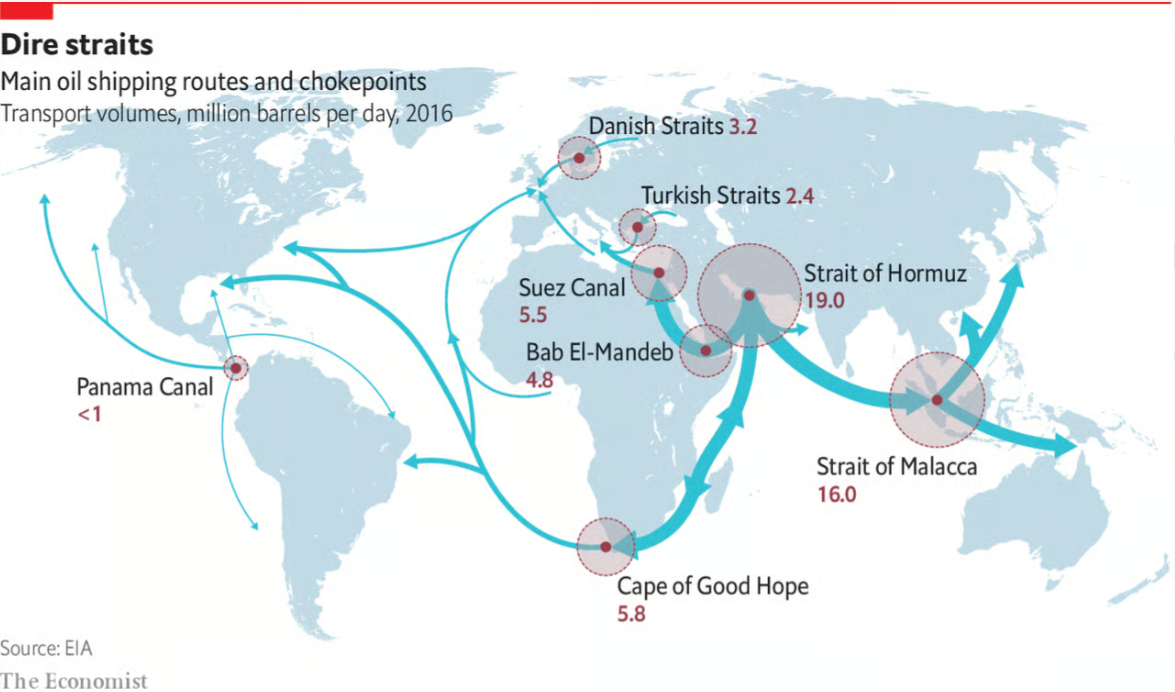
Strait of Hormuz oil shipping routes and chokepoints (map illustration).
JP Morgan’s Updated Assessment
According to a detailed June 11 report summarized by The Street, JP Morgan analysts highlight that visible tanker traffic through the strait is running at roughly 15% of pre-war levels — a near-blockade that has lasted for months. Despite this, oil prices have not yet reflected the full severity of the disruption.
The bank credits temporary buffers for keeping prices in check:
Clandestine or alternative flows are estimated at around 2 million barrels per day.
Drawdowns from global inventories.
Saudi Arabia’s East-West pipeline is operating at full capacity.
However, JP Morgan now sees these buffers as unsustainable. In an earlier April note, the bank flagged $15–$20 upside risk if flows only resumed by July. The latest view is more alarming:
Near-term spike: Brent crude could reach $120–$130 per barrel.
Worst-case scenario: Prices could overshoot toward $150 if the disruption persists for another full month.
Inventory stress: OECD commercial inventories could hit operational minimums as early as early June, with a hard floor by September if the strait remains closed.
The base case assumes negotiations eventually resolve the standoff after supply strains build. The risk scenario is prolonged closure leading to rationing, especially outside the U.S., and significant economic fallout.
This aligns with earlier JPMorgan commentary that inventories were heading toward critical lows by early-to-mid June without reopening.
The June 24 Contract Rollover: A Volatile Flashpoint
Traders and analysts are closely watching the July 2026 WTI Crude Oil futures contract (CLN26 on NYMEX). The last trading day and first notice day fall around June 22–24, 2026, marking the standard monthly rollover period when positions shift from the expiring front-month contract to the next (August).
Historical precedent shows these rollover periods often bring heightened volatility:Liquidity typically drains from the expiring contract, leading to wider bid-ask spreads and erratic price action.
In physically delivered contracts like WTI (settled at Cushing, Oklahoma), concerns over storage, delivery, or supply disruptions can amplify moves.
The most dramatic example was the May 2020 WTI contract, which plunged into negative territory ($-37) due to a storage glut at Cushing combined with pandemic-driven demand collapse.
Other rollovers have seen sharp swings when coinciding with geopolitical news, inventory reports, or shifts in contango/backwardation.
With the Hormuz situation at a critical juncture and potential diplomatic deadlines around end-June, the June 24 rollover could act as a catalyst for larger price swings — either on resolution hopes or further escalation fears.aswathdamodaran.substack.com
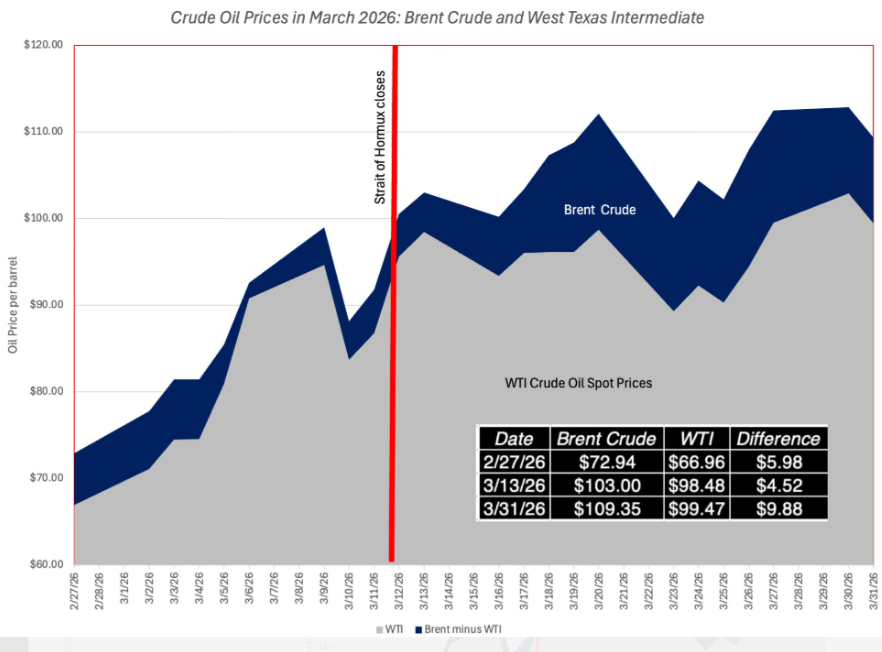
Example of crude oil price volatility in early 2026 amid Strait of Hormuz developments (illustrative chart).
Current Oil Prices and Recent Moves
As of mid-June 2026, prices have moderated significantly from earlier wartime peaks:
Brent crude has traded around $89–$96 recently (dropping sharply in May on ceasefire optimism before partial rebounds on renewed tensions).
WTI has hovered in the $88–$96 range.
Prices fell nearly 20% in May amid growing hopes for a U.S.-Iran ceasefire and the Strait reopening, only to face renewed volatility with late-May strikes and stalled talks.
Political and Market Views: Optimism vs. Caution — Who Is Right?
Optimistic voices (including some politicians and traders) point to ongoing U.S.-Iran negotiations and argue that a deal could reopen the strait, easing supply concerns and pressuring prices lower:
President Donald Trump has expressed optimism about talks progressing “nicely,” with any agreement expected to include reopening the Hormuz route.
Reports in late May of a tentative 60-day memorandum of understanding fueled sharp price drops as markets priced in relief.
Cautious analysts (led by JP Morgan and echoed by others) warn that markets are underpricing the risks:Even with a deal, reopening may be partial or delayed.
Gulf infrastructure damage from the conflict will take months (or longer) to repair.
Depleted inventories and summer driving demand leave little margin for error.
Brookings Institution projections align with JP Morgan: Brent could hit $120 if the Strait stays closed through the end of June.
Who is right? The market’s current pricing (prices well below $120–$150) reflects a bet on eventual diplomatic resolution and the effectiveness of current buffers. This has proven partially correct so far — prices have not exploded despite months of disruption. However, JP Morgan’s analysis appears more grounded in the hard math of supply shortfalls and finite buffers. History shows geopolitical chokepoint crises often resolve slowly and imperfectly, and the June rollover adds technical fuel to potential volatility. If inventories continue drawing down without visible improvement in tanker traffic by late June, the gap between current prices and fundamentals could close quickly — favoring the higher-price scenario.
Bottom Line for Energy Markets
The coming weeks are pivotal. Key watchpoints include:
Diplomatic progress on U.S.-Iran talks.
Actual tanker traffic data through the strait.
OECD inventory reports.
Price action around the June 24 contract rollover.
JP Morgan’s message is clear: The market has bought time, but not a solution. Without meaningful reopening soon, oil prices face significant upside risk — with ripple effects on gasoline, inflation, and central bank policy.
Energy News Beat will continue monitoring developments closely. Stay tuned for real-time updates on prices, contracts, and geopolitics.
Sources include JP Morgan analysis via The Street, CME Group contract data, Reuters, Fortune, and market reports as of June 11–12, 2026. Oil markets remain highly volatile — this is not investment advice. What do you think — will the strait reopen in time to cap prices, or are we heading for a summer spike? Drop your thoughts in the comments!
For the article: “JP Morgan Sends Updated Warning on Strait of Hormuz Risks and Oil Price Spikes”
(Energy News Beat Channel – June 12, 2026)This appendix provides full sourcing for all facts, data, quotes, and analysis presented in the article. Inline citations in the main article (e.g., [web:0]) correspond to the numbered references below.
Primary Sources
- JP Morgan’s updated analysis on the Strait of Hormuz
Hillary Remy, “JPMorgan Sends Another Message on Strait of Hormuz, Oil Prices,” The Street, June 11, 2026.
Link: https://www.thestreet.com/latest-news/jpmorgan-sends-another-message-on-strait-of-hormuz-oil-prices-economy
(Core source for JP Morgan’s $120–$130 near-term and up to $150 risk scenario, inventory stress timeline, clandestine flows, and base-case assumptions.) - Contract rollover and expiration details (July 2026 WTI Crude – CLN26)
CME Group, “Crude Oil Futures Calendar.”
Link: https://www.cmegroup.com/markets/energy/crude-oil/light-sweet-crude.calendar.html
(Confirms last trading day and first notice day around June 22–24, 2026 for the July 2026 contract.) - Additional JP Morgan commentary and earlier forecasts
- Rigzone, “JP Morgan Publishes First Oil Price Forecast in 2 Months,” May 13, 2026.
Link: https://www.rigzone.com/news/jp_morgan_publishes_first_oil_price_forecast_in_2_months-13-may-2026-183677-article/ - Fortune, “Oil markets may face moment of truth in June,” May 16, 2026.
Link: https://fortune.com/2026/05/16/oil-markets-crude-non-linear-price-spike-panic-buying-inventories-iran-hormuz/ - Various JPMorgan notes referenced in Yahoo Finance and Instagram reels (April–May 2026 updates on June 1 reopening expectations and inventory risks).
- Rigzone, “JP Morgan Publishes First Oil Price Forecast in 2 Months,” May 13, 2026.
- Current oil price levels and recent movements (as of June 11–12, 2026)
- Trading Economics, “Brent Crude Oil” price data.
Link: https://tradingeconomics.com/commodity/brent-crude-oil - Yahoo Finance / Barchart futures quotes (Brent and WTI).
- Reuters and Fortune reports on May–June 2026 price action (e.g., ~20% drop in May on ceasefire hopes, subsequent volatility).
- Trading Economics, “Brent Crude Oil” price data.
- Geopolitical and diplomatic context (U.S.-Iran talks, ceasefire hopes)
- Reuters, “Oil prices rise to one-week high as Iran reviews US proposal,” June 2, 2026.
- CNBC, “Oil prices fall 20% as traders eye U.S.-Iran ceasefire,” May 29, 2026.
- BBC and The Hill reporting on Trump administration statements and tentative 60-day MOU discussions (late May 2026).
- Historical futures contract rollover volatility
CME Group education materials on futures expiration and rollover.
Link: https://www.cmegroup.com/education/courses/introduction-to-futures/understanding-futures-expiration-contract-roll- Reference to the May 2020 WTI negative price event (widely documented across financial media).
- Broader analyst and institutional views
- Capital Economics and Brookings Institution projections referenced via Fortune and The Street.
- Morgan Stanley and other bank forecasts noted in Capital.com market updates (May 2026).
Visual Sources (Illustrative)
- Strait of Hormuz oil shipping routes map
The Economist (graphic based on EIA data).
Link: https://www.economist.com/graphic-detail/2019/06/21/us-iran-tensions-threaten-the-worlds-most-important-oil-shipping-route
(Used for illustrative purposes; volumes shown are historical/pre-2026.) - Oil price volatility chart (2026 context)
Derived from market data visualizations in financial publications (e.g., Aswath Damodaran Substack and similar analyst charts tracking Brent/WTI movements post-February 2026).
(Illustrative only — actual prices sourced from Trading Economics and futures platforms.)