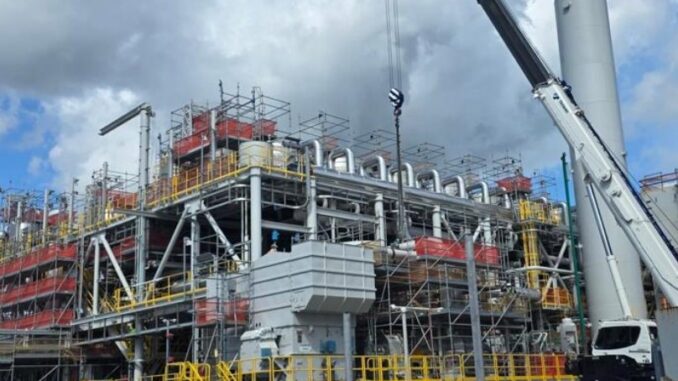
The United States has achieved a new milestone in its liquefied natural gas (LNG) sector, exporting a record-breaking 9.33 million metric tons (MT) in August 2025. This figure surpasses the previous monthly high of 9.25 MT set in April 2025 and represents a notable increase from July’s 9.1 MT. The surge is attributed to increased production from new facilities and strong demand from key international markets, particularly in Europe.
Year-to-Date Performance
Year-to-date (YTD) through August 2025, US LNG exports have reached approximately 69 MT, marking a 22% increase—or 12.4 MT—compared to the same period in 2024.
Are you Paying High Taxes in New Jersey, New York, or California?
Official data from the US Energy Information Administration (EIA) up to July 2025 shows exports totaling about 59.46 MT (2,896,113 million cubic feet, or MMcf), confirming the robust growth trajectory leading into the record August performance.
This YTD figure underscores the US’s position as the world’s leading LNG exporter, driven by expanded capacity and favorable global market conditions.
Monthly breakdowns from EIA data for 2025 (in MMcf) are as follows:January: 414,951
February: 409,232
March: 457,955
April: 448,124
May: 436,002
June: 405,976
July: 323,873
The lower July volume may reflect seasonal factors or maintenance, but the rebound in August highlights the sector’s resilience.
Breakdown by Exporting Companies and Terminals
US LNG exports are handled through several key terminals, each associated with major energy companies. Based on available EIA data up to June 2025 (with partial extractions due to large datasets), the following provides YTD totals for select terminals, converted to approximate MT using 1 MT ≈ 48,700 MMcf. Note that these are partial sums and do not include July or August; full YTD breakdowns would require updated reports.
Cameron, LA (Sempra Energy): YTD Jan-Jun ~ 165,212 MMcf (≈ 3.39 MT)
Corpus Christi, TX (Cheniere Energy): YTD Jan-Jun ~ 100,797 MMcf (≈ 2.07 MT)
Cameron (Calcasieu Pass), LA (Venture Global LNG): YTD Jan-Jun ~ 84,024 MMcf (≈ 1.73 MT)
Freeport, TX (Freeport LNG – owned by Michael Smith, JERA, Osaka Gas): Partial data available; Jan ~ 20,587 MMcf, Feb partial ~ 7,072 MMcf (full YTD estimate higher)
Cove Point, MD (Berkshire Hathaway Energy): YTD Jan-Jun ~ 18,701 MMcf (≈ 0.38 MT)
Elba Island, GA (Kinder Morgan): YTD Jan-Jun ~ 21,716 MMcf (≈ 0.45 MT)
In August specifically, Venture Global’s Plaquemines facility played a significant role, exporting 1.6 MT and accounting for 17% of the month’s total. The terminal, with a capacity of 27.2 MTPA, has ramped up since starting operations in December 2024 and is expected to reach full production from all 18 plants in September 2025, potentially boosting future exports.
Cheniere Energy, operating Sabine Pass and Corpus Christi terminals, remains the largest exporter overall, though specific YTD shares are not detailed in preliminary reports.
Breakdown by Destination Countries and RegionsDemand for US LNG continues to be dominated by Europe, which received 6.16 MT (66% of total) in August 2025, up from 5.25 MT (58%) in July. This reflects lower European gas storage levels compared to 2024 and ongoing efforts to diversify away from traditional suppliers. Asia followed with 1.47 MT, down from 1.8 MT in July, while Egypt took 0.57 MT (6%), Latin America 0.69 MT (7%), and 0.37 MT (4%) had no specified destinations.
For YTD through June 2025 (based on partial EIA data), top destination countries by volume (in MMcf) include:France: 316,140 (≈ 6.49 MT)
Italy: 178,954 (≈ 3.68 MT)
Germany: 147,789 (≈ 3.03 MT)
Egypt: 113,578 (≈ 2.33 MT)
India: 70,315 (≈ 1.44 MT)
Dominican Republic: 43,640 (≈ 0.90 MT)
Belgium: 71,734 (≈ 1.47 MT)
Greece: 44,322 (≈ 0.91 MT)
Bangladesh: 31,269 (≈ 0.64 MT)
Croatia: 24,437 (≈ 0.50 MT)
Finland: 19,723 (≈ 0.40 MT)
Argentina: 14,833 (≈ 0.30 MT)
Chile: 24,533 (≈ 0.50 MT)
Colombia: 24,772 (≈ 0.51 MT)
Brazil: 26,044 (≈ 0.53 MT)
Japan: Partial data (Jan-Mar: 10,113 MMcf; full higher)
Europe as a whole dominates YTD exports, with Egypt emerging as a key non-European buyer due to declining domestic production and high power demand. Asian markets like India, Bangladesh, and Japan also show consistent uptake, though volumes fluctuate with regional prices.
Outlook and Drivers
The record August exports were supported by competitive pricing, with European gas prices at the Dutch TTF hub averaging $11.13 per mmBtu (down from $11.56 in July) and Asian spot prices (Japan Korea Marker) at $11.63 (down from $12.18).
Looking ahead, new projects like Plaquemines and potential expansions could push US exports even higher, though challenges such as global price volatility and infrastructure constraints remain. The US LNG industry continues to play a pivotal role in global energy security, particularly for allies in Europe and emerging markets in Asia and Africa.
We will review the list of exporting companies and initiate a series of evaluations to assess investor returns and company performance. It is fun to see the difference between the Biden Administration and the Trump Administration’s push for energy dominance. Just saying.
Avoid Paying Taxes in 2025
Crude Oil, LNG, Jet Fuel price quote
ENB Top News
ENB
Energy Dashboard
ENB Podcast
ENB Substack


