

Houston, TX – June 6, 2026 – U.S. oil-directed drilling rigs posted their sixth consecutive weekly gain this week—the longest upward streak in domestic exploration since mid-2022—pushing the Baker Hughes oil rig count to 431. The increase comes as higher crude prices, fueled by ongoing disruptions and geopolitical tensions in the Strait of Hormuz, continue to support renewed drilling activity across U.S. shale basins.
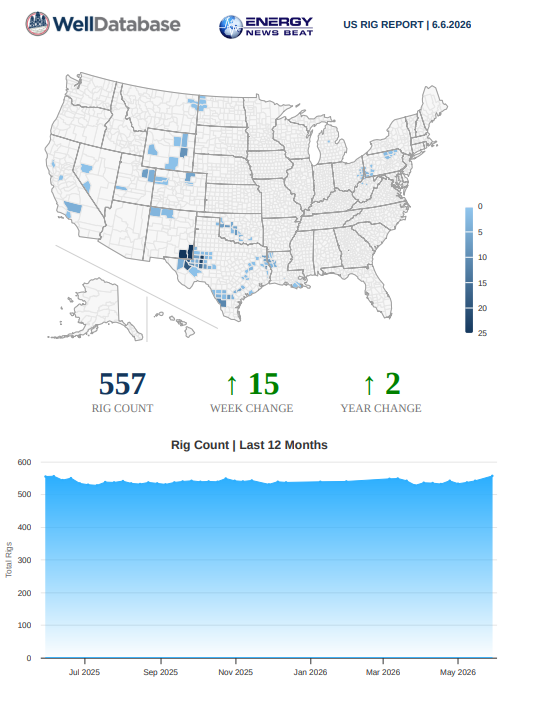
According to Baker Hughes’ latest North America Rig Count (released Friday for the week ending June 5, 2026), the U.S. total rotary rig count rose by 1 to 563. Oil rigs climbed by 2 to 431, while natural gas rigs dipped by 1 to 124. Miscellaneous rigs held steady at 8. The oil/gas/misc ratio stands at approximately 77%/22%/1%.
Using WellDatabase’s tools, they are showing a rig count up at 557, and I am cross-checking vs. the BakerHughes, and it looks like WellDatabase may be more accurate. We will track the trends.
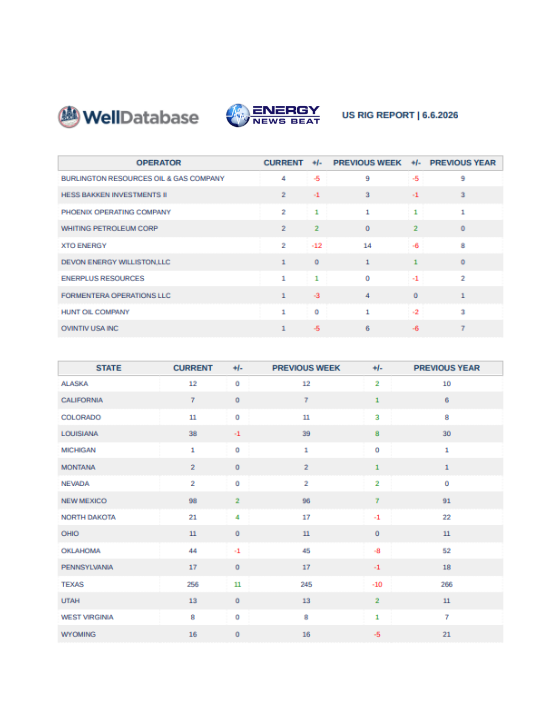
Operators and States
This marks the longest streak of expansion in U.S. oil drilling since mid-2022, when post-pandemic demand recovery first lifted rig activity. Oil rigs have now increased for at least six straight weeks, with recent gains including +10 (week of May 22), +4 (May 29), and +2 (June 5).
Oil vs. Gas Differential
The split between oil and gas rigs remains heavily tilted toward oil, reflecting stronger crude economics amid the Hormuz-driven price support. Oil rigs now account for the vast majority of activity, while gas rigs have shown modest declines or stability in recent weeks. This differential underscores operators’ focus on liquids-rich plays where margins remain attractive despite broader market volatility.
Basins and States: Permian Dominance Continues
While Baker Hughes’ public overview provides national totals, detailed basin and state-level data (sourced from the full North America Rig Count Report and industry summaries) highlight the Permian Basin as the clear leader. Recent reporting shows the Permian adding rigs (e.g., +2 in one recent period to approximately 257 active units), representing roughly 46% of total U.S. oil-directed activity. The basin’s resilience continues to drive national trends.
Key state highlights (approximate based on latest available breakdowns and trends): Texas: Remains the top state with ~230–235 rigs, heavily concentrated in the Permian and Eagle Ford.
New Mexico: Holds steady in the ~100–102 range, contributing significantly to Permian growth.
Other notable basins include the Eagle Ford (~42–44 rigs, stable), Haynesville (gas-focused, ~55 rigs), Williston/Bakken (~28–30 rigs), and Marcellus (Appalachia gas play, ~25 rigs).
The Permian’s outsized role—combined with incremental gains in Texas and New Mexico—has been the primary driver of the national uptick, even as some gas-weighted basins like the Haynesville and Marcellus show more muted or flat activity.
Baker Hughes vs. Enverus Rig Reports
Baker Hughes’ weekly count remains the industry benchmark, offering a standardized snapshot based on its long-established methodology. Enverus (formerly Drillinginfo) provides a complementary daily rig count that tracks over 95% of the U.S. rig fleet via GPS and other real-time data sources. While Enverus often reports slightly higher or more granular figures due to its continuous monitoring, public details for the exact week of June 5, 2026, were not available in open sources at the time of this report. Enverus data is frequently cited by Baker Hughes itself for location verification, and the two sources generally align directionally on major trends.
The Baker Hughes increase to 563 total rigs (up from 559 a year ago in the comparable period) signals cautious optimism, though activity remains well below historical peaks.
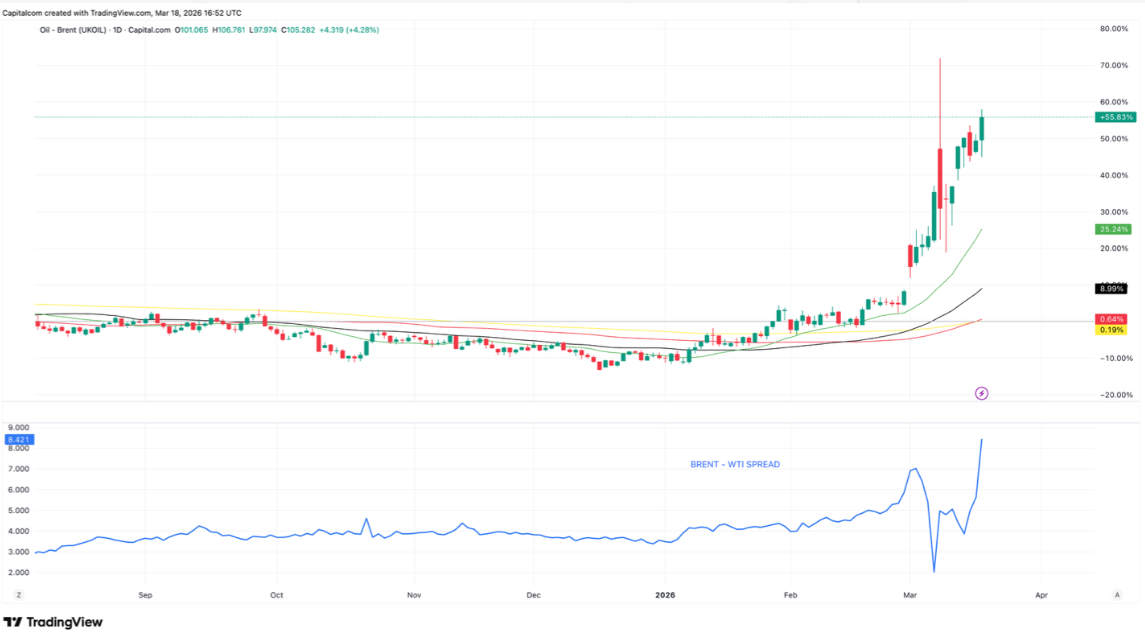
Market Context: The Hormuz Price Bump
The rig resurgence is directly tied to elevated oil prices following disruptions in the Strait of Hormuz amid U.S.-Iran tensions and related conflict impacts. Higher Brent and WTI prices have improved drilling economics, encouraging operators to deploy additional rigs in liquids-rich plays. Analysts note that prolonged constraints in the region could sustain this support through the remainder of 2026.
What’s Next? With the next Baker Hughes report scheduled for June 12 (noting a one-day shift ahead of Juneteenth), watch for continued Permian momentum and any shifts in gas-directed activity. The streak’s extension will depend on sustained price strength and operator capital discipline.
This article is for informational purposes and does not constitute investment advice.
Primary Data Sources & Reports
- Baker Hughes North America Rig Count Overview (June 5, 2026): https://rigcount.bakerhughes.com/
- Full North America Rig Count Report (PDF, 06/05/26): Available via Baker Hughes GCS site (https://bakerhughesrigcount.gcs-web.com/na-rig-count/)
- AOGR U.S. Rig Count Historical Table (detailed weekly oil/gas breakdowns): https://www.aogr.com/web-exclusives/us-rig-count
- Bloomberg Article (June 5, 2026): “Oil Drilling Rises in Longest US Streak Since 2022 on Price Bump” – https://www.bloomberg.com/news/articles/2026-06-05/oil-drilling-rises-in-longest-us-streak-since-2022-on-price-bump?srnd=phx-industries-energy
- Welldatabase.com
Enverus Daily Rig Count: https://www.enverus.com/dailyrigcount/ (real-time GPS-tracked data; public summary page available) Supporting Analysis & Price Context
- Trading Economics – U.S. Crude Oil Rigs: https://tradingeconomics.com/united-states/crude-oil-rigs
- Reuters historical rig reports (context on streaks and basins)
- OilPrice.com / Permian Basin updates
Charts & Visuals (Recommended for Energy News Beat)
- Baker Hughes U.S. Total Rig Count Historical Chart – Available on rigcount.bakerhughes.com or Trading Economics.
- Oil vs. Gas Rig Split (weekly trend) – See AOGR table or Bloomberg-linked data.
- Permian Basin Rig Count Trend – Industry summaries often include visuals; cross-reference with Enverus Rig Analytics.
- Strait of Hormuz Oil Price Impact Charts – Reuters and EIA Short-Term Energy Outlook (STEO) releases.
All data is current as of June 5–6, 2026, reporting. For real-time updates, subscribe to Energy News Beat or follow Baker Hughes/Enverus releases. Sources compiled from Baker Hughes, Bloomberg, AOGR, Enverus, Reuters, Welldatabase, and EIA-aligned reports.