Britain’s operator says it will hold a 5.9 GW cushion this winter. An analyst working from its own workbook gets 0.5 GW.
Prepared by ENB Research Desk for Stu Turley. Data as of Oct. 28, 2026 (CT). ENB opinons are labeled as Stu’s Take
1. Bottom line
| Verdict in brief
Verdict: both grids remain inside their published standards, but the standards rest on assumptions that have quietly grown more generous. Britain’s 9.5% margin is 8.4% on NESO’s own previous method and 0.47 GW — under 1% of peak — on Kathryn Porter’s stress case. NERC puts five regions at high risk by 2029.
|
2. What the margin measures, and who sets it
| Term | What it means | The judgment inside it |
| De-rated margin (GB) | Excess after average cold spell peak demand, at firm not nameplate capacity | Wind and interconnector credits |
| Reserve margin (NERC) | Anticipated resources minus net internal demand, over demand | The load forecast |
Three things move a margin: build capacity, lower the forecast, or credit the fleet more generously. Only the first adds a megawatt. Britain’s number comes from the National Energy System Operator, owned by the Secretary of State (framework); in PJM an auction decides, and 2028/29 cleared 6,831 MW short (PJM).
3. Britain: the headline, and the number behind it
NESO’s Winter Outlook, published 23 October 2026, gives 5.9 GW of de-rated margin — 9.5% of average cold spell peak demand — against 6.1 GW (10.0%) last winter, with loss of load expectation “of less than 0.1 hours per year” (NESO). Chief operating officer Kayte O’Neill credits a “refined modelling approach.”
The methodology change. The old model “converted demand and wind observations into separate probability distributions,” then scaled wind down “during the highest-demand periods.” The new one “calculates demand net of wind by subtracting wind output from demand in each corresponding historical half-hour” (Workbook). Without the change, Appendix D gives “5.2 GW (equivalent to 8.4% of average cold spell (ACS) peak demand)” — [ENB ANALYSIS] about 900 MW below last winter, not the 200 MW the headline implies.
Kathryn Porter’s critique of 27 October does not dispute the arithmetic; it disputes what the arithmetic is asked to prove. The outlook “looks more like wishful thinking than a serious analysis of the true security risks this winter.” She writes that “NESO has changed the way it calculates the contribution of wind generation, increasing the amount of firm capacity attributed to the wind fleet,” that “this change produces a far better result,” and that “A comparison based on different methodologies buried in an appendix is a weak foundation for reassuring readers that electricity security has barely changed.” Her verdict: “That’s pretty misleading in my opinion.” (Watt-Logic)
Her assumptions. Porter “reduced wind’s assumed firm capacity contribution from 16.5% to 10% of installed utility-scale capacity and halved the 6.6 GW contribution attributed to interconnectors, removing the Irish interconnectors.” Ladder: 5.90 GW; 4.42 GW at 12%; 3.76 GW at 10%; 2.61 GW with interconnectors halved; 0.47 GW with both. “This is an illustrative stress scenario, not a probabilistic forecast.” [ENB ANALYSIS] ENB rebuilt it and matches within rounding: 2,135 MW less wind credit plus 3,296 MW less interconnector credit gives 469 MW (data; E1).
What it does not establish. Porter concedes her work “doesn’t show that NESO’s equivalent firm capacity calculation is wrong,” and NESO that its metric “does not show whether risk is concentrated in a small number of severe weather years” (Workbook).
4. North America: NERC’s own scorecard
The winter assessment. The most recent is 2025–26, published November 2025. Peak demand rose 20 GW (2.5%) after “years of flat or low (~1%)” growth; resources rose 9.4 GW (NERC WRA). Seven areas were named at elevated risk: NPCC-Maritimes, NPCC-New England, SERC-East, SERC-Central, Texas RE-ERCOT, WECC-Basin and WECC-Northwest. NPCC-Maritimes carried 16.9% against a 20% reference — “270 MW below the area’s Reference Margin Level.” In the extreme scenario, SERC-Central falls to −0.9%, WECC-Basin to −21.1% and ERCOT to −20.0%.
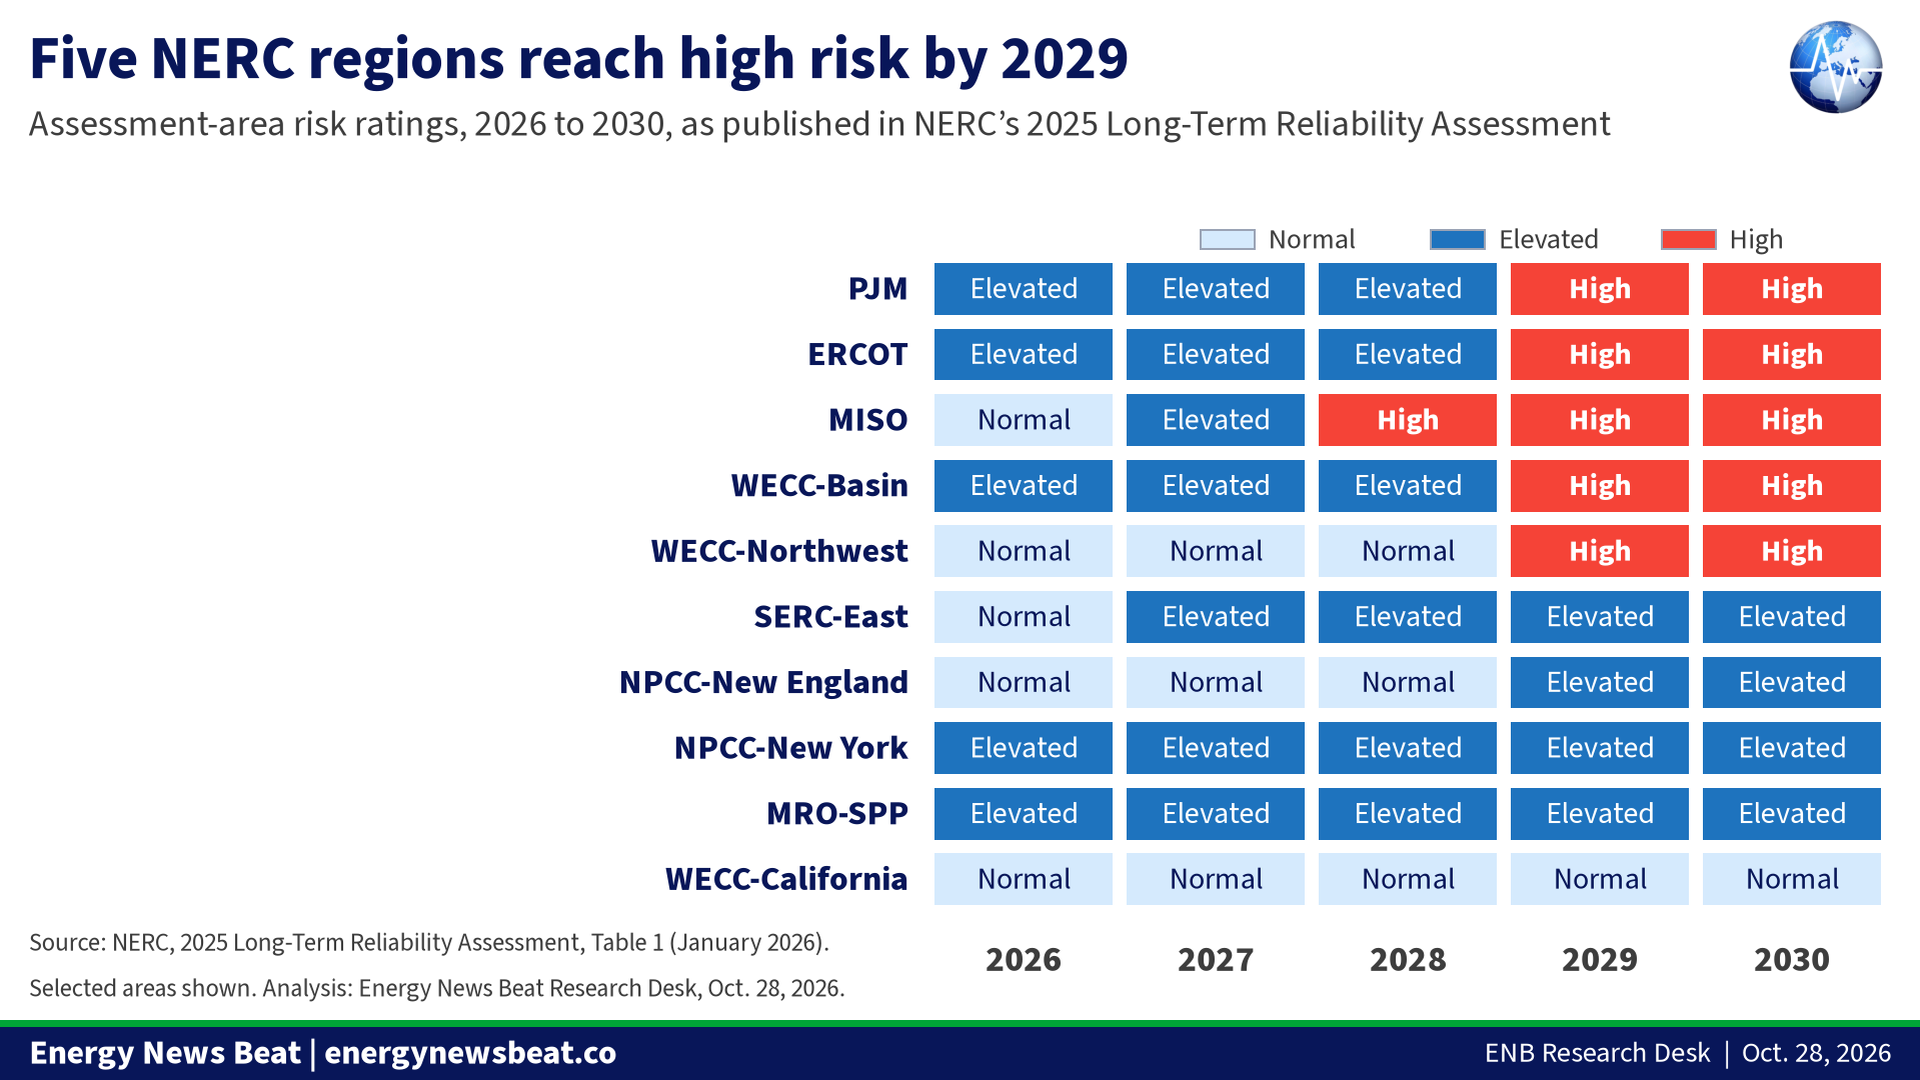
The long-term assessment. The 2025 LTRA finds 13 of 23 areas facing resource adequacy challenges over ten years; five reach High Risk — MISO from 2028, and PJM, ERCOT, WECC-Basin and WECC-Northwest from 2029. Ten-year summer peak growth is 224 GW, 69% above the prior projection, against more than 105 GW of peak seasonal capacity confirmed or announced for retirement (LTRA).
The extreme scenario is where the two NERC documents meet. Four areas fall below zero — WECC-Basin at −21.1%, ERCOT at −20.0%, WECC-Northwest at −8.5% and SERC-Central at −0.9% (WRA). Read those as deficits, not margins. WECC-Basin and WECC-Northwest are also two of the five areas the long-term assessment escalates to High Risk from 2029. [Stu’s Take] Two of the four areas below zero in the winter stress case are two of the five at the top of the ten-year risk list — one finding measured twice.
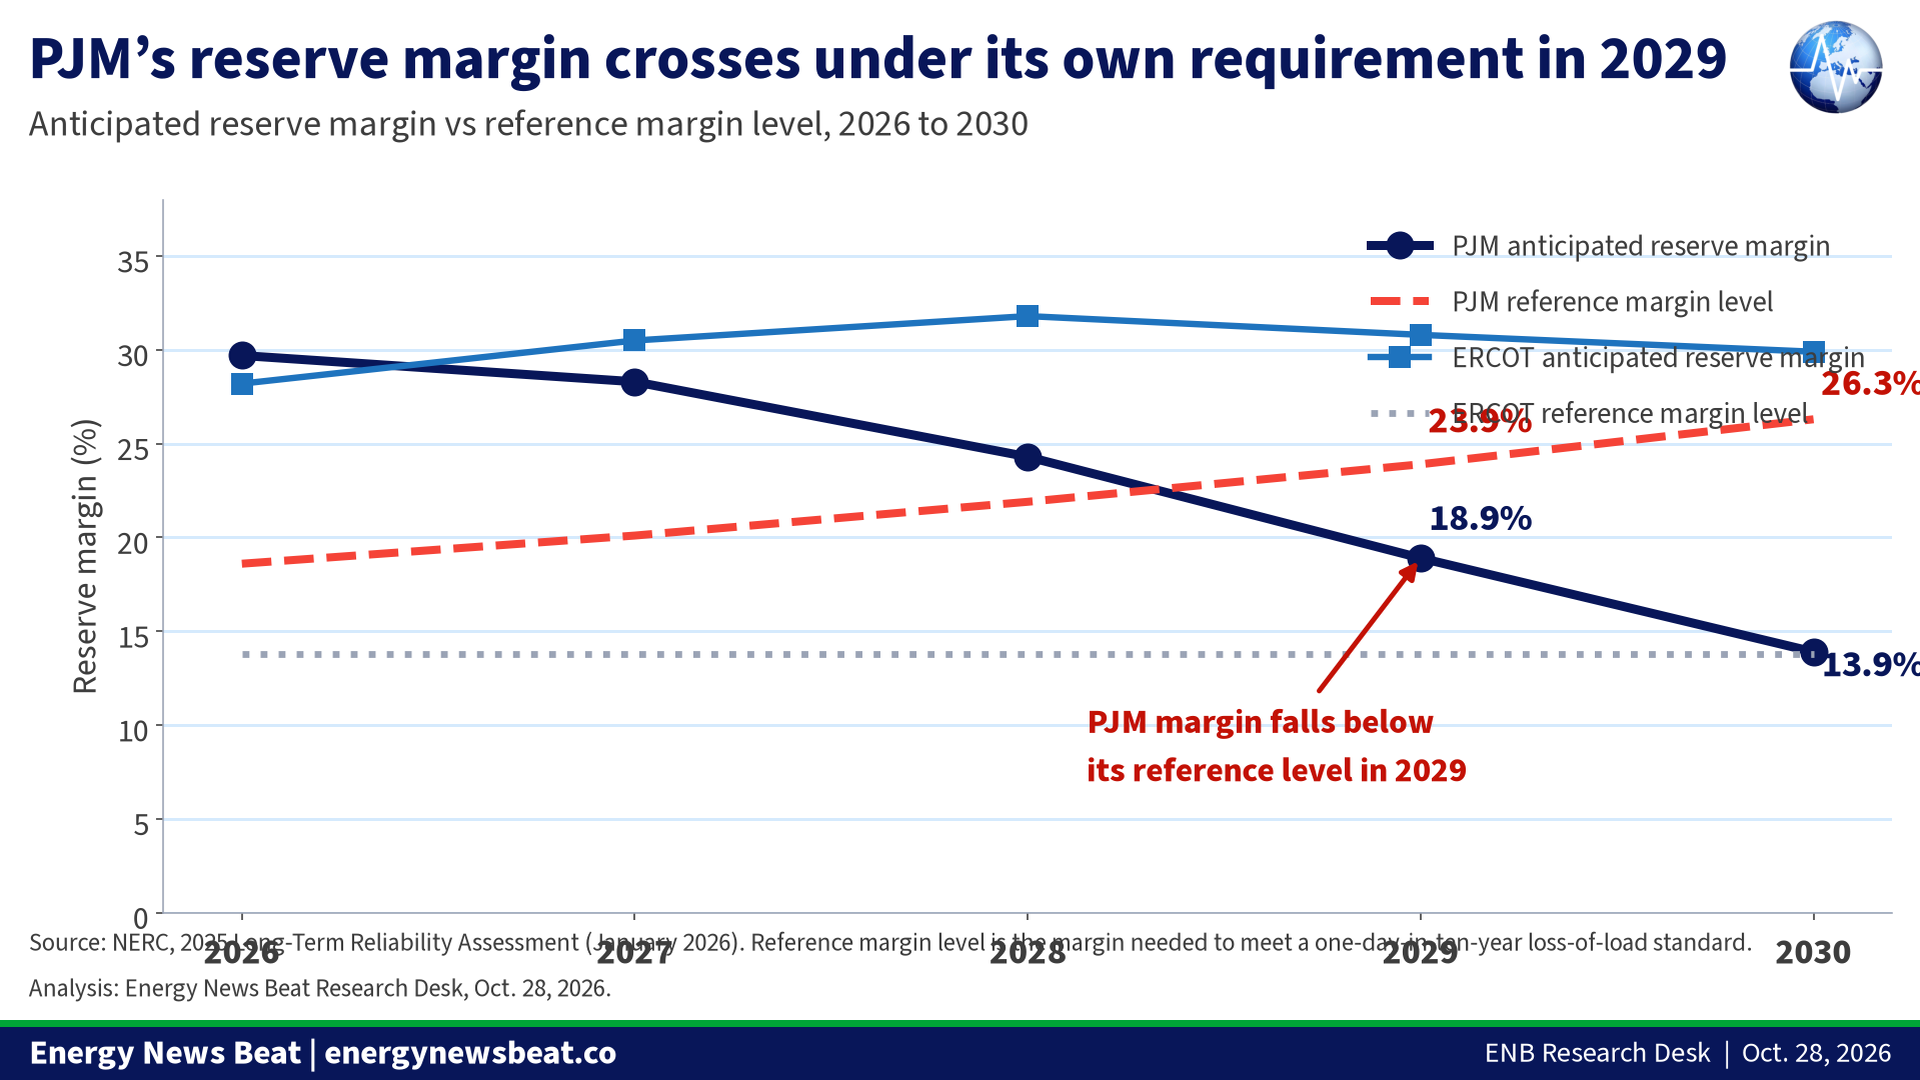
PJM is where the margin crosses the line. Anticipated reserve margin falls from 29.7% in 2026 to 13.9% in 2030 while the reference level rises from 18.6% to 26.3%; loss-of-load hours go from 3.50 in 2027 to 65.50 in 2029 (LTRA). The auction has priced it: 2028/29 cleared at the $325.00/MW-day cap, 6,831 MW short — “the first in PJM history in which the entire RTO fell short of the reliability requirement” (PJM). ENB traced the cost side in its earlier deep dive, Who Pays for the Wires?
5. Preparedness signals: what governments tell people to expect
Britain’s three-day campaign. The Cabinet Office launched “Be Ready” on 22 October 2026 with partners in France, Ireland and the Netherlands: prepare for three days without normal services, with three litres of water per person per day. “Being ready for 3 days helps” (GOV.UK). The Prime Minister, 23 October: “It’s not about panicking… It’s about just taking sensible measures to have enough in the house” (BBC). [ENB ANALYSIS] It is all-hazards, not an electricity forecast — but a state expecting its margin to hold would not seed three days of household self-sufficiency the same week its operator published a 9.5% cushion.
FORTRESS. Announced 30 September 2026. The Secretary of War: “Every major military installation in America is going to generate its own power independent of the civilian grid” (DefenseScoop; Army). The 90-day figure is unconfirmed. Fox News Digital reported on 25 October, citing documents it reviewed, that installations “would be expected to sustain essential operations independently for at least 90 days” (Fox News). No DoD document states 90 days, and the department spokesperson quoted throughout Fox’s report has not confirmed the figure. Snopes rated the claim “Mostly True” on 26 October while noting the 90-day figure itself remains unconfirmed (Snopes). The only standard ENB could verify is shorter: Army Directive 2020-03 requires the Army to “plan to sustain energy and water for a minimum of 14 days” (Army). [Stu’s Take] That gap matters — when the best-resourced institution in the country builds islanded power, it is saying something about how much it trusts the grid’s worst case.
6. What removes margin without warning
Physical attack. On 15 February 2026 a Fairfield, Maine man was accused of firing dozens of rounds at three Central Maine Power substations; more than 10,000 customers lost power, and in May he was federally charged with destruction of an energy facility (Bangor Daily News). Four days later a 23-year-old drove through a substation gate in Boulder City, Nevada; thermite was recovered, but no critical components were damaged (WaterISAC; CNN).
Cyber pre-positioning. CISA-led advisory AA24-038A assesses that China state-sponsored actors “are seeking to pre-position themselves on IT networks for disruptive or destructive cyberattacks,” that Volt Typhoon compromised environments in “Communications, Energy, Transportation Systems, and Water and Wastewater Systems,” and that this enables “lateral movement to OT assets to disrupt functions,” with footholds held “for at least five years” (CISA).
Supply chain. Executive Order 14421, signed 26 August 2026, declares a national emergency over “the foreign supply of bulk-power system electric equipment” — transformers, inverters, storage and control systems — and lets DOE condition the “continued use, operation, maintenance, servicing, or updating” of installed equipment (White House; Federal Register).
A claim ENB is not treating as fact. On 2 October 2026 the ransomware group Incransom listed Sangre de Cristo Electric Association, a Colorado cooperative, claiming access to “SCADA/EMS-related environments” and “control-system credentials” (Ransomware.live). This is hacker-sourced. The cooperative’s notice says the incident was in its IT network, that “at no time was your electric service or the electric grid affected,” and that it had “no evidence that financial or other sensitive personal information was compromised” (SDCEA).
7. Texas, and the states that kept the old assumptions
The clearest natural experiment is the five years since Winter Storm Uri, which forced ERCOT to order 20,000 MW of rolling blackouts. FERC and NERC attributed 75.6% of unplanned outages and failures to start to freezing and fuel problems (FERC/NERC); Texas recorded 246 deaths (DSHS).
Texas then did three things that show up in documents rather than press releases. A weatherization rule for generators and transmission providers, 16 TAC §25.55, with ERCOT inspecting every generation resource at least every three years (PUCT); a parallel rule for the gas side, 16 TAC §3.66, requiring critical gas facilities to weatherize and file annual attestations (RRC); and the Texas Energy Fund: 9 loans, 5,446 MW, $4.11 billion committed as of 23 October 2026 (Texas Energy Fund). Inspections stand at 4,588 cumulative (ERCOT).
NERC singles Texas out — “Texas is an exception, where the Railroad Commission of Texas adopted rules to require critical natural gas facilities to implement weather-related emergency preparation measures” — in a document that otherwise records that freeze protection “mitigations are voluntary for the natural gas industry in most of North America” (NERC WRA).
The slower learners are not villains in the data. PJM’s problem is load, not weatherization. Virginia’s is the queue behind the load: Dominion reports about 70 GW of requested data center demand, 25 GW with connection dates through 2031 (SCC). New York’s is retirement sequencing: the Gowanus barges must stay available through May 1, 2029 (NYISO). California’s is the gap between a 42.7%–53.2% planning margin and a distribution system that keeps producing emergencies — 10 CAISO alerts in 2026 to date, against 23 in 2025 and 61 in 2024 (CAISO).
8. What a margin costs, and what the alternatives cost
| Instrument | Cost or size, as documented | Source |
| PJM 2028/29 auction | $325.00/MW-day cap; 6,831 MW short | PJM |
| Texas Energy Fund | 9 loans, 5,446 MW; $4,109,114,828.82 | TXEF |
| Retirements deferred | 12.3 GW planned for 2025, 4.6 GW retired | EIA |
| Standby generator | $8,000–$16,000 installed | Generac |
| Home battery (one quote) | $16,818 installed, 13.5 kWh | AmpMyHome |
| Interconnector credit (GB) | 6.6 GW de-rated; halving it removes 3.3 GW | NESO |
The cheapest megawatt of margin in the last two years has been one already built and talked out of retiring (EIA). The most expensive per unit of reliability may be the one at the customer’s wall: a $16,818 battery is defensible for a household and indefensible as a way to run a transmission system.
Land, fuel and lead times. Offsetting 105 GW of retirements means gas turbines, and turbines mean pipelines and queues. ENB’s September 2026 conversation with Doomberg and Steven Wang of Jackery Americas put reported waits at two to three years for transformers and five years for large gas generators (ENB). In Britain the constraint is interconnection: NESO assumes “that all interconnectors will perform in line with their Capacity Market de-rating factor obligations during periods of stress” (NESO), and Porter notes “there is no mechanism whatsoever for NESO to compel imports to Britain from other countries” (Watt-Logic).
9. Limitations: what none of these numbers capture
- Correlation, not capacity, is the risk. NESO concedes its metric “does not show whether risk is concentrated in a small number of severe weather years” (Workbook).
- Transmission constraints sit outside the calculation. A national margin can coexist with a regional blackout (Watt-Logic).
- Load forecasts are the softest input. NERC warns that ERCOT and PJM revisions “indicate that some large-load projects have slowed or failed to materialize” (LTRA).
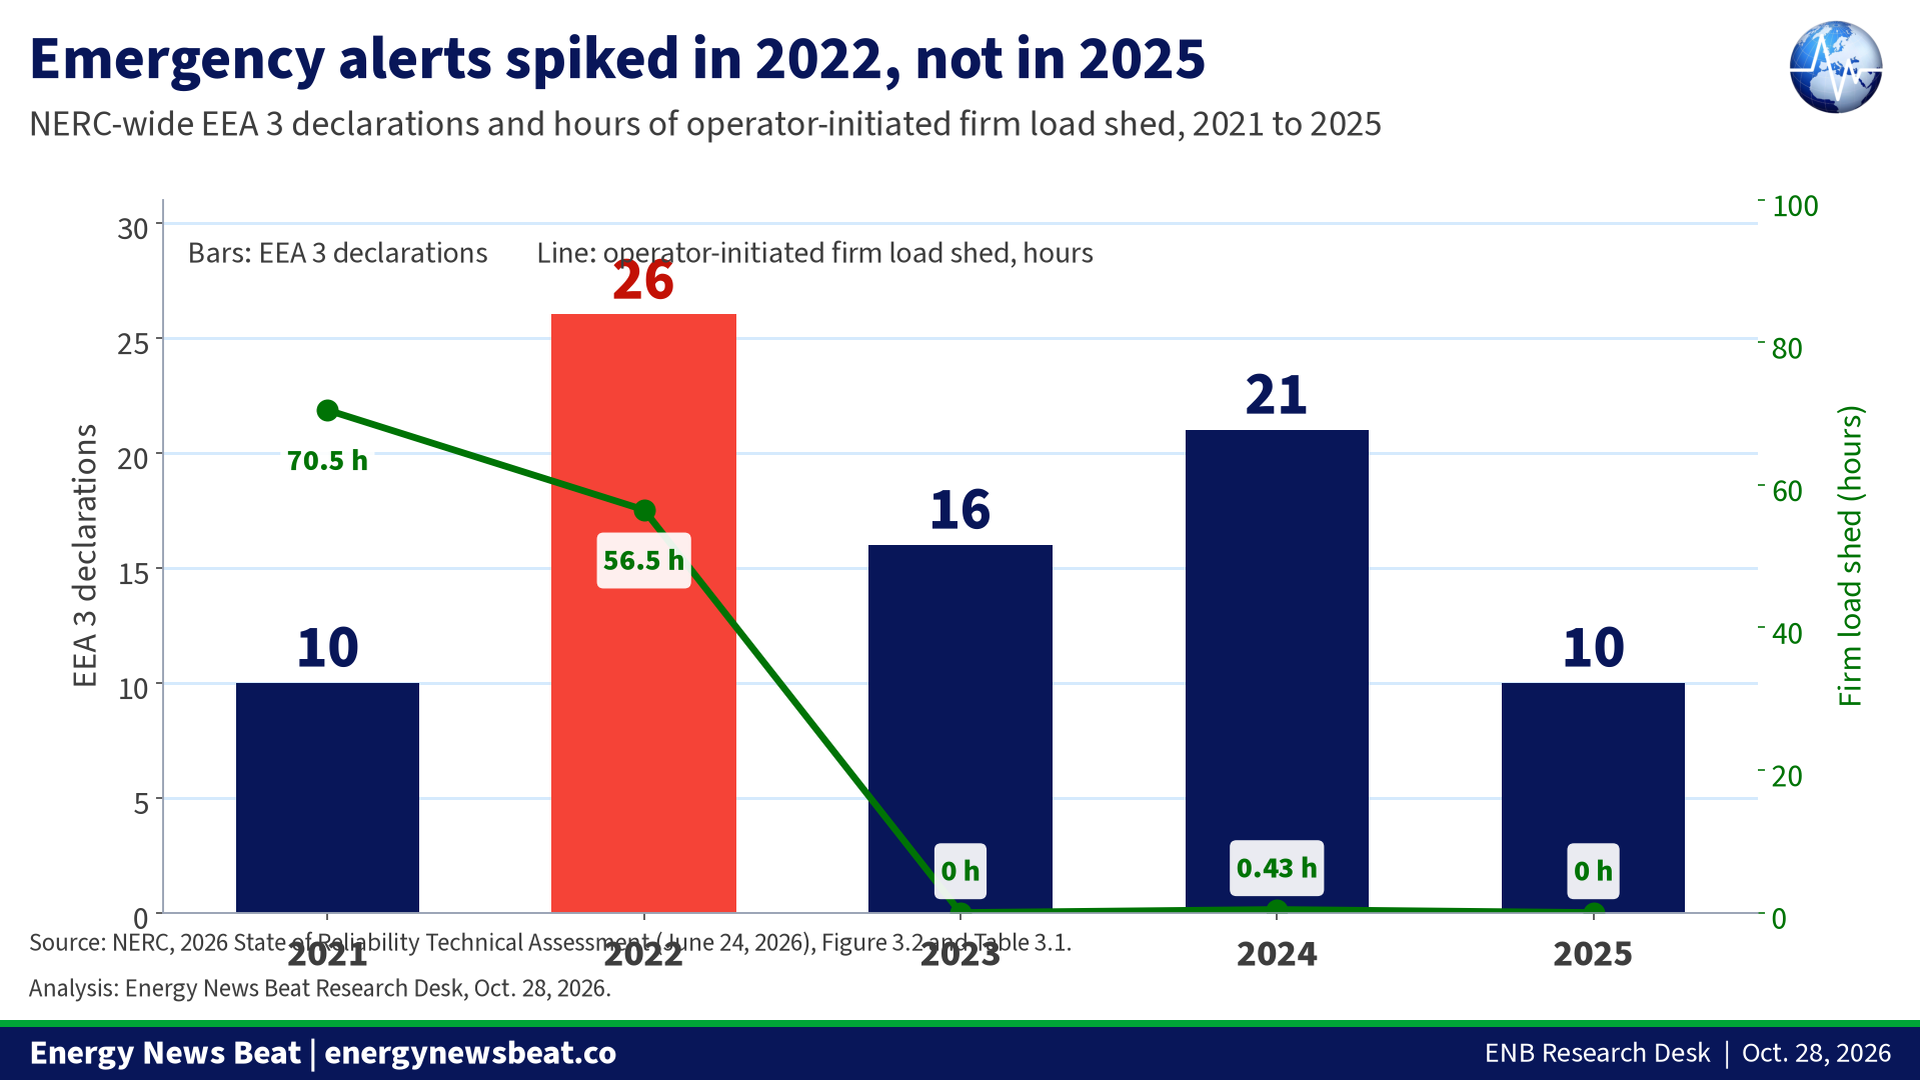
- Firm load shed is not the only failure. NERC counted zero hours in 2023 and 2025, but 70.5 in 2021 and 56.5 in 2022 (NERC).
10. Track record: what the margin series actually did
- Britain’s published de-rated margin ran between 5.1% (2015/16) and 12.9% (2019/20), fell to 6.3% in 2022/23, and has climbed back to 9.5% on the current method — 8.4% on the previous one (NESO). [Stu’s Take] The series has been a poor predictor of events on the day: its lowest reading, 5.1%, was a quiet winter, and the emergency of recent years — 23 June 2026 — arrived in summer.
- North America’s record is more textured. Firm load shed hours since 2021 read 70.5, 56.5, 0, 0.43, 0, and EEA 3 declarations went 10, 26, 16, 21, 10 (NERC). The January 2025 cold snap set PJM’s all-time winter peak of 143,714 MW and still held reserves, with a 9.24% forced outage rate NERC called “relatively low… for the weather experienced” (NERC WRA). [Stu’s Take] The system has been stressed and held — the strongest argument against the alarmist reading, and the weakest against complacency.
11. What readers should ask, and what to watch
- Ask for the like-for-like number. When an operator changes method and the headline is stable, the second number is the story. NESO published it; ask every operator to.
- Watch NERC’s 2026–27 Winter Reliability Assessment, due Nov. 18, 2026 (NERC) — the first to price in a full year of data-center load growth.
- Watch the PJM 2029/30 capacity auction. NERC projects PJM’s margin crossing below its reference level in 2029; that auction turns the projection into a price.
- Watch whether any state follows Texas on gas weatherization. NERC’s finding that freeze protection is “voluntary… in most of North America” is the largest unaddressed winter vulnerability (NERC WRA).
- Watch DOE’s rulemaking under Executive Order 14421, due within 120 days of 26 August 2026 (Federal Register).
12. Stu’s Take
| [Stu’s OPINION] The buffer is thinner than the headline. Every number in this section is linked to the source used above.
For two years the argument about the grid has been run as if the only question is how fast we add wind, solar and batteries. That is not the question. The question is what happens on the worst Tuesday in January, and the people who answer it for a living are telling us — in their own filings — that it is getting tighter. In Britain, the operator published a 9.5% cushion and then disclosed in an appendix that its own previous method gives 8.4% (NESO). Kathryn Porter takes that to 0.5 GW — under 1% — with two assumption changes she states plainly (Watt-Logic). I do not think 0.5 GW is the forecast. I think it is the right stress test, and that an analyst can get there from the operator’s own workbook in a day is the story. In America, NERC has five regions at high risk by 2029, PJM’s margin crossing under its reference level that year, and an auction that already cleared 6,831 MW short at the price cap (LTRA; PJM). None of that is a blackout forecast. All of it says we stopped building the capacity that shows up in bad weather and started building the kind that shows up in good weather. Texas is the counter-example and should be studied, not caricatured. Weatherization on both the generator and gas sides, 4,588 inspections, and $4.11 billion committed to dispatchable plants (PUCT; RRC; ERCOT; TXEF) is what taking a failure seriously looks like. The threat picture sharpens the question. Volt Typhoon pre-positioning, substation shootings in Maine and Nevada, and an executive order treating foreign-made transformers as a national emergency (CISA; White House) — none of that is in a reserve margin. A margin is a weather forecast. The grid is being asked to survive things that are not weather. So: the lights are not going out next month, and anyone selling that is selling something. But assuming the grid is somebody else’s problem is over. That is why we spent the year with Steven Wang on home batteries (Jackery) and Doomberg on bulk-power supply chains (Doomberg). A household that can ride through three days is not a prepper — it is a ratepayer who read the appendix.
|
13. Open questions
- What does NESO’s LOLE look like as a severity distribution rather than an average? Until it is published, 0.1 hours cannot distinguish a quiet winter from one with a very bad week.
- Is the 16.5% wind credit validated out of sample? Porter’s objection is about the tail, not the mean; NESO’s 17 weather years run 2005 to 2022 (Watt-Logic).
- Will any jurisdiction outside Texas adopt mandatory gas freeze protection?
- What is the actual FORTRESS standard, and when is it published?
- How much of the data-center queue is real? PJM and ERCOT have revised near-term forecasts down while raising later years (LTRA).
-
Check out the World’s Greatest Podcast Show Notes at EnergyNewsBeat.co or EnergyNewsBeat.com. And subscribe to: The Energy News Beat Substack.
Appendix A. Sources, with access dates
All sources below were opened and read by ENB on Oct. 28, 2026 unless a different access date is given; where a document carries its own date, that date is shown. One cited page could not be read directly — ferc.gov returned an access error to every request, so the FERC/NERC finding is carried as reported and linked, and nothing load-bearing rests on it. DefenseScoop was read in full; the Army’s own copy of the Hegseth address did not load, and that quotation is carried from DefenseScoop and Air & Space Forces Magazine, which both reproduce it verbatim.
| Source | Date | Link |
| NESO, Winter Outlook 2026/27 (report PDF) | Oct. 23, 2026 (revised Oct. 27, 2026) | link |
| NESO, Winter Outlook 2026/27 Technical Workbook & Methodology | Oct. 2026 | link |
| NESO, Winter Outlook data workbook (Figures 1–19, unavailability factors) | Oct. 2026 | link |
| NESO, Winter Watch landing page | accessed Oct. 28, 2026 | link |
| NESO, Independent investigation concludes allegations against NESO were unsubstantiated | Oct. 19, 2026 | link |
| Eversheds Sutherland (International) LLP, Whistleblowing Investigation Report | Oct. 19, 2026 | link |
| GOV.UK, National Energy System Operator framework document | updated Jul. 14, 2026 | link |
| Kathryn Porter / Watt-Logic, NESO winter outlook flattered by optimistic assumptions and new methodology | Oct. 27, 2026 | link |
| NERC, 2025–2026 Winter Reliability Assessment | Nov. 2025 | link |
| NERC, 2025 Long-Term Reliability Assessment | Jan. 2026 | link |
| NERC, 2026 Summer Reliability Assessment | May 2026 | link |
| NERC, 2026 State of Reliability Technical Assessment | Jun. 24, 2026 | link |
| NERC, 2026–2027 Winter Reliability Assessment schedule | as of Aug. 2026 | link |
| PJM, 2028/29 Base Residual Auction results release | Jul. 14, 2026 | link |
| PJM, operations update on January 2026 cold weather | Jan. 30, 2026 | link |
| US Department of Energy, Order No. 202-26-06 (PJM, FPA §202(c)) | Jan. 26, 2026 | link |
| EIA, Retirements of US generating capacity in 2026 | Feb. 23, 2026 | link |
| EIA, Average US customer outage time in 2024 | Dec. 1, 2025 | link |
| The White House, Executive Order 14421 | Aug. 26, 2026 | link |
| Federal Register, 91 FR 55995 (EO 14421) | Aug. 31, 2026 | link |
| CISA/NSA/FBI/DOE et al., advisory AA24-038A (Volt Typhoon) | Feb. 7, 2024, updated Mar. 7, 2024 | link |
| CISA et al., advisory AA25-239A | Aug. 2025 | link |
| WaterISAC, incident report on the Nevada substation event | Feb. 26, 2026 | link |
| CNN, Nevada counterterrorism incident investigation | Feb. 20, 2026 | link |
| Bangor Daily News, Central Maine Power substation shootings | Feb. 15, 2026 | link |
| Central Maine, federal charge in CMP substation case | May 21, 2026 | link |
| WABI, federal court appearance in CMP substation case | May 26, 2026 | link |
| Sangre de Cristo Electric Association, Notice of an IT security incident | Oct. 2026 | link |
| Chaffee County Times, SDCEA cybercriminal access to IT network | Oct. 14, 2026 | link |
| Ransomware.live, Incransom victim listing for Sangre de Cristo Electric Association (hacker-sourced) | listing dated Oct. 2, 2026; read Oct. 28, 2026 | link |
| GOV.UK / Cabinet Office, Be Ready campaign launch | Oct. 22, 2026 | link |
| Be Ready campaign site, emergencies guidance | accessed Oct. 28, 2026 | link |
| BBC, Prime Minister remarks on Be Ready | Oct. 23, 2026 | link |
| DefenseScoop, Pentagon memo on the FORTRESS America program office | Oct. 7, 2026 | link |
| US Army, State of the Force address coverage | Oct. 2, 2026 | link |
| Fox News Digital, FORTRESS 90-day reporting | Oct. 25, 2026 | link |
| Snopes, fact-check on the 90-day FORTRESS claim | Oct. 26, 2026 | link |
| Inside Defense, Hegseth memo on FORTRESS America | Oct. 2026 | link |
| Air & Space Forces Magazine, FORTRESS resilient energy | Oct. 20, 2026 | link |
| US Army, Directive 2020-03 (energy and water resilience) | 2020 | link |
| Public Utility Commission of Texas, 16 TAC §25.55 | current | link |
| Railroad Commission of Texas, weatherization rule FAQ (16 TAC §3.66) | current | link |
| Texas Legislature, SB 6 (89th Legislature) | 2025 | link |
| Public Utility Commission of Texas, 16 TAC §25.194 | effective Oct. 8, 2026 | link |
| Texas Energy Fund, awards dashboard | updated Oct. 23, 2026 | link |
| ERCOT, Weatherization overview (D. Kezell) | Apr. 20, 2026 | link |
| Ask the Grid, ERCOT emergency alert tracker | read Oct. 28, 2026 | link |
| FERC, final report on the February 2021 freeze | Nov. 2021 | link |
| Texas DSHS, February 2021 winter storm mortality report | Dec. 31, 2021 | link |
| CAISO, RC West oversight committee Q3 presentation | Aug. 20, 2026 | link |
| CAISO, grid emergencies history 1998 to present | updated Oct. 9, 2026 | link |
| WECC, State of the Interconnection 2026, system events | 2026 | link |
| WECC, State of the Interconnection 2025, system events | 2025 | link |
| NYISO, 2026 Q1 STAR report | 2026 | link |
| AlphaGen, withdrawal of retirement notices | Apr. 2026 | link |
| Dominion Energy, load forecast documentation filed with PJM | Jan. 2026 | link |
| Virginia State Corporation Commission, Dominion data center filing | Feb. 2026 | link |
| Energy News Beat, Who Pays for the Wires? | Oct. 25, 2026 | link |
| Energy News Beat, Jackery interview with Steven Wang | Aug. 19, 2026 | link |
| Energy News Beat, Doomberg with Steven Wang | Sep. 9, 2026 | link |
Appendix B. Key excerpts
NESO, Winter Outlook 2026/27, Key Messages.
“Our base case de-rated margin for winter 2026/27 is 5.9 GW (equivalent to 9.5% of average cold spell (ACS) peak demand), with an associated loss of load expectation (LOLE) of less than 0.1 hours per year. This remains in line with margins forecast in recent winters.”
NESO, Winter Outlook 2026/27, Appendix D — the old-method result.
“The de-rated margin for winter 2026/27 from the CA model is 5.2 GW (equivalent to 8.4% of average cold spell (ACS) peak demand), with an associated loss of load expectation (LOLE) of less than 0.1 hours per year, which is well within the Reliability Standard of 3 hours per year. This is comparable to the de-rated margin of 5.5 GW (8.8%) published in the Early View of Winter and in line with recent winters.”
NESO, Winter Outlook 2026/27, Appendix D — why the method changed.
“Our new modelling approach, based on the PLEXOS simulation tool, better reflects observed correlation between renewable generation availability and demand.”
NESO, Technical Workbook, on the change from the old wind treatment.
“Under the previous approach, the CA model converted demand and wind observations into separate probability distributions. It then applied a linear scaling adjustment to reduce assumed wind output during the highest-demand periods.” The new method instead “calculates demand net of wind by subtracting wind output from demand in each corresponding historical half-hour.”
NESO, Technical Workbook, on what LOLE does not tell you.
“As variable renewables and duration-limited storage increase, adequacy risk may become more concentrated in infrequent but severe periods of high demand, low renewable output and constrained storage duration… LOLE adds a probabilistic view but measures only the probability-weighted average number of hours with a shortfall. It does not show whether risk is concentrated in a small number of severe weather years, nor the depth or duration of potential shortfalls.”
Kathryn Porter, Watt-Logic, Oct. 27, 2026.
“The problem is this change produces a far better result, suggesting a higher wind contribution that the previous method did. That offends the principle of conservatism that should underpin winter margin calculations particularly when without it, the margin would be much lower than last year.”
“A comparison based on different methodologies buried in an appendix is a weak foundation for reassuring readers that electricity security has barely changed. That’s pretty misleading in my opinion.”
“I reduced wind’s assumed firm capacity contribution from 16.5% to 10% of installed utility-scale capacity and halved the 6.6 GW contribution attributed to interconnectors, removing the Irish interconnectors and reflecting the risk that neighbouring countries may be unable or unwilling to export electricity during periods of simultaneous scarcity.”
Eversheds Sutherland, Whistleblowing Investigation Report, §5.31.
“Our investigation has not substantiated any of the four specific allegations set out by the ToR… It is our opinion, however, that the allegations arose for a number of underlying reasons, principally, high levels of operational stress, a significant disconnect between the ENCC and executive leadership, a culture of reputational sensitivity affecting the perception of operational independence, and a gap between formal Speak Up commitments and the lived experience of staff.”
NERC, 2025–2026 Winter Reliability Assessment.
“After years of flat or low (~1%) peak demand growth, the aggregate peak demand for all NERC assessment areas has risen by 20 GW (2.5%) since the previous winter.”
“natural gas infrastructure freeze protection mitigations are voluntary for the natural gas industry in most of North America, resulting in uneven application of protections and continued supply risks during extreme conditions.”
“All areas are assessed as having adequate resources for normal winter peak-load conditions (i.e., the area’s 50-50 peak forecast). However, more extreme winter conditions extending over a wide area could result in electricity supply shortfalls.”
NERC, 2025 Long-Term Reliability Assessment.
“Projected retirements have shrunk from the 2024 LTRA… Though the confirmed and announced potential retirements over the next 10 years remain high and total over 105 GW in peak seasonal capacity, this is roughly 10 GW lower than the 10-year retirement projections last year.”
NERC, 2026 State of Reliability Technical Assessment.
“Figure 3.2 shows that 10 EEA 3s were declared in 2025, a reduction of 11 EEA 3 declarations over 2024. None of the EEA 3 declarations in 2025 included load shed, versus 0.108 GWh of firm load shed in 2024.”
CISA et al., AA24-038A.
“Volt Typhoon has compromised the IT environments of multiple critical infrastructure organizations—primarily in Communications, Energy, Transportation Systems, and Water and Wastewater Systems Sectors.”
Fox News Digital, Oct. 25, 2026 (the only source for the 90-day figure).
“every major military installation in the continental United States would be expected to sustain essential operations independently for at least 90 days, including access to electricity, water, fuel and communications.”
Appendix C. Data tables
Table C1. Great Britain de-rated margin by winter, as published (%). As-of date: NESO Winter Outlook 2026/27, Figure 3, published Oct. 23, 2026. The 2026/27 figure is on the new method; the old-method alternative is shown separately. Source: NESO data workbook.
| Winter | Published de-rated margin (%) | Old-method equivalent (%) |
| 2015/16 | 5.1 | — |
| 2016/17 | 6.6 | — |
| 2017/18 | 10.3 | — |
| 2018/19 | 11.7 | — |
| 2019/20 | 12.9 | — |
| 2020/21 | 8.3 | — |
| 2021/22 | 6.6 | — |
| 2022/23 | 6.3 | — |
| 2023/24 | 7.4 | — |
| 2024/25 | 8.8 | — |
| 2025/26 | 10.0 | — |
| 2026/27 | 9.5 | 8.4 |
Table C2. NESO’s adjustment ladder, ENB reconstruction. Base case 5,900 MW. Wind credit change computed on utility-scale wind of 32,848.5 MW; interconnector credit 6,592 MW de-rated. Source: NESO data workbook.
| Case | Change vs base (MW) | Resulting margin (MW) | As % of 62,100 MW |
| NESO base case | — | 5,900 | 9.5% |
| Wind credit 16.5% → 12% | −1,478 | 4,422 | 7.1% |
| Wind credit 16.5% → 10% | −2,135 | 3,765 | 6.1% |
| Interconnector credit −25% | −1,648 | 4,252 | 6.8% |
| Interconnector credit −50% | −3,296 | 2,604 | 4.2% |
| Wind 10% and interconnectors −50% | −5,431 | 469 | 0.8% |
Table C3. NERC assessment area risk ratings, 2026–2030 (2025 Long-Term Reliability Assessment). As-of date: January 2026. Source: NERC LTRA, Table 1.
| Assessment area | 2026 | 2027 | 2028 | 2029 | 2030 |
| MISO | Normal | Elevated | High | High | High |
| MRO-SPP | Elevated | Elevated | Elevated | Elevated | Elevated |
| NPCC-New England | Normal | Normal | Normal | Elevated | Elevated |
| NPCC-New York | Elevated | Elevated | Elevated | Elevated | Elevated |
| PJM | Elevated | Elevated | Elevated | High | High |
| SERC-East | Normal | Elevated | Elevated | Elevated | Elevated |
| Texas RE-ERCOT | Elevated | Elevated | Elevated | High | High |
| WECC-Basin | Elevated | Elevated | Elevated | High | High |
| WECC-Northwest | Normal | Normal | Normal | High | High |
| WECC-California | Normal | Normal | Normal | Normal | Normal |
Table C4. PJM and ERCOT anticipated reserve margin vs reference margin level (%). As-of date: January 2026, NERC LTRA. Source: NERC LTRA.
| Series | 2026 | 2027 | 2028 | 2029 | 2030 |
| PJM ARM | 29.7 | 28.3 | 24.3 | 18.9 | 13.9 |
| PJM RML | 18.6 | 20.1 | 21.9 | 23.9 | 26.3 |
| ERCOT ARM | 28.2 | 30.5 | 31.8 | 30.8 | 29.9 |
| ERCOT RML | 13.8 | 13.8 | 13.8 | 13.8 | 13.8 |
Table C5. Energy Emergency Alert 3 declarations and firm load shed, 2021–2025. As-of date: June 24, 2026. Source: NERC 2026 State of Reliability, Figure 3.2 and Table 3.1.
| Year | EEA 3 declarations | Hours of operator-initiated firm load shed |
| 2021 | 10 | 70.5 |
| 2022 | 26 | 56.5 |
| 2023 | 16 | 0.00 |
| 2024 | 21 | 0.43 |
| 2025 | 10 | 0.00 |
Table C6. Winter risk-scenario reserve margins under extreme conditions (%). NERC Table 3’s “higher demand, outages and derates” column, lowest to highest. A minus sign means resources fall short of demand plus operating reserve — a deficit, not a margin. As-of date: November 2025. Source: NERC WRA, Table 3.
| Area | Extreme-scenario reserve margin (%) |
| WECC-Basin | −21.1 |
| TRE-ERCOT | −20.0 |
| WECC-Northwest | −8.5 |
| SERC-Central | −0.9 |
| SERC-East | +3.0 |
| MISO | +3.7 |
| NPCC-New England | +8.7 |
| PJM | +15.6 |
Table C7. US planned retirements vs actual, 2025–2026. As-of date: February 23, 2026. Source: EIA.
| Item | Value |
| Capacity planned for retirement in 2025 | 12.3 GW |
| Capacity actually retired in 2025 | 4.6 GW (least since 2008) |
| Coal retired in 2025 vs anticipated | 2.6 GW vs 8.0 GW |
| Capacity planned for retirement in 2026 | 11.0 GW (58% coal, 42% gas) |
Appendix D. What ENB could not confirm
- NERC’s 2026–27 Winter Reliability Assessment does not exist yet. NERC’s published schedule gives a release date of Nov. 18, 2026 (schedule). Every winter figure in this memo therefore comes from the 2025–26 assessment, and every forward figure from the 2025 LTRA. A reader who wants the current winter’s verdict must wait three weeks.
- The FORTRESS 90-day standard. Reported by Fox News Digital on Oct. 25, 2026 from documents it reviewed. No Department of Defense primary source states 90 days, and the spokesperson quoted throughout Fox’s report has not confirmed it. Snopes rated the claim “Mostly True” on Oct. 26, 2026 — accepting that FORTRESS is real and the posts describing it “broadly accurate” — while noting the 90-day figure remains unconfirmed (Snopes). The only published Army standard ENB could verify is 14 days (AD 2020-03).
- The scope of the Sangre de Cristo incident. The claim of access to SCADA/EMS environments and control-system credentials comes from the Incransom listing on Ransomware.live (listing). The cooperative’s own notice describes an IT network incident and says the grid was not affected (SDCEA). No regulator or utility has confirmed operational-technology access. ENB treats the OT element as an unverified claim.
- Pre-2021 EEA counts. NERC’s 2026 State of Reliability gives a clean five-year series from 2021. ENB found earlier EEA 3 counts quoted in older NERC material but could not verify them against a primary document in this session, so the chart starts in 2021.
- NESO’s Early View figure of 5.5 GW (8.8%). Quoted from NESO’s Appendix D and from Porter. ENB did not separately open the Early View publication.
- DOE’s request for information on EO 14421 implementation. ENB understands the comment window closed Oct. 9, 2026 but did not verify a primary Federal Register notice, so no date is asserted in the body.
- The FBI reward figure in the Torrance, California substation case. Widely reported at up to $25,000, but the FBI page ENB attempted to open did not resolve, so no link or figure is used.
Appendix E. Methodology
E1. How the Porter stress case was reproduced. ENB did not re-run a probabilistic model; it re-priced NESO’s own workbook at different credits. Utility-scale wind is offshore 17,023.7 MW plus onshore 15,824.8 MW = 32,848.5 MW, credited at 16.5% = 5,420.0 MW; micro-wind 576.6 MW at 13.34% = 76.9 MW; total 5,496.9 MW, matching NESO’s workbook. At a 10% credit the same utility-scale fleet yields 3,284.9 MW, a reduction of 2,135.2 MW. Interconnector credit is 6,592 MW de-rated; halving it removes 3,296 MW. Subtracting both from 5,900 MW gives 469 MW — 0.8% of the 62,100 MW ACS demand-plus-reserve denominator. Porter rounds to 0.5 GW. Every intermediate figure reproduces within rounding (4,422 vs 4.42 GW; 3,765 vs 3.76 GW; 2,604 vs 2.61 GW).
E2. What that computation does not capture. It holds every other assumption constant — nuclear, gas, biomass, hydro, storage, demand-side response and diesel all keep NESO’s de-rating factors; the demand distribution is unchanged; no transmission constraint is introduced; no correlation between wind drought and interconnector unavailability beyond the flat 50% haircut. It is a sensitivity, not a forecast, and Porter says so. It cannot say whether 10% is the right wind credit — only what the margin becomes if it is.
E3. How the reserve-margin comparison was made. For NERC areas, ENB used anticipated reserve margin (ARM) as published in the LTRA against the reference margin level (RML) for the same area and year, and reported the crossover year. Both are NERC constructs, so the comparison is like-for-like within a single LTRA vintage. It is not comparable to NESO’s de-rated margin, which uses a different denominator (average cold spell peak demand plus operating reserve), a different treatment of imports and a different reliability standard; no attempt was made to convert one into the other.
E4. Why the two systems cannot be lined up on one axis. NESO targets a loss-of-load expectation below 3 hours per year, modelled below 0.1; NERC areas target one day in ten years, which the RML encodes. A 9.5% de-rated margin in Britain and a 26.2% anticipated reserve margin in PJM are two different instruments, not two readings of one. No chart putting them on one axis appears here for that reason.
E5. EEA counts. NERC’s Figure 3.2 reports EEA 3 declarations by year and interconnection, and ENB uses NERC’s totals. WECC’s State of the Interconnection counts EEAs of all levels (eight in 2025, 30 in 2024, 21 in 2023) and is not comparable to NERC’s EEA 3 series; both are shown with definitions.
E6. Word about rounding. Percentages are quoted as published; ENB-computed percentages to one decimal place. Porter’s stress case is stated as 0.8% throughout (469 MW against 62,100 MW, 0.755% unrounded), following her own rounding of the same result to 0.5 GW, so that text, Chart 4 and Table C2 do not appear to disagree. All dollar figures are as stated in the source.
Appendix F. Background
Britain has published a de-rated winter margin every year since 2015/16 (Table C1), ranging 5.1% to 12.9%; the 2026/27 figure of 9.5% is the first on the new wind treatment, which is why the old-method equivalent sits beside it. North America’s equivalent is the reserve margin against a NERC reference margin level encoding a one-day-in-ten-years standard. Neither was built to price a fleet whose output depends on weather and neighbours’ exports.