
West Texas Intermediate (WTI) crude oil is trading around $75 per barrel today, with Brent near $78. Following the U.S.-Iran ceasefire agreement and the reopening of the Strait of Hormuz, headline prices have eased significantly from the peaks above $120 seen during the conflict.
Yet a growing disconnect exists between these paper/futures prices and the realities of physical oil delivery, tanker logistics, and critically low inventory buffers. Supply and demand will eventually converge — but the path there may involve volatility, operational constraints, and a potential near-term price spike as the market rebalances.
Cushing Storage Nears “Tank Bottom”
The key U.S. pricing and delivery hub at Cushing, Oklahoma, tells a story of tightening physical supply. According to the latest EIA data for the week ending June 12, 2026, Cushing crude inventories (excluding SPR) stood at approximately 20.03 million barrels — down from 21.64 million the prior week.
This level sits right at or just above the operational stress threshold of around 20 million barrels. Below this point, pipelines lose pressure, blending operations become difficult, and outbound flows to refineries or export terminals risk curtailment. Much of the remaining volume may include unusable “tank bottoms” (sludge, sediment, and residues).
As detailed in today’s Energy News Beat analysis, this situation stems from record U.S. crude exports filling global gaps caused by Middle East disruptions. Cushing’s role as the WTI futures delivery point and major blending hub amplifies the signal: low stocks are a classic bullish indicator for physical WTI, even as futures have pulled back.
SPR Drawdown Accelerates Toward Operational Lows
The U.S. Strategic Petroleum Reserve (SPR) has been drawn down aggressively to bridge the supply gap. As of June 12, 2026, SPR inventories stood at 340.25 million barrels — the lowest level since 1983.
Recent weekly draws have reached 8–9 million barrels, equivalent to roughly 1.2–1.3 million barrels per day. Part of a broader authorized release of up to 172 million barrels (structured partly as an exchange program), the drawdown has helped moderate price spikes and support exports.
If the current pace continues, analysts and projections suggest the SPR could approach operational minimum or stress levels — potentially in July or August 2026. While the exact “bottom” varies by cavern conditions and policy (with certified floors discussed around 243 million barrels in some contexts), further aggressive draws would leave the U.S. with diminished emergency buffers heading into hurricane season and any renewed supply risks.
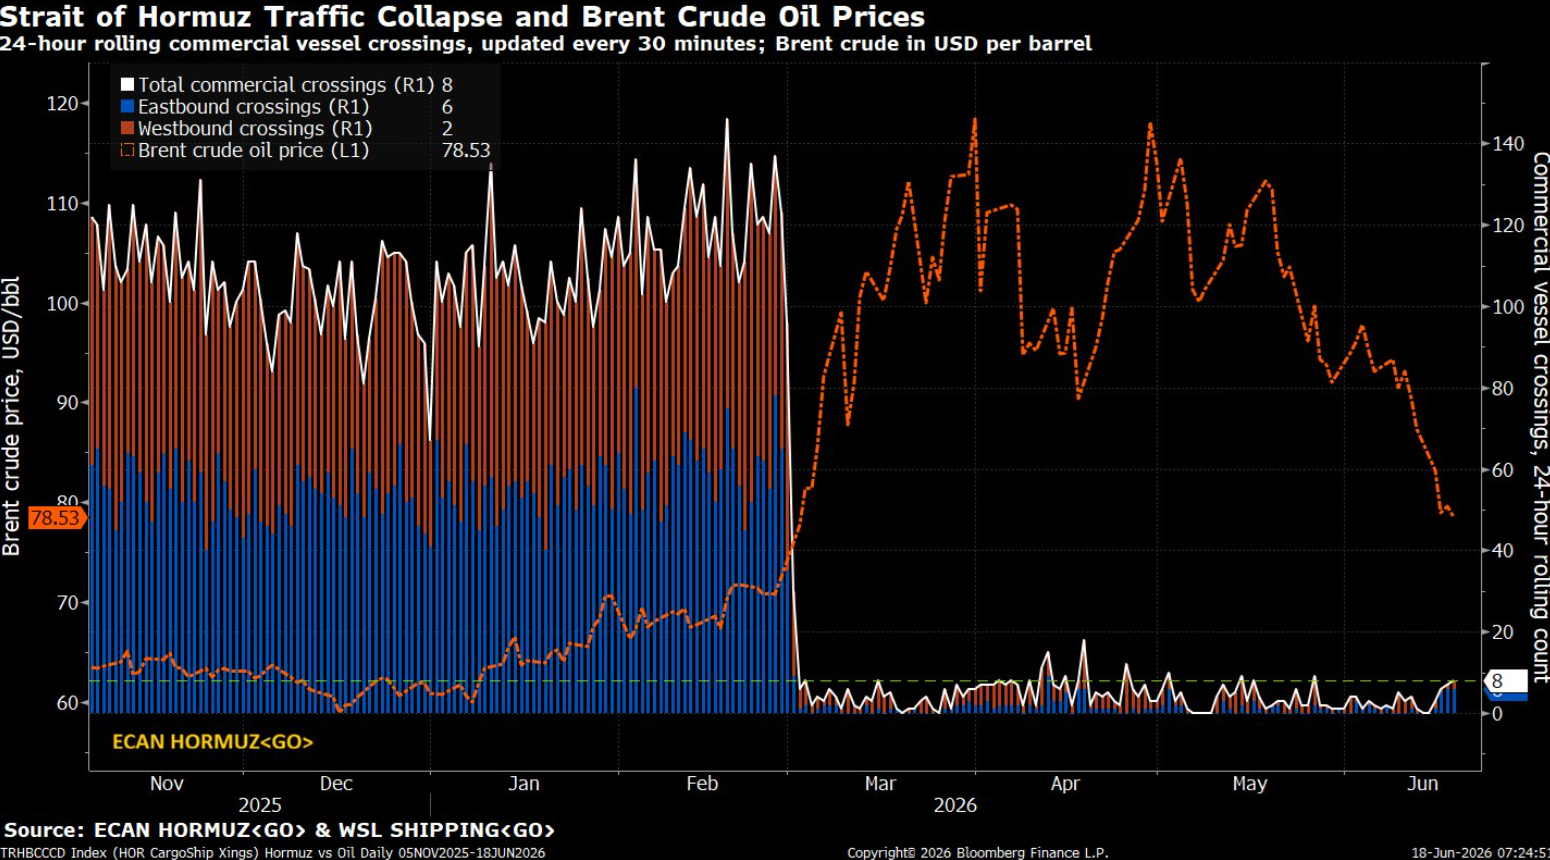
Tanker Market Signals Persistent Physical Risk
Even after the Hormuz reopening, the shipping market is pricing in caution that financial markets have largely shrugged off.
A notable post today from commodity trader Jack Prandelli highlighted real-world struggles:
“PetroChina couldn’t find a tanker. Neither could Indian Oil… PetroChina tried to hire a VLCC… Got 6 offers. All at freight rates nearly triple pre-war levels. Still couldn’t close a deal… ‘There are tankers available, but the problem is it’s too expensive, and there is no guarantee you can exit the strait.’”
A Reuters report confirmed the details: PetroChina received offers at worldscale 650–750 (nearly 3x pre-war rates), Indian Oil received zero offers on its tender and declared force majeure, and Sinochem continues searching. Special insurance clauses for Hormuz transit remain a hurdle despite the deal.
Global VLCC tanker rates have surged dramatically, with some indices reaching multi-year highs. This reflects tight vessel availability, longer effective ton-miles, and lingering risk premiums — a clear signal that physical oil movement from the Gulf remains constrained and expensive.
What Are Analysts Saying This Morning?
Market commentary today reflects the divide between headline relief and underlying fundamentals:
Many traders and analysts note that the ceasefire has “priced in” increased supply flows, supporting expectations of further stabilization or modest downside in futures if Hormuz remains open and Middle East output normalizes.
However, physical bulls highlight the inventory draws (both commercial and SPR), Cushing tightness, and elevated tanker rates as evidence that rebalancing will take time. Low buffers leave the market vulnerable to any delay in supply restoration or stronger-than-expected summer demand.
Broader views range from cautious optimism on eventual price moderation (with some long-term forecasts targeting lower averages later in 2026–2027) to warnings of near-term upside risk if operational constraints at key hubs or shipping bottlenecks persist.
The consensus appears to be: the easy part of the price decline is likely behind us; the harder work of physical restocking and logistical normalization lies ahead.
Will There Be a Price Spike?
A near-term spike is plausible while things balance out. Low commercial inventories at Cushing, ongoing SPR depletion, and stubbornly high tanker rates create conditions where even modest delays in new supply or stronger demand could quickly tighten the physical market. Historical precedent shows that when key hubs approach operational limits, WTI can see sharp moves higher to ration available barrels and incentivize flows.
That said, a full-blown crisis is not inevitable. Natural market forces — tighter WTI-Brent spreads reducing export arbitrage, potential OPEC+ responses, and gradual resumption of Gulf loadings — could ease pressure. Restocking Cushing and rebuilding SPR buffers will take months, not days.
Supply and demand will meet eventually. The current ~$75 WTI price reflects optimistic assumptions about rapid normalization. Physical realities — visible in tank levels, emergency reserves, and shipping costs — suggest the market may need higher prices at times to clear imbalances, manage demand, or attract incremental supply before full equilibrium returns.
Energy participants, consumers, and investors should watch closely: weekly EIA inventory reports (especially Cushing and total crude), tanker rate trends, and any operational updates from key hubs. The gap between paper and physical is narrowing — one way or another.
Appendix: Sources and Links
- Jack Prandelli X post (June 18, 2026): https://x.com/jackprandelli/status/2067542035905626503
- Reuters: “PetroChina, Indian Oil fail to secure tankers to load Iraqi crude, sources say” (June 18, 2026): https://www.reuters.com/business/energy/petrochina-indian-oil-fail-secure-tankers-load-iraqi-crude-sources-say-2026-06-18/
- Energy News Beat: “Cushing, Oklahoma Oil Storage Hits Tank Bottom…” (June 18, 2026): https://energynewsbeat.co/crude-oil/cushing-oklahoma-oil-storage-hits-tank-bottom-implications-for-energy-markets-consumers-and-investors/
- EIA Weekly Petroleum Status Report (data for week ending June 12, 2026, released June 17): https://www.eia.gov/petroleum/supply/weekly/
- EIA Cushing Crude Oil Stocks historical data: https://www.eia.gov/dnav/pet/hist/LeafHandler.ashx?n=PET&s=W_EPC0_SAX_YCUOK_MBBL&f=W
- YCharts / DOE data on SPR levels (as of June 12, 2026): Referenced across multiple reports including Reuters and Fortune coverage.
- Current oil prices: CME Group, Trading Economics, OilPrice.com, and market data aggregators (as of June 18, 2026).
- Additional context on SPR drawdowns and projections drawn from DOE/EIA releases and contemporaneous reporting (e.g., Fortune, Reuters, June 2026).
All data and quotes current as of publication. Markets move quickly — always verify latest figures.