
President Donald Trump’s recent comments on Fox News’ Sunday Morning Futures have sparked intense debate in energy circles. In the April 12, 2026 interview, Trump acknowledged that U.S. gasoline prices “could be the same or maybe a little bit higher” by the November midterm elections, despite earlier hopes for a quick resolution.
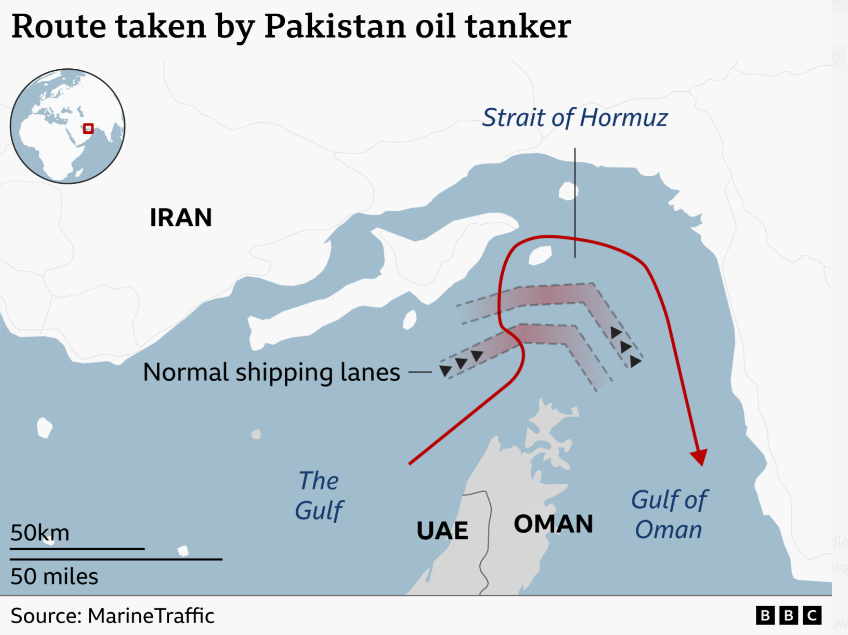
This marks a shift from downplaying the spike tied to the Iran war as purely “short-term.” As Energy News Beat has tracked, the conflict’s disruption of the Strait of Hormuz—the chokepoint for roughly 20% of global oil—triggered the largest supply shock in modern history, sending Brent crude above $100–120 per barrel at peaks and U.S. gas prices surging toward $4+ nationally (with California far higher).
The tweet from energy analyst Anas Alhajji captured it perfectly: “That proves the point: There are issues that are bigger than the elections… Trump says gas prices may remain high through the November midterm election.” (Attached image from Reuters headline.)
Is Trump accurate? Let’s break it down with timelines for unwinding the crisis, shipping logistics, production restarts, regional impacts (especially California and the U.S. Gulf Coast), and production vs. demand fundamentals.
The Iran War Unwind: Why Full Recovery Takes Months, Not Weeks
The war (escalating in late February/early March 2026) shut down much of the Persian Gulf’s energy infrastructure. Even with fragile ceasefires and partial ship passages resuming, analysts warn that normalization will be slow.
Ships moving in 2–3 weeks? Optimistic scenarios (per Reuters and industry sources) suggest a backlog of ~2,000 stranded tankers could clear in 1–2 weeks if hostilities fully pause. Some vessels have already moved under limited permissions.
Tankers around the world: Transit times vary dramatically. From the Persian Gulf to Asia: ~20–30 days. To Europe: 20–40 days. To the U.S. Gulf Coast: 35–60 days (one-way voyage, plus loading/unloading). Round trips can take 2–3 months.
To refineries and refilling: Crude must reach ports, unload (1–2 days), then refine into gasoline, diesel, and jet fuel (days to weeks depending on complexity). Global inventories drained rapidly; rebuilding stocks could take additional months as Gulf producers prioritize exports.
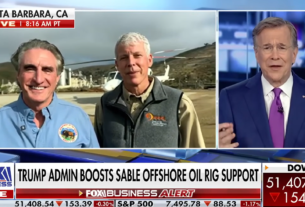
Restarting drilling operations: Small fields can restart in days/weeks; larger ones 4–5 weeks. Kuwait expects 3–4 months for full output. Damaged infrastructure (refineries, pipelines) may take years to repair. U.S. shale can ramp faster (weeks with rigs ready), and Trump’s Defense Production Act orders have restarted some California offshore drilling (e.g., Santa Ynez Unit targeting 50,000 bpd by early April). But Gulf producers face months of lag.
Bottom line on Trump’s accuracy: Even under the best-case ceasefire, the market stays tight through Q2–Q3 2026. Steepest deficits hit in Q2 (~3 million bpd), with full normalization lagging into late 2026 or beyond. Prices “around the same or a little higher” by midterms? Highly plausible—analysts see Brent averaging well above pre-war levels for months.
California and the West Coast: Hit Hardest by Asia’s Export Curbs
Asia is prioritizing domestic needs amid the shock. China banned exports of refined products (diesel, jet, gasoline) in March; South Korea, Thailand, and others slowed or halted shipments. This directly squeezes the U.S. West Coast (PADD 5), which relies heavily on Asian imports for jet fuel (South Korea supplies ~85% of U.S. West Coast jet imports) and other products.
California’s challenges compound this:
Declining local production and refinery closures (e.g., Valero Benicia adding to ~8% capacity loss).
Unique “boutique” gasoline specs that no other U.S. refineries produce—imports must cross the Pacific.
Already elevated prices (often $1.60+ above national average); further spikes to $6–$8/gallon possible this summer.
West Coast refiners are cutting runs due to feedstock shortages, while aviation and driving demand peaks. Tanker diversions to the Gulf Coast for U.S. exports only worsen Pacific supply tightness. Expect sustained premiums and potential shortages or rationing pressure on the West Coast.
U.S. Gulf Coast: Export Boom as Tankers Queue for American Barrels
Paradoxically, the Gulf Coast is a bright spot for U.S. producers. Asia and Europe—cut off from Middle East supply—are snapping up U.S. crude, diesel, and gasoline. Tanker availability at the Gulf has plummeted 41% in recent weeks; VLCCs have halved, and Suezmax/Aframax are even tighter.
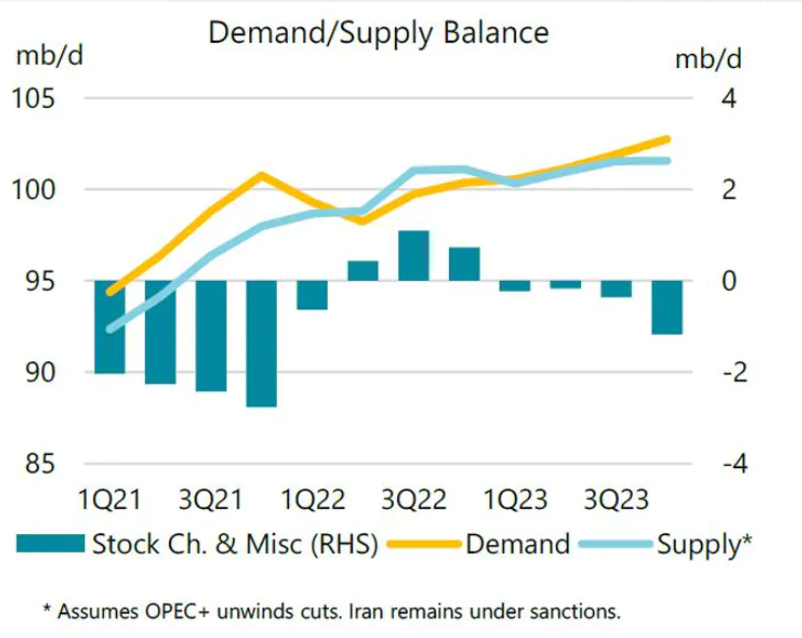
U.S. exports surge, supporting domestic drilling and refining margins—but this diverts vessels that might otherwise serve imports elsewhere. Net effect: more global barrels moving, but at higher freight costs that keep prices elevated.Production vs.
Demand: Charts Tell the Story
Pre-war forecasts showed comfortable surpluses. The Iran shock flipped the 2026 market into deficit (average ~750,000–2.13 million bpd loss annually). Q2 sees the deepest shortfall before any Q4 surplus.
Global Consumer Outlook: Elevated Prices Persist
Brent currently trades around $97–98/bbl (as of April 13, 2026), down from peaks but still ~50% above year-ago levels.
Consumers worldwide face higher pump prices through 2026, with U.S. averages likely $3.50–$4.00+/gallon nationally (higher on coasts). Diesel and jet fuel tightness adds inflationary pressure on goods and travel. OPEC+, U.S. shale, and SPR draws provide buffers—but not enough for a quick return to “normal.”
Conclusion: Bigger Than Elections
Trump’s candid assessment aligns with energy realities. The Iran war’s unwind is a marathon, not a sprint. Geopolitics, logistics, and market balances point to elevated prices through the midterms and beyond. Energy security—not politics—drives the timeline. Policymakers and consumers should prepare accordingly.
If President Trump pulls some strings with his 7 potential Executive Orders for California, he may help hold prices down for half the United States, and we will be the first to cheer for his decisions to protect California, Nevada, Utah, Washington, and Oregon from Gavin Newsom.
- X Post by
@anasalhajji
(April 13, 2026): https://x.com/anasalhajji/status/2043692923678601287
- NYT: Trump on gas prices (April 12, 2026) – https://www.nytimes.com/2026/04/12/us/politics/trump-gas-prices-high-midterms-republicans.html
- USA Today, Reuters, The Hill, Independent, etc., on Trump statement.
- Reuters: Oil whiplash/Iran deficit (April 10, 2026) – https://www.reuters.com/business/energy/oil-whiplash-iran-war-shock-flip-market-deficit-2026-analysts-say-2026-04-10/
- Wikipedia/Economic impact of 2026 Iran war.
- Fortune/EIA on price forecasts and timelines.
- Politico on state impacts.
- Argus Media, gCaptain, Reuters on Asia export curbs and West Coast.
- EIA/IEA Short-Term Energy Outlooks and charts (various 2026 reports).
- Shipping times: Quora, Facebook industry posts, Reuters tanker data.
- Drilling restart: LA Times, Yahoo, ABC10 on Trump orders (March 2026).
- Bloomberg, El Pais, NYT on recovery timelines (months/years).
All data as of April 13, 2026. Markets move fast—monitor EIA, IEA, and real-time tanker tracking for updates. Energy News Beat will continue covering every twist.